Stock Scanner Without Pine Script: 200+ Ready-Made Screens
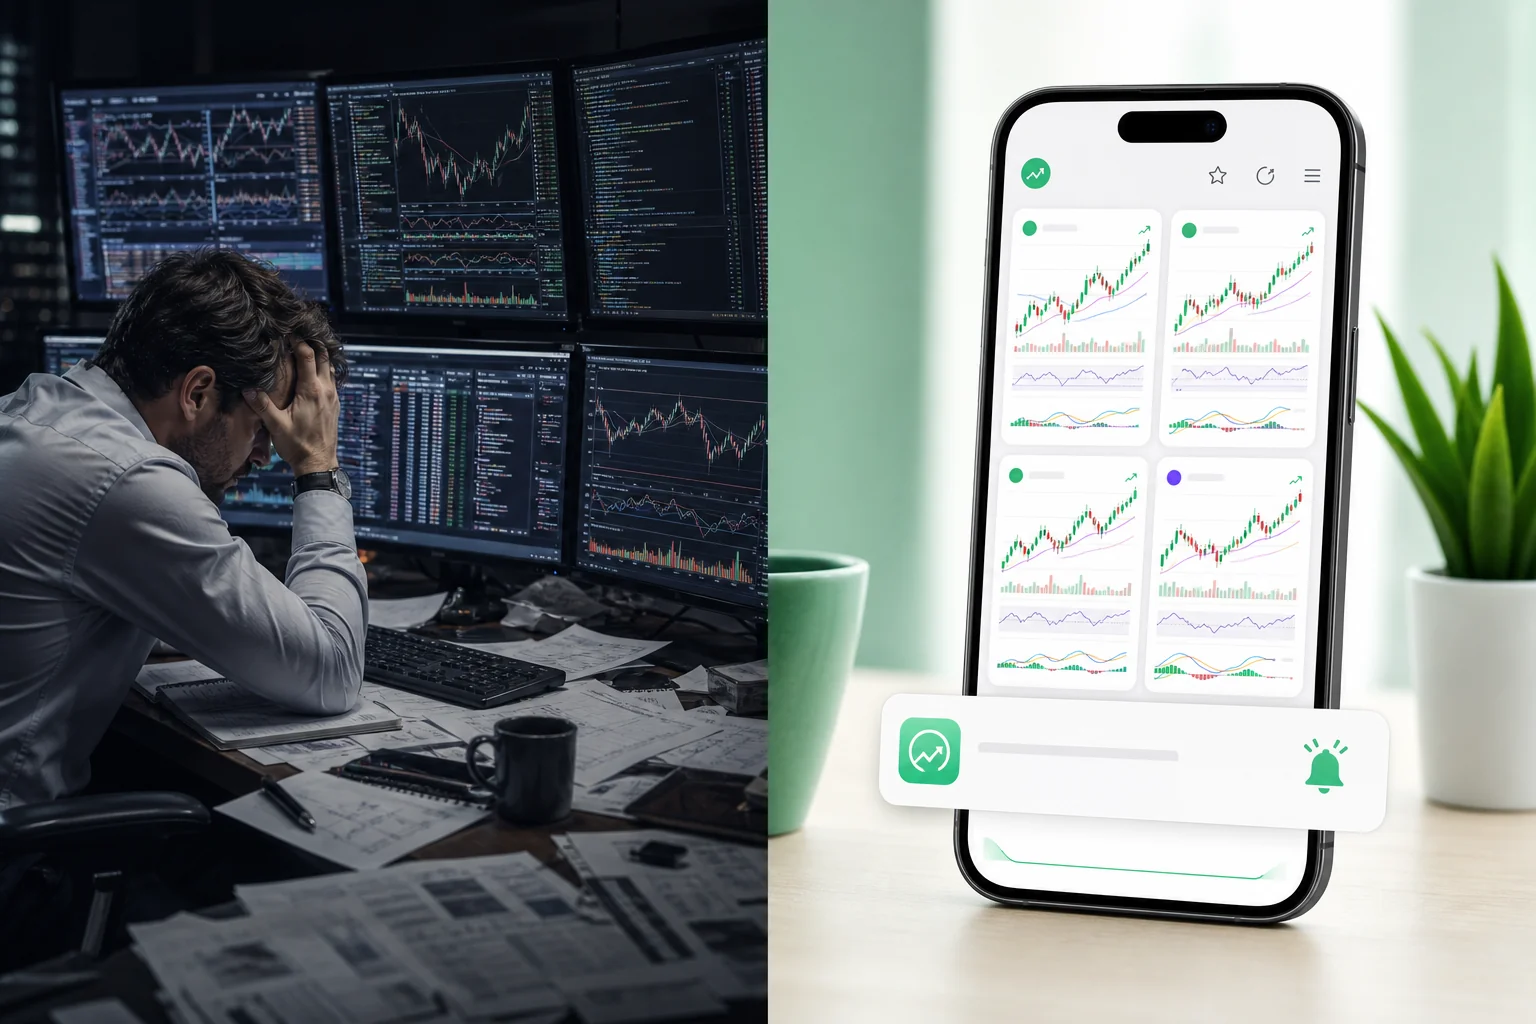
Let's be honest about something most trading platforms won't say out loud: Pine Script is a programming language. And if you didn't sign up to become a developer, being told "just write a custom alert" is about as helpful as telling someone to build their own car because they need to get to work.
The dirty secret of code-first stock scanners is that the barrier to entry isn't the subscription fee — it's the 40-hour learning curve sitting between you and a working alert. Meanwhile, the market doesn't wait. Breakouts happen at 9:47 AM on a Tuesday. VWAP reclaims fire at 10:15. And you're still on Stack Overflow trying to figure out why your Pine Script throws a "series not allowed" error.
This guide breaks down exactly what you're giving up by staying on a code-first platform, what a stock scanner without Pine Script coding actually looks like in practice, and how 200+ pre-built technical screens can replace months of scripting work — starting today.
The Pine Script Tax: What Coding-First Platforms Actually Cost You
TradingView is genuinely excellent at what it does. The charting is world-class. The community is massive. But there's a specific moment every non-coding trader eventually hits: you want a real-time alert for a VWAP reclaim with above-average volume, and the platform's answer is "write a Pine Script."
That's what we call the Pine Script tax — the hidden cost of using a platform that requires coding to unlock its most powerful features.
The Learning Curve Is Steeper Than It Looks
Pine Script is TradingView's proprietary scripting language. It's not Python. It's not JavaScript. It has its own syntax, its own quirks, and its own version history (Pine Script v5 broke a lot of v4 scripts). According to TradingView's own documentation, even basic custom indicators require understanding series data, conditional logic, and function scoping. For a trader who just wants to know when a stock crosses VWAP on high RVOL, that's a significant detour.
Most traders who try to learn Pine Script fall into one of three camps: they spend weeks building something that half-works, they copy scripts from the public library without understanding what they do, or they give up and go back to manual scanning. None of those outcomes are good for your trading.
The Opportunity Cost Is Real
Every hour spent debugging a Pine Script alert is an hour not spent reviewing charts, refining your entries, or actually trading. And the irony is brutal: the whole point of building a scanner is to save time. If the setup process costs you 20 hours, you'd need to recover that time through better trade discovery before you break even on the investment.
For swing traders with day jobs especially, time is the scarcest resource. You get maybe 30 minutes in the morning, a lunch break, and an hour after market close. Spending that window on scripting instead of setup review is a real trade-off, and it's one most traders don't consciously make. They just drift into it because the platform pushes them there.
If you're already feeling this friction, the guide to building an efficient trading workflow in 2026 is worth reading alongside this one, it covers how to structure your limited time for maximum setup quality.
Alert Quality Suffers When You're Not a Developer
Even traders who push through and learn Pine Script often end up with alerts that are technically functional but practically noisy. A script that fires every time price crosses a moving average, without volume confirmation, without context, without any explanation of why this particular cross matters, is just alert spam with extra steps.
Professional-grade scanning isn't just about triggering on a condition. It's about triggering on the right condition, with the right confluence of factors, at the right time. Building that into a Pine Script requires significant expertise. Getting it pre-built, backtested, and explained in plain English is a fundamentally different proposition.
What a No-Code Stock Scanner Actually Gives You
A no-code stock scanner doesn't mean a dumbed-down scanner. It means the hard work of building, testing, and validating the screens has already been done for you, by people who understand both the technical setups and the code required to scan for them.
The difference is where the expertise lives. On TradingView, the expertise has to live in your head (or your Pine Script). On a platform like ChartMath, it lives in the product itself.
Pre-Built Screens vs. Custom-Coded Alerts
Pre-built screens aren't just "simpler" versions of custom alerts. In many cases, they're more sophisticated, because they were built by people who had the time and expertise to get them right. A well-designed ORB screen, for example, accounts for the opening range window, volume confirmation, the relationship between the breakout candle and the prior day's range, and the broader market context. Replicating all of that in Pine Script from scratch is a multi-day project for an experienced coder.
When you activate a pre-built screen, you're not compromising on quality. You're skipping the build phase and going straight to the results.
Backtest Data Baked In
One of the most underrated features of a well-designed no-code scanner is built-in backtest validation. Every screen should come with historical performance data, win rates, average returns, drawdown profiles, so you know whether a setup has an actual edge before you trade it.
On TradingView, backtesting requires either the Strategy Tester (which has its own learning curve) or a separate Pine Script strategy. On a platform with pre-built screens, that data is already there. You can see that a particular VWAP reclaim setup has a 58% win rate over the last 18 months before you ever take a trade on it. That's a fundamentally different starting point. For a deeper look at how to use that data, the complete guide to backtesting strategies walks through exactly what the numbers mean.
Explainable Alerts That Tell You Why
The other thing that gets lost in code-first platforms is context. An alert that says "AAPL crossed above VWAP" is technically accurate and practically useless. You don't know if volume confirmed it. You don't know if it's the third failed attempt or a clean reclaim. You don't know what the historical edge on this specific setup looks like.
A well-designed no-code scanner sends alerts that explain the trigger in plain English: what setup fired, what conditions were met, and what the historical performance of that setup looks like. That's the difference between an alert you act on and an alert you ignore.
The 200+ Screen Library: What's Actually Inside
The real test of any no-code scanner is the depth of its screen library. A handful of generic screens isn't enough. You need coverage across every major setup type, every timeframe, and every trading style, from intraday momentum plays to multi-day swing setups.
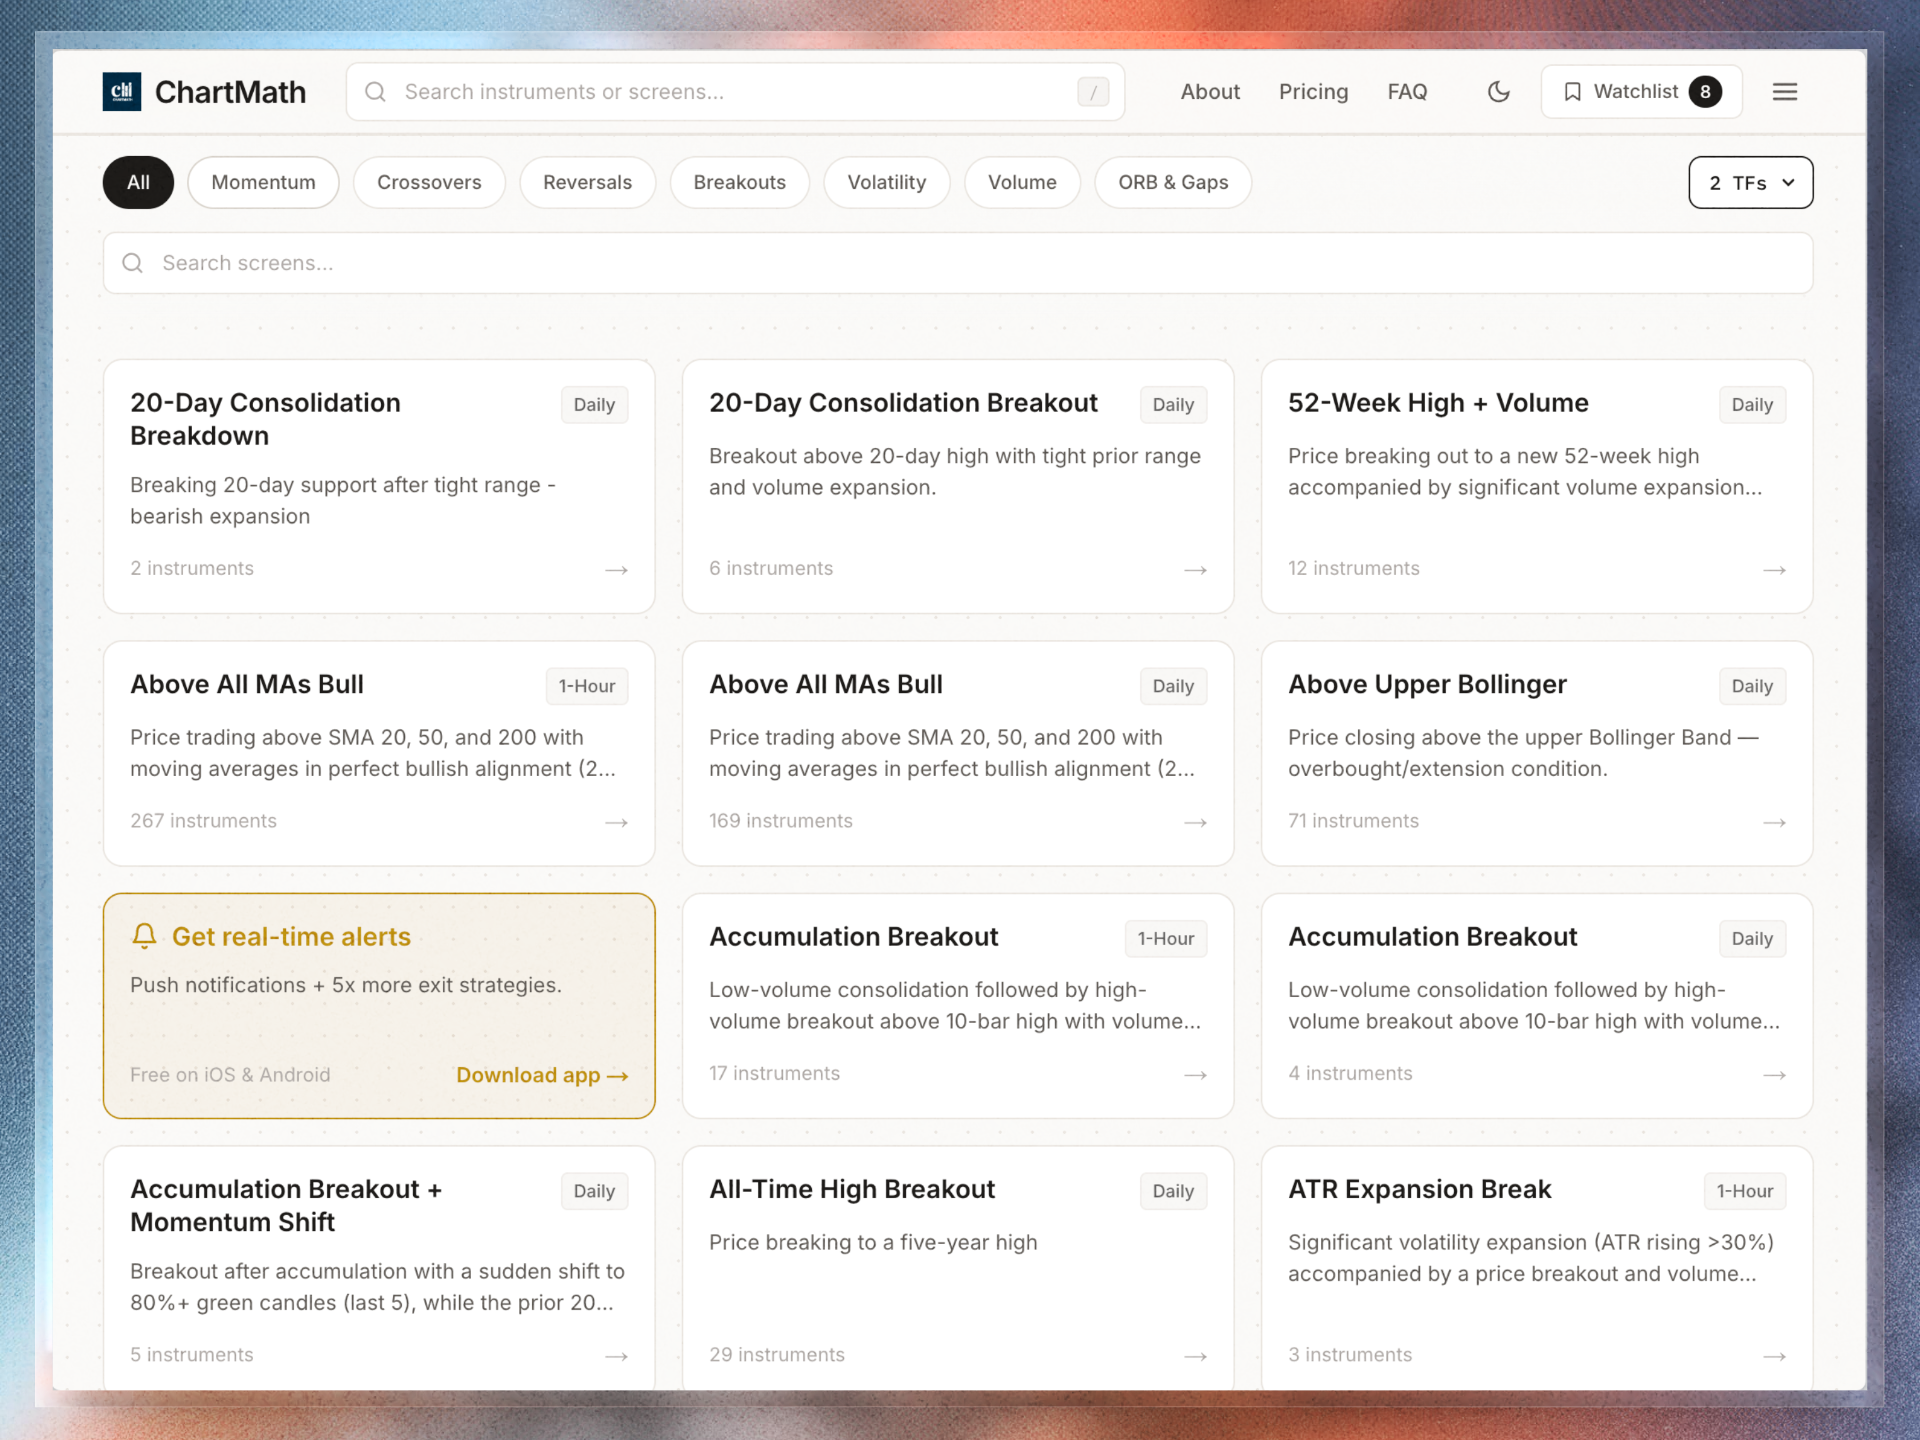
ChartMath's screen library at chartmath.com/screens covers 200+ curated technical screens across the following categories:
Opening Range Breakout (ORB) Screens
ORB is one of the most reliable intraday setups in technical trading, and one of the most annoying to scan for manually. The opening range forms in the first 5, 15, or 30 minutes of the session, and a breakout above or below that range on volume is the trigger. ChartMath's ORB screens handle all of that automatically, across multiple timeframes, and fire the alert the moment the breakout confirms. No Pine Script required. For a full breakdown of the strategy itself, the VWAP vs RVOL vs ORB comparison is a good reference.
VWAP Screens
VWAP trading is nuanced. A simple price-crosses-VWAP alert fires dozens of times a day on any active stock. What you actually want is a confirmed VWAP reclaim, price crossing above VWAP with volume expansion, holding above for at least one candle, and ideally with RVOL above a meaningful threshold. ChartMath's VWAP screens encode that logic without requiring you to write a single line of code. The VWAP trading guide covers the underlying strategy in detail if you want to understand the mechanics behind the screens.
RVOL and Momentum Screens
Relative volume (RVOL) is the single best early indicator of a stock that's about to move. When a stock is trading at 3x, 5x, or 10x its average volume, something is happening, and you want to know about it before the move is over. ChartMath's RVOL screens scan the entire market in real time and surface stocks with unusual volume activity, filtered by price range, float, and sector to reduce noise. Pair that with momentum screens that track rate-of-change and price acceleration, and you have a complete picture of what's moving and why.
Breakout and 52-Week High Screens
Breakout trading is about catching stocks at the moment they clear a key level, a prior high, a consolidation range, or a 52-week high, on volume. These setups are straightforward in concept but tedious to scan for manually across thousands of tickers. ChartMath's breakout screens do that work continuously, so you get an alert the moment a stock clears the level, not 20 minutes later when you happen to check your watchlist. The real-time breakout trading guide covers how to act on these alerts effectively.
Swing Trading Daily Chart Screens
For swing traders who review setups after hours, the daily chart screens are the core of the library. These scan for multi-day consolidation breakouts, bull flag setups, pullbacks to key moving averages, and other patterns that set up over days rather than minutes. They run on the daily timeframe and fire alerts when a setup reaches a high-probability entry point, so you can review them after work and plan your entry for the next session.
The full library also includes premarket gap screens, earnings momentum screens, sector rotation screens, and more. Browsing the complete list at chartmath.co/screens gives you a sense of the coverage, and most traders find setups they'd never thought to scan for but immediately recognize as high-quality.
TradingView vs. No-Code Scanner: A Side-by-Side Comparison
TradingView is the world's most popular charting platform for a reason. But "best charting platform" and "best trade discovery tool" are different categories, and conflating them is how traders end up spending their evenings writing Pine Script instead of reviewing setups.
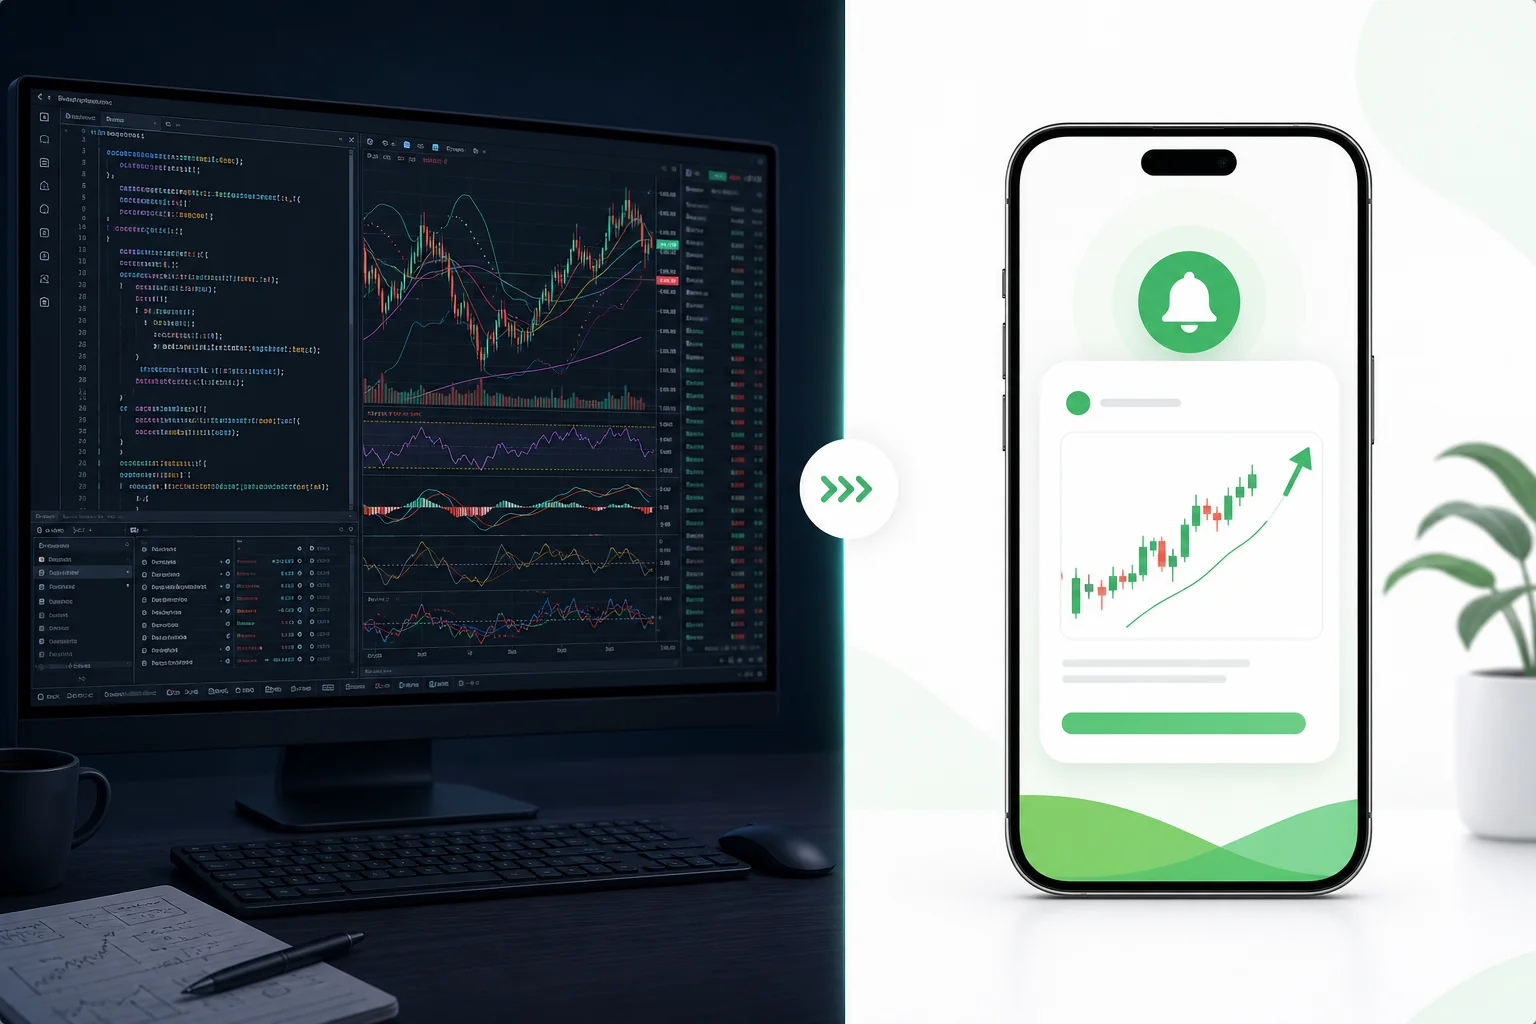
Here's how the two approaches stack up across the dimensions that actually matter for trade discovery:
Setup Time
TradingView with Pine Script: Building a functional custom alert for a specific setup (say, VWAP reclaim with RVOL above 2x) requires writing and testing a Pine Script, debugging syntax errors, validating the logic against historical data, and then setting up the alert conditions. Realistically, 4-8 hours for a non-coder, and that's for one alert.
No-code scanner: Browse the screen library, activate the screens that match your trading style, set your notification preferences. Under 10 minutes. Done.
Alert Quality and Context
TradingView: Alerts fire based on the conditions you coded. If your script is good, the alerts are good. If it's not, and most non-coders' scripts aren't, you get noise. And either way, the alert message is whatever you typed into the alert dialog, with no automatic context about why this particular trigger matters.
No-code scanner: Every alert comes with a plain-English explanation of what triggered, what conditions were met, and what the historical performance of that setup looks like. You know immediately whether this is worth acting on.
Mobile Experience
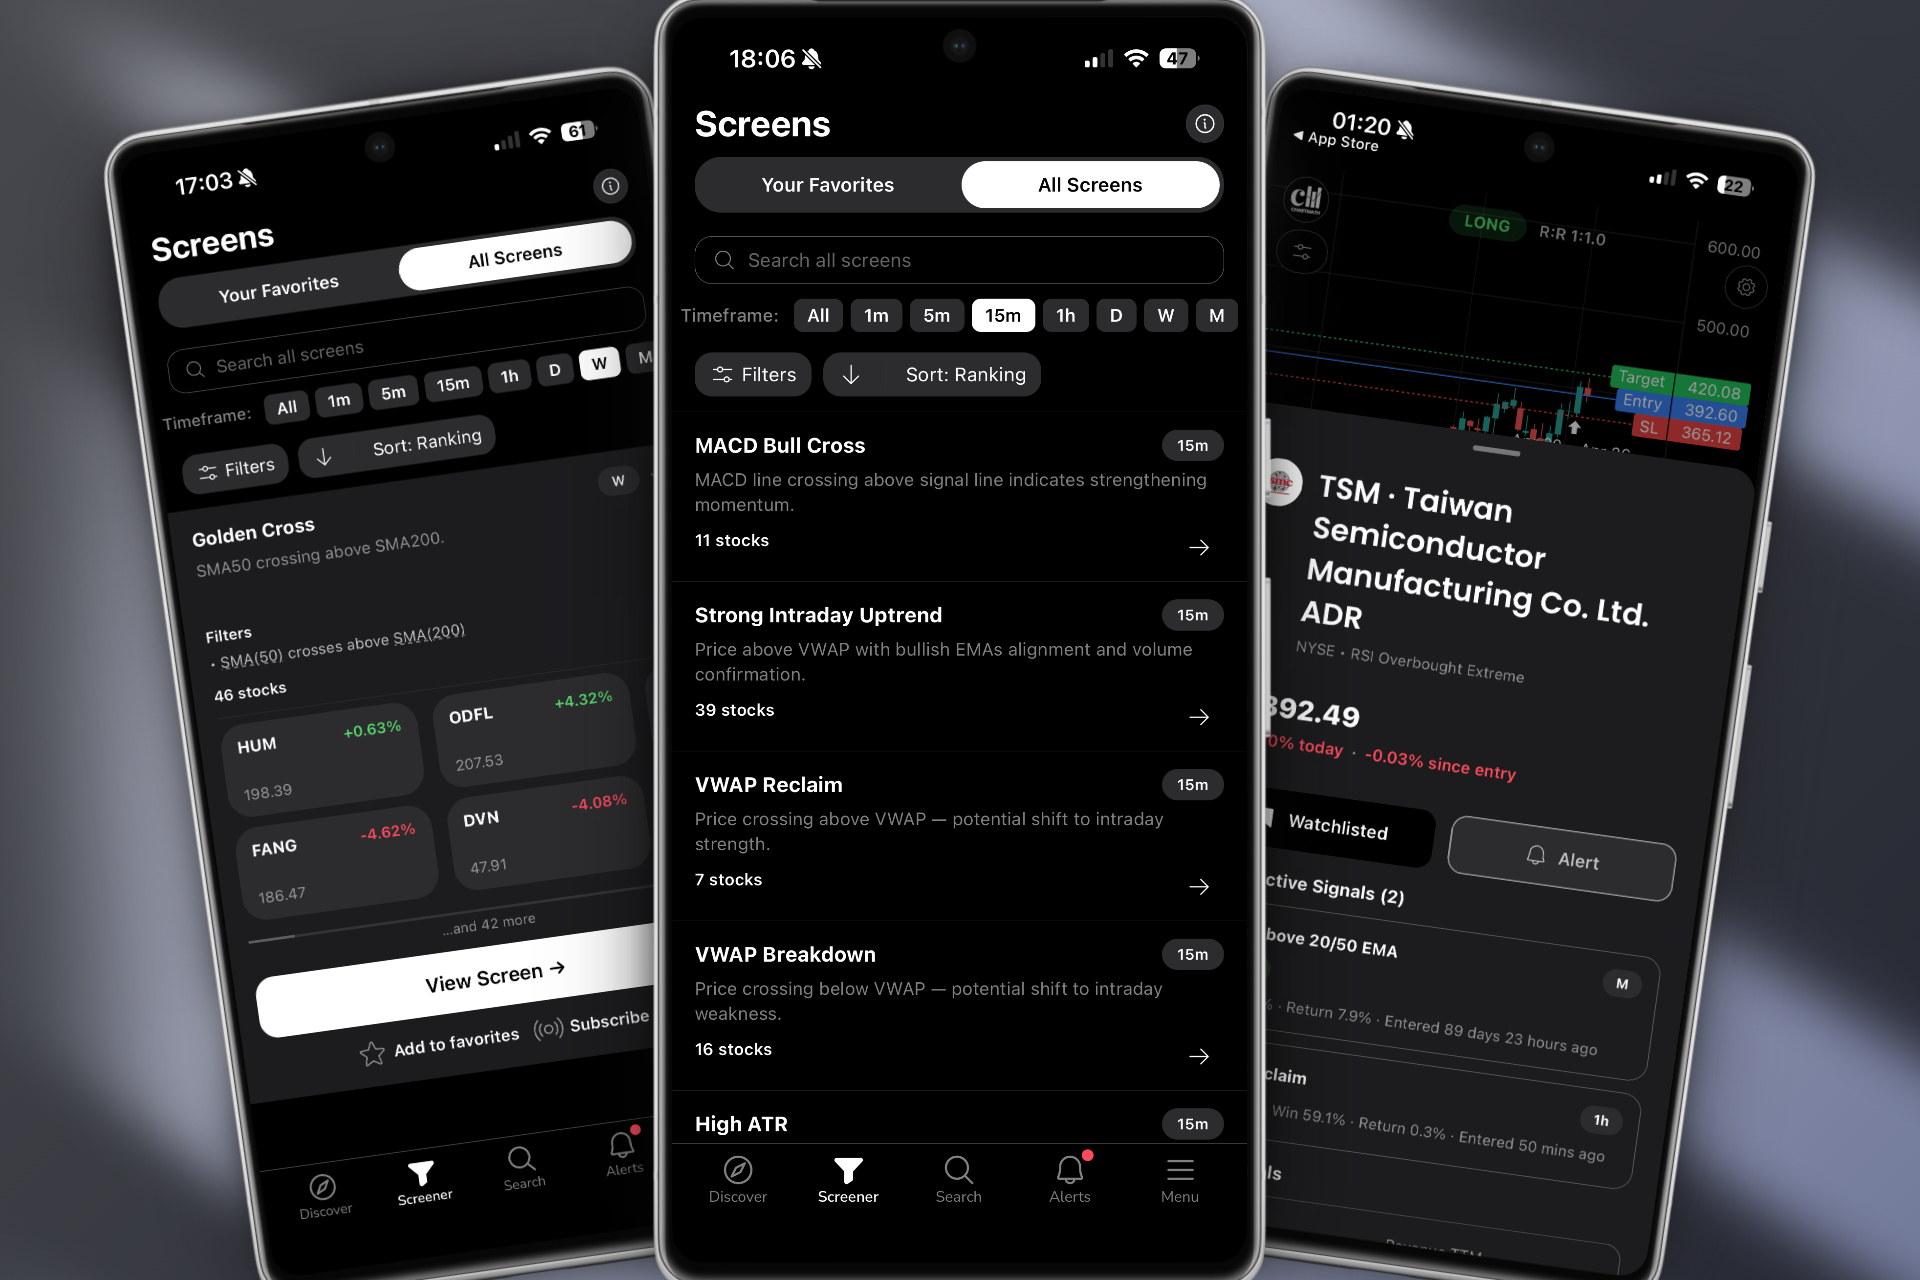
TradingView: The mobile app is functional for chart review, but it's not designed around alert-driven trade discovery. Push notifications exist but are limited, and the experience of evaluating a new setup on mobile is cumbersome compared to the desktop.
No-code scanner (ChartMath): Built mobile-first from the ground up. Push alerts fire directly to your phone with setup context. A swipe-based interface lets you evaluate setups in seconds. Designed specifically for traders who aren't at a desktop all day.
Backtest Data
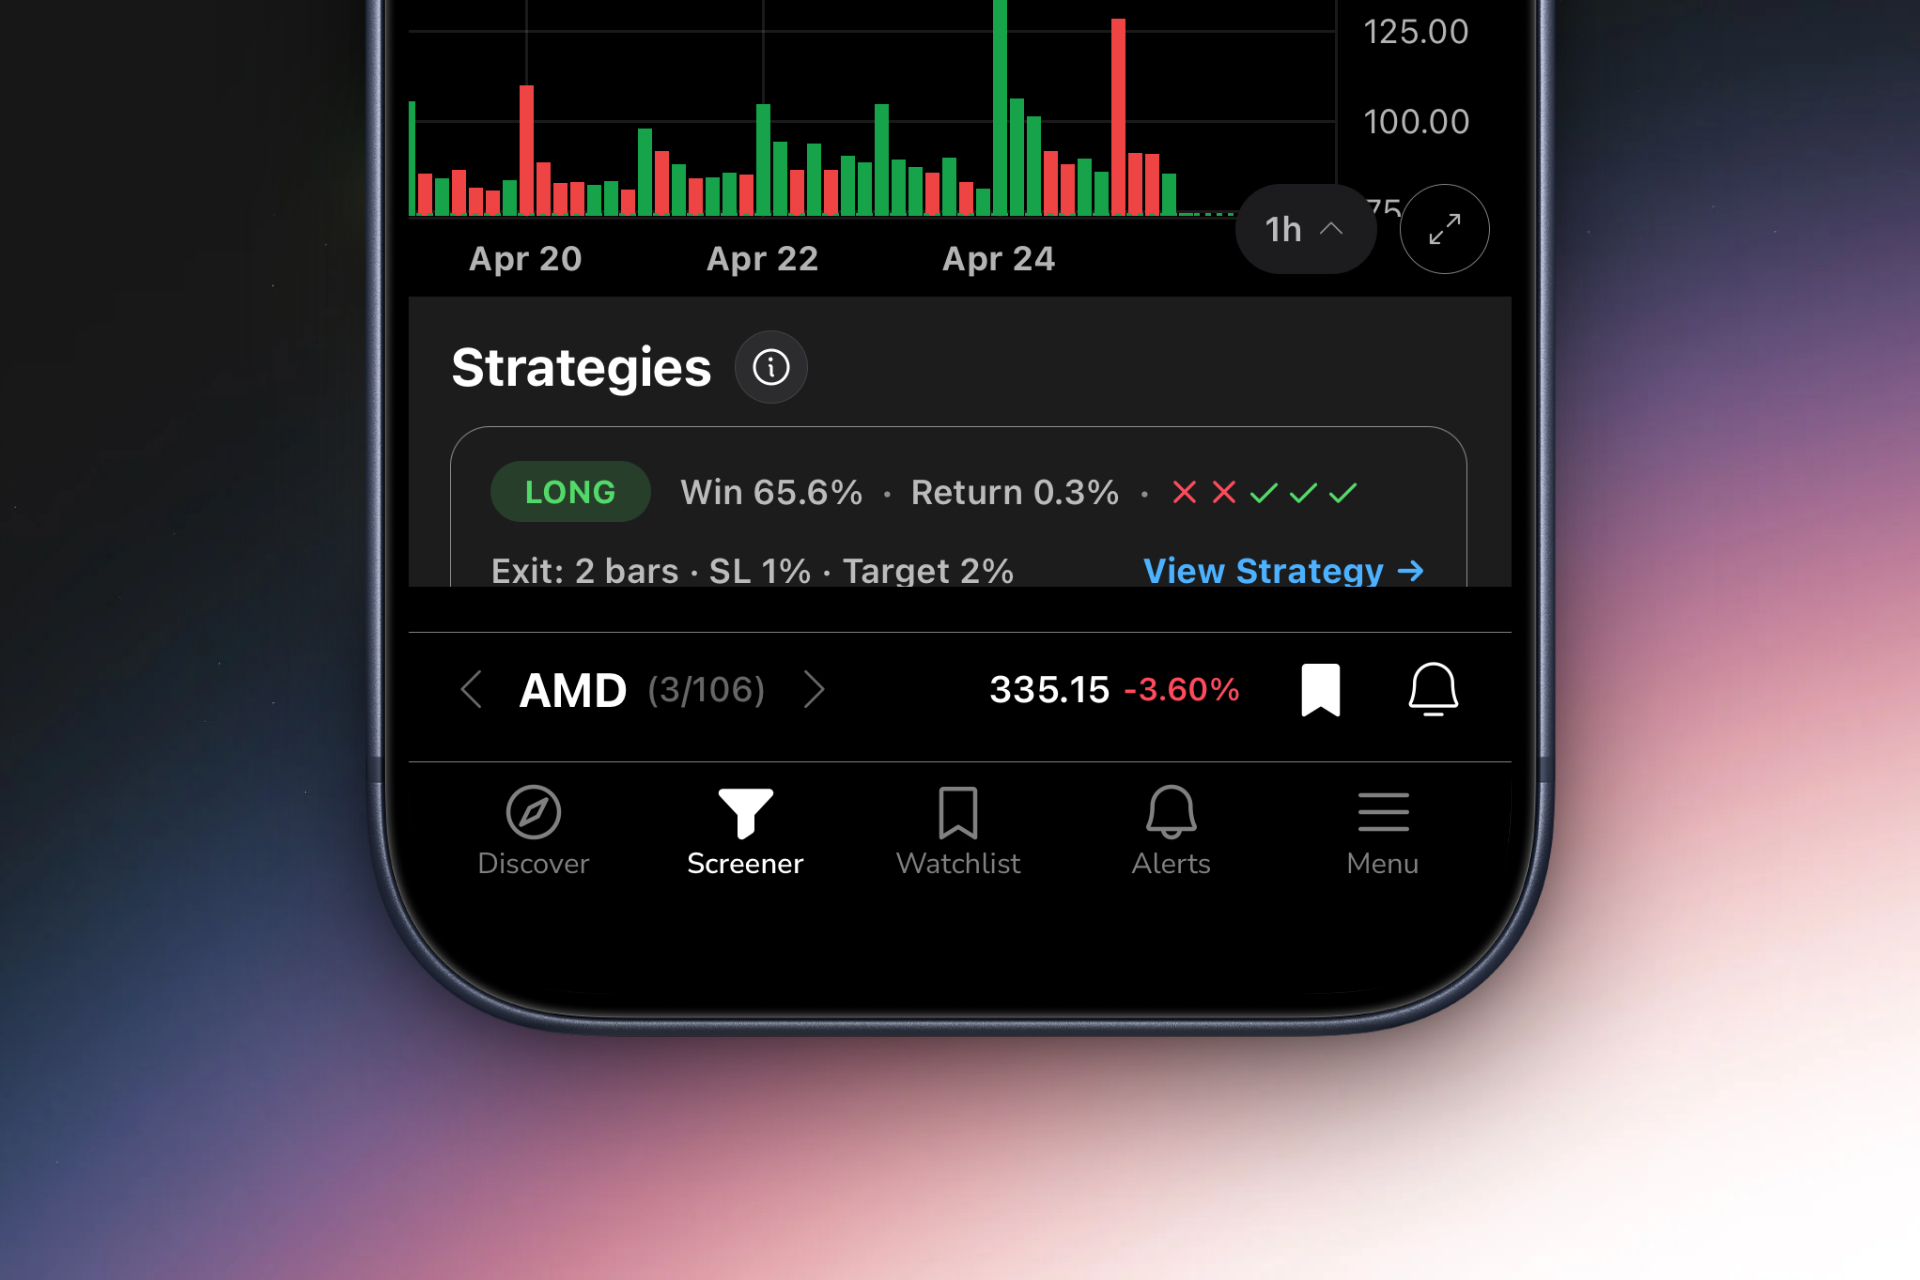
TradingView: The Strategy Tester is powerful but requires a Pine Script strategy (not just an indicator) and significant setup time. Most traders using TradingView for alerts don't have backtest data on their specific alert conditions.
No-code scanner: Historical performance data is built into every screen. Win rates, average returns, and drawdown profiles are visible before you activate a screen, so you're trading setups with a known edge, not hoping for the best.
Who Each Platform Is Built For
TradingView is built for chart analysis. It's the best tool in the world for analyzing a stock you've already identified. ChartMath is built for trade discovery, finding the stocks worth analyzing in the first place. They're complementary, not competing. Most ChartMath users keep their TradingView subscription and use ChartMath as the discovery layer that feeds it. The guide to integrating trading alerts with your charting platform covers exactly how to set up that workflow.
How the No-Code Workflow Actually Works
The workflow for a no-code scanner is deliberately simple. Here's what it looks like in practice for a swing trader with a day job:
Before market open (5-10 minutes): Check your push alerts from overnight and premarket screens. ChartMath has already scanned the market and surfaced any stocks that triggered your active screens, gap-ups with volume, premarket breakouts, stocks approaching key levels. You review the alerts on your phone during your commute or over coffee. For more on building a premarket routine, the premarket trading strategy guide is a solid reference.
During market hours (passive): You're at work. ChartMath is scanning. If an ORB breakout fires on a stock you're watching, you get a push notification with context: what setup triggered, what the volume looked like, and what the historical win rate on that setup is. You glance at it, decide whether it's worth acting on, and either place the trade from your phone or add it to your review list for later.
After market close (15-20 minutes): Review the day's alerts, check your open positions, and look at the swing trading daily chart screens for tomorrow's setups. Pull up the interesting ones in TradingView for a deeper chart review. Plan your entries for the next session.
The key insight is that the scanning happens continuously in the background, you don't have to be at a screen for it to work. That's the fundamental difference between a discovery tool and a charting platform.
You can explore the full screen library and see exactly what's available at chartmath.com/screens.
Who Should Switch to a No-Code Scanner (And Who Shouldn't)
No tool is right for everyone. Here's an honest breakdown of who benefits most from a no-code scanning approach, and who should probably stick with Pine Script.
Strong Fit: Swing Traders with Day Jobs
If you hold positions for days to weeks, trade around a full-time job, and can't watch charts intraday, a no-code scanner with mobile push alerts is close to a perfect fit. You get continuous market coverage while you're at work, explainable alerts you can evaluate in 30 seconds, and daily chart screens that surface tomorrow's setups tonight. This is the core use case ChartMath was built for.
Strong Fit: Indicator-Literate Non-Coders
You know what VWAP is. You understand RVOL. You can read a breakout setup on a chart. You just can't write Pine Script, and you shouldn't have to. If your technical knowledge is solid but your coding knowledge is zero, a no-code scanner gives you access to professional-grade screens without the development overhead.
Strong Fit: TradingView Users Who Want a Discovery Layer
You love TradingView for chart analysis. You just wish it would tell you which stocks to pull up. ChartMath is designed to be the discovery layer that feeds your existing charting workflow, not a replacement for it. Keep TradingView for analysis; use ChartMath to find what to analyze. The guide to using stock screeners for day trading covers how to integrate multiple tools effectively.
Also Works Well: Active Day Traders
If you're running intraday momentum plays and need real-time alerts for ORB breakouts, VWAP reclaims, and RVOL spikes, the no-code approach works here too. The screens fire in real time, the alerts hit your phone immediately, and the mobile-first interface is designed for quick evaluation. The "scan while you work" value proposition is less central for traders who are at a screen all day, but the alert quality and backtest context are still significant advantages over manually coded Pine Script alerts.
Stick with Pine Script If...
You need hyper-custom logic that doesn't map to any standard technical setup. You're a quantitative trader building proprietary strategies. You genuinely enjoy coding and want full control over every parameter. In those cases, Pine Script's flexibility is a real advantage, and you're probably not the person this article is written for.
Frequently Asked Questions
Do I need to cancel TradingView to use a no-code scanner?
No, and most users don't. ChartMath is designed as a discovery layer that works alongside TradingView, TrendSpider, Finviz, or whatever charting platform you already use. You use ChartMath to find setups, then pull them up in TradingView for deeper analysis. They serve different functions in the same workflow.
Are pre-built screens as powerful as custom Pine Script alerts?
For the setups they cover, yes, and often more so. Pre-built screens are built and validated by people with both technical trading expertise and coding expertise. A well-designed VWAP reclaim screen accounts for volume confirmation, candle structure, and historical context in ways that most non-coders' Pine Scripts don't. The trade-off is flexibility: if you need a setup that doesn't exist in the library, you can't build it yourself. But for the 200+ setups that are covered, the quality is professional-grade.
How do I know which screens to activate first?
Start with the setups you already trade. If you're a swing trader, activate the daily chart breakout and bull flag screens. If you're an intraday trader, start with ORB and VWAP reclaim. Browse the full library at chartmath.co/screens to see what's available, most traders find 5-10 screens that match their style immediately, and expand from there as they get comfortable with the alerts.
Can I use this for both day trading and swing trading?
Yes. ChartMath supports multiple timeframes, from 1-minute intraday screens to weekly swing setups, and you can activate screens across timeframes simultaneously. The alert delivery is the same regardless of timeframe: a push notification with context, fired the moment the setup triggers.
Can I browse ChartMath for free?
Yes. You can browse ChartMath screens free on the web. The mobile app is free. Visit chartmath.com/app to download it.
Stop Paying the Pine Script Tax
The market doesn't care whether you can write Pine Script. It doesn't reward traders who spent 40 hours building a custom alert over traders who activated a pre-built screen in 10 minutes. What it rewards is being in the right setup at the right time, and that requires a scanner that works while you're not watching.
If you've been putting off building a proper scanning workflow because the code-first platforms made it feel too complicated, that friction was never necessary. A stock scanner without Pine Script coding gives you access to 200+ professional-grade technical screens, ORB, VWAP, RVOL, breakouts, momentum, and more, with backtest data and explainable alerts, right out of the box.
Browse the full screen library at chartmath.com/screens to see exactly what's available. Then watch a quick demo to see how the alerts work in practice, or download the ChartMath app and activate your first screens today. The market opens tomorrow morning whether you're ready or not, the question is whether your scanner will be running when it does.

See these setups live in ChartMath
200+ curated screens with backtest data. Free. No credit card required.