Streak vs ChartMath: Build or Pick Your Strategy

A Streak alternative isn't automatically "better" than Streak, and if you're comparing Streak vs ChartMath, the honest answer is that they do different jobs. Streak lets you compose a trading rule from scratch and backtest it against NSE history. ChartMath skips the building step and hands you 200+ screens that are already backtested, each carrying its own win rate and average return, with push alerts when one fires on a stock you're watching.
Key Takeaways
- Different jobs, not a ranking: Streak answers "does my idea work?" ChartMath answers "which tested setups are firing right now?"
- No strategy builder in ChartMath: if you want to compose your own conditions and deploy them, Streak is the tool for that. ChartMath has no equivalent.
- actively traded NSE-listed stocks: ChartMath runs 200+ deterministic screens across this universe, each with a recomputable historical record, not a claim you take on faith.
- Time is the real variable: Streak rewards evenings spent iterating on a hypothesis; ChartMath suits traders who'd rather spend that time on trade selection and risk management.
- Educational only: nothing here is investment advice. ChartMath is not registered with SEBI as a Research Analyst or Investment Adviser, and none of this is a buy or sell call on any named stock.
At a Glance: Streak vs ChartMath
| Attribute | Streak | ChartMath |
|---|---|---|
| Core job | Build and backtest your own rule | Pick from already-tested screens |
| Strategy creation | Condition-based builder, no coding | None. 200+ curated read-only screens, no builder |
| Backtest ownership | You define and run it yourself | Pre-computed on each screen, recomputable from the fixed rule |
| Universe (India) | NSE-listed stocks and F&O | actively traded NSE-listed equities, no F&O, no BSE, no MCX |
| Alerts | On your deployed strategies | Push and email when a stock enters a screen |
| Execution | Can deploy the exact rule to a connected broker | Copilot, not autopilot. You tap to place every trade |
| Best suited for | Traders with a specific hypothesis and time to iterate | Traders who want tested setups without building anything |
The Tuesday Evening Moment Every NSE Swing Trader Knows
You're home from work, it's a little past 8 PM, and you have maybe forty minutes before dinner and family time take over. Your phone has three tabs open: one chart, one screener, one half-written note about a moving average crossover idea you've had for two weeks. You have two options tonight. You could open a strategy builder and start testing that crossover idea against five years of NSE data. Or you could open a feed of setups that are already tested and see what's firing on stocks you actually hold.
Both are legitimate ways to spend that forty minutes. The trap is picking the wrong one for who you are right now, and then feeling like the tool failed you when really the mismatch was between the tool's job and your evening.
What Streak Is Genuinely Built For
Streak exists so you can turn a specific idea into a rule and test whether it actually held up historically. You pick indicators, combine conditions with AND/OR logic, set entry and exit criteria, and run the whole thing against NSE price history without writing a single line of code. If it backtests well, you can deploy it live through a connected broker.
That's a genuinely powerful workflow, and there's no honest way to describe it as a lesser version of anything. It rewards a trader who has a concrete hypothesis, something like "RSI below 30 combined with a bullish MACD cross on the daily chart, exit at 2R or 5 days," and the patience to iterate: tweak a parameter, rerun the backtest, tweak again. If you enjoy that process, or you have a rule in your head that no pre-built screen would ever capture exactly, Streak is doing a job ChartMath simply does not attempt.
Say this plainly: ChartMath has no strategy builder. You cannot compose your own conditions inside it. If your evening's goal is to test an original idea, Streak is the tool for that job, full stop.
What ChartMath Is Built For
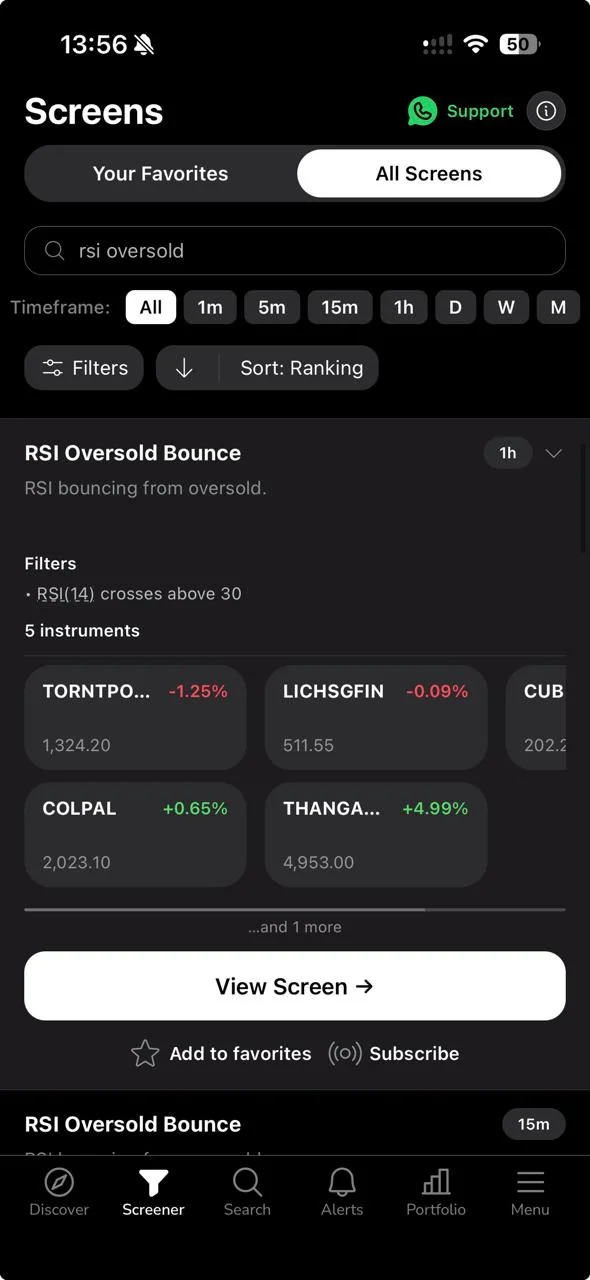
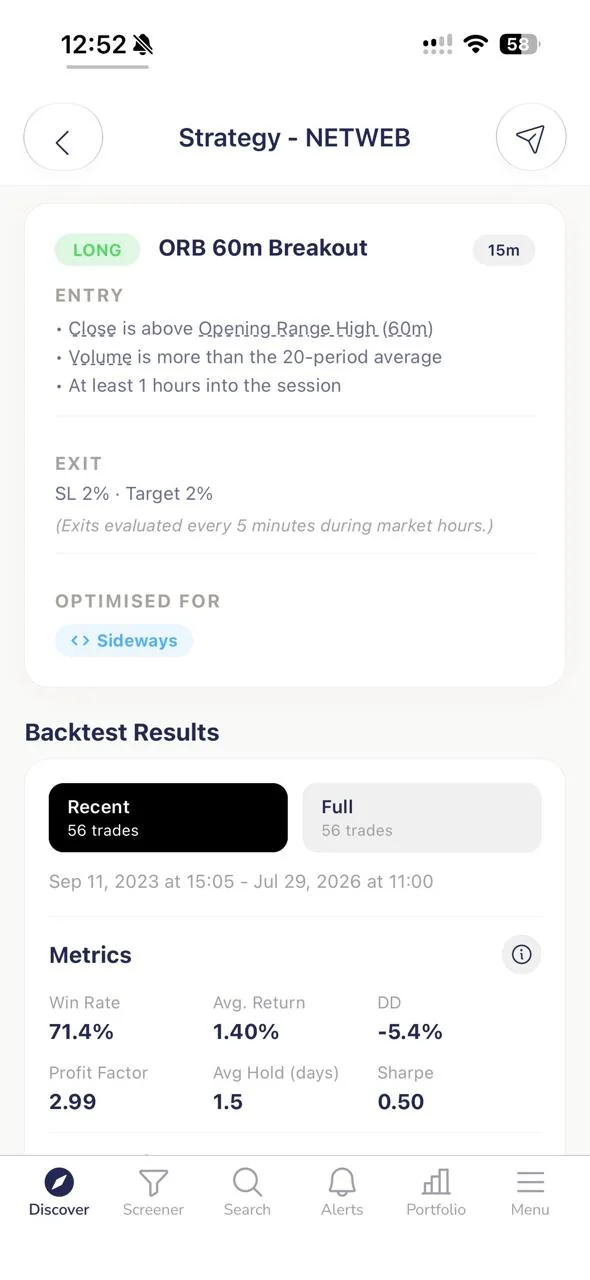
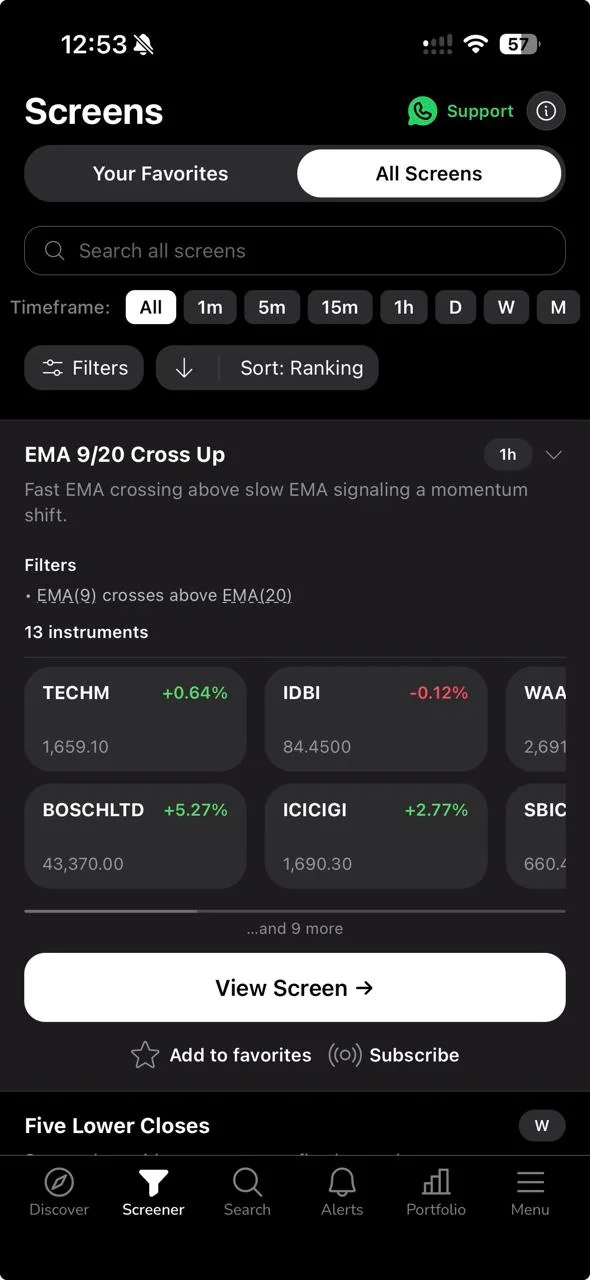
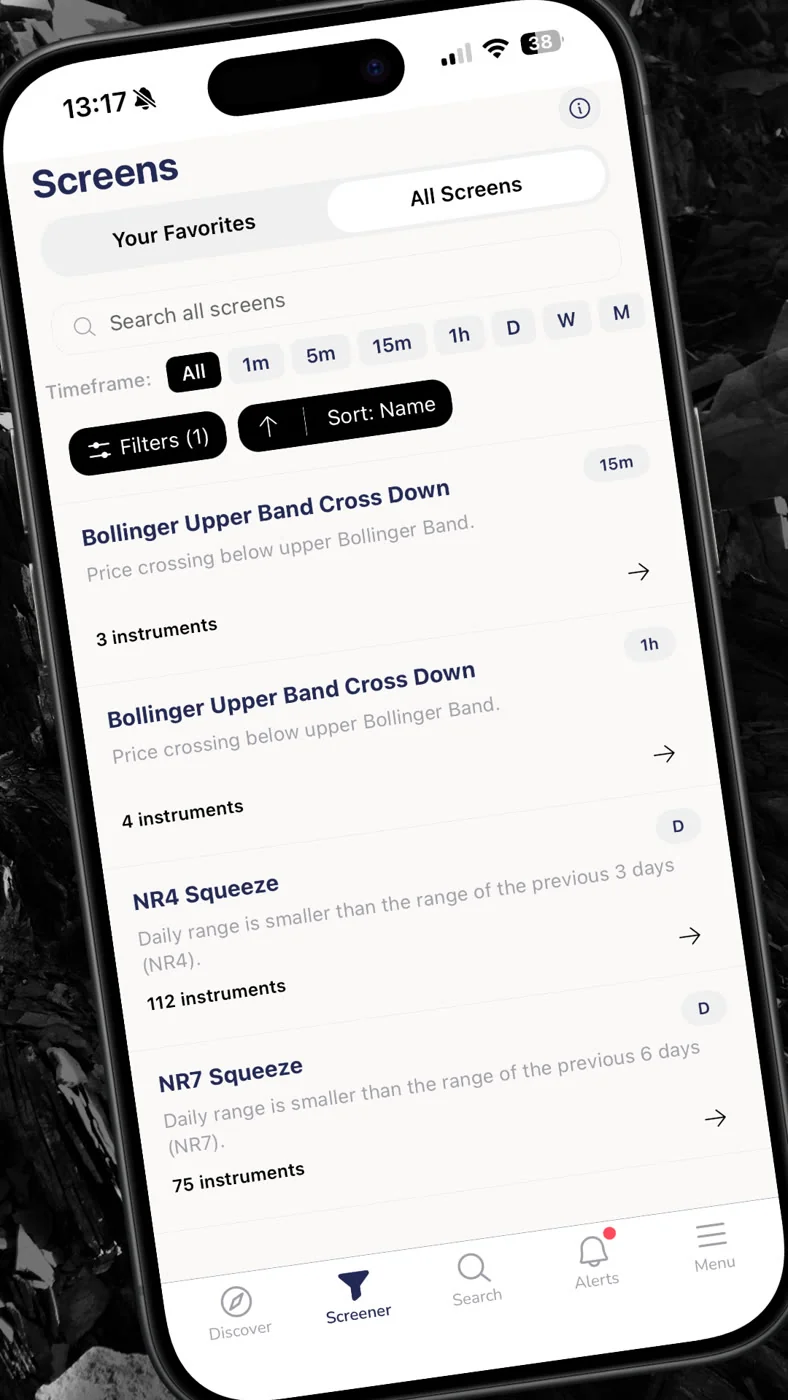
ChartMath starts from the other end of the problem. Instead of asking you to build a rule, it ships 200+ deterministic technical screens across a universe of actively traded NSE-listed equities, run across seven timeframes from 1-minute to monthly. Each screen is a fixed rule, momentum, reversal, breakout, or volume-based, and because it's fixed, its historical performance can be recomputed rather than taken on trust. Every screen carries its own Win Rate and Avg. Return over the trades it has matched, not a forecast, a documented backtested history.
When a stock you're watching enters one of these screens, ChartMath sends a push or email alert with a plain-English reason: which screen fired, why, and what its historical record looks like. You don't tune anything. You either trust the rule's track record or you don't, and you decide whether to act.
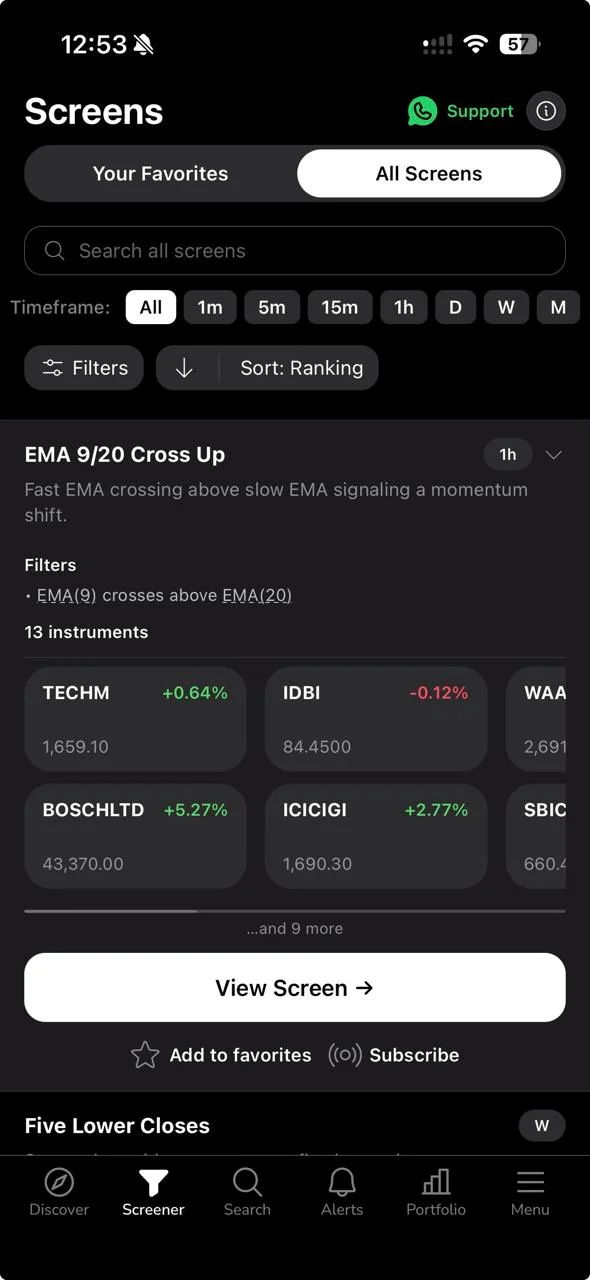
Three screens illustrate the range of what's already built: the MACD Bull Cross (Daily) screen for momentum turns, the Low Volatility Compression (Daily) screen for pre-breakout coiling, and the Above All MAs Bull (Daily) screen for trend-confirmation setups. None of these are rules you compose yourself, they're already there, already tested, and you can read each rule and its record on the screen pages before you ever open the app.
To be direct about the boundaries: this is educational content, not investment advice. ChartMath is not registered with SEBI as a Research Analyst or Investment Adviser, and nothing in these screens is a buy or sell call on any named stock. Past performance in a backtest does not indicate future results. You're reading a historical record of a rule, not a recommendation.
Honest Capability Comparison
| Capability | Streak | ChartMath |
|---|---|---|
| Compose a custom condition | Yes, condition builder with AND/OR logic | No, screens are fixed and read-only |
| Test an original hypothesis | Yes, this is the core use case | No, you select from existing tested rules |
| See a win rate without building anything | Only after you build and run a backtest | Yes, attached to every screen already |
| Time to first useful signal | Longer, requires design and iteration | Shorter, browse and subscribe to alerts |
| Coding required | No | No |
| Deploy exact custom rule to broker | Yes | No, copilot only, you place every trade manually |
| Best for a trader who | Has a specific idea and wants to prove it out | Wants tested setups without a build phase |
Decision Rules: Which Job Matches Your Evening
- You have a specific rule in your head no one else has tested: go build it in Streak. That's exactly the gap it fills.
- You want to know what's firing on NSE stocks tonight without building anything: open the app on India and check which of the 200+ screens matched your watchlist.
- You enjoy tweaking parameters and rerunning backtests as part of the craft: that iteration loop is Streak's whole design. ChartMath won't give you that loop because it has no builder.
- Your evening budget is 20-30 minutes, not a project: a tested screen with a recomputable track record gets you to a decision faster than designing one from scratch.
- You want the exact rule you designed to route orders to your broker automatically: that's Streak's execution path. ChartMath stays copilot, not autopilot, you tap to place every trade yourself.
If you're still deciding how a stock screener should fit your daily routine at all, our guide on how traders use trade discovery tools to find 10+ setups daily walks through the workflow question separately from the build-vs-pick question.
When Streak Is the Better Choice
This section deserves to be stated without hedging. Streak is the better choice when:
- You already have a concrete rule idea that combines conditions no pre-built screen covers, like a custom multi-indicator confluence unique to your reading of a sector.
- You want to combine several conditions into one rule and see the exact backtest for that exact combination, not an approximation from a nearby screen.
- You want the tested rule to place orders for you through a connected broker, closing the loop from idea to execution inside one platform.
- Iteration is part of how you trade. Some traders genuinely enjoy the design-test-refine cycle, and for them that process is inseparable from having conviction in a setup. ChartMath, with no strategy builder, doesn't offer that loop at all.
If any of those describe your relationship with the market, Streak is doing the right job for you, and no amount of pre-built screens replaces the value of testing your own idea.
When ChartMath Fits Better
The flip side is just as real. If you don't code, don't want to spend evenings designing rules, and would rather use your limited time deciding which of several already-tested setups to act on, ChartMath is built around exactly that constraint. You're not skipping a step because you're lazy, you're allocating your forty minutes to trade selection and risk sizing instead of rule construction.
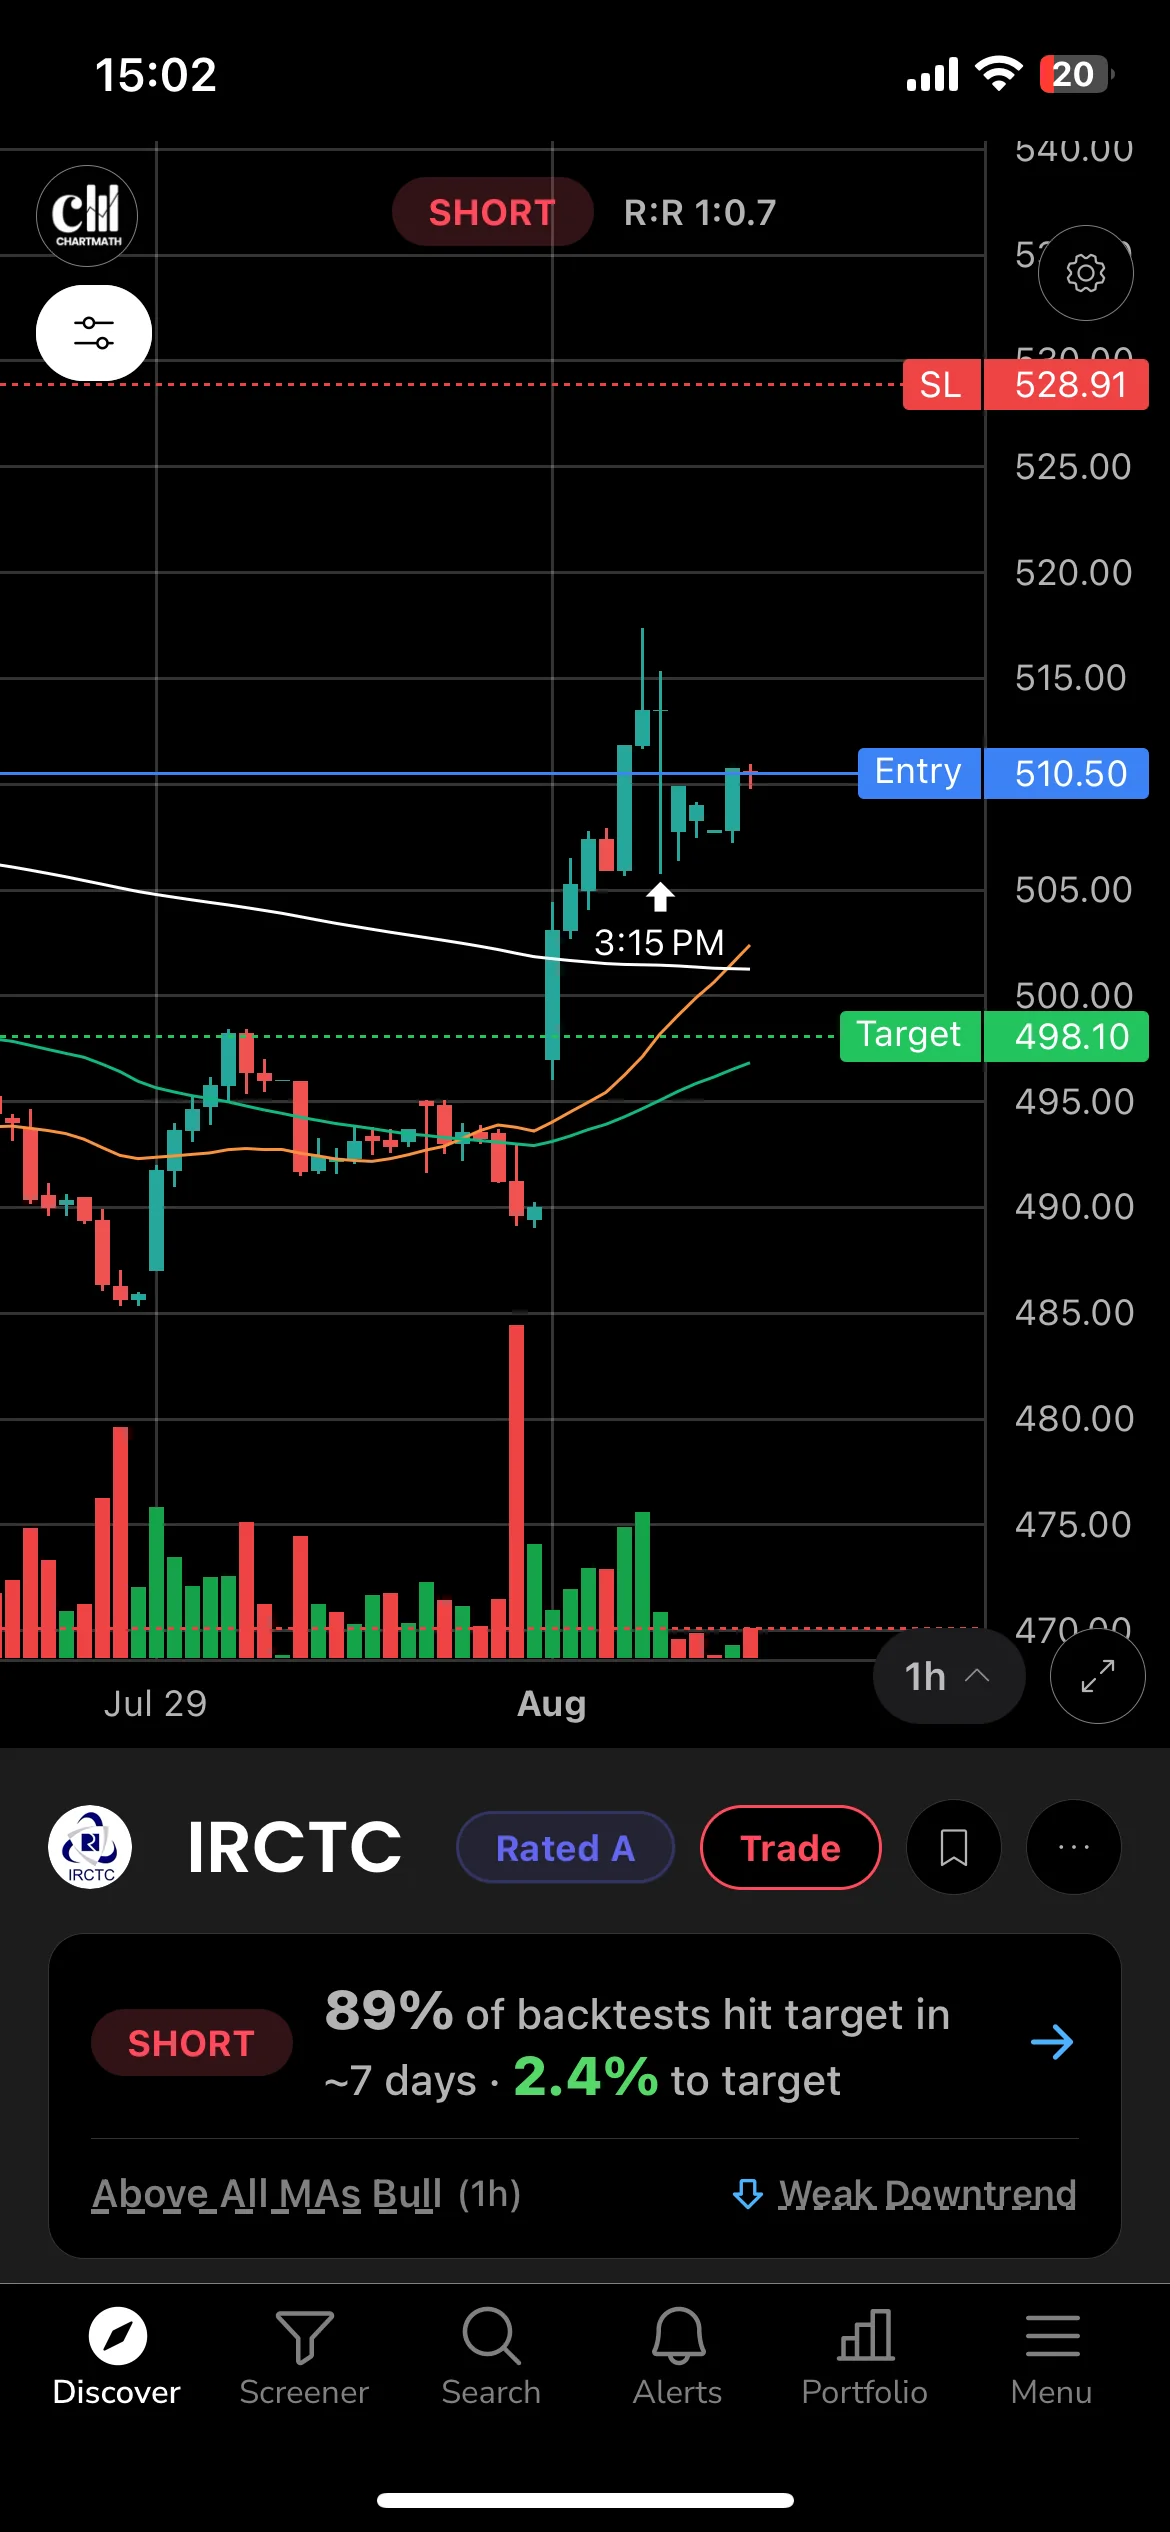
That's a legitimate trade-off for a salaried trader who reads indicators fine but has never written a backtest from scratch and doesn't want to start now. The screens are already there, the win rate and average return are already attached, and the alert tells you the moment one of your held or watched stocks matches. If that's closer to how you actually want to spend your evening, our piece on the best stock screener for NSE swing traders covers the selection criteria in more depth, and the no-code backtesting guide for Indian stocks explains what "recomputable, not taken on trust" actually means in practice.
Can You Use Both?
Plenty of traders don't pick one and abandon the other. A common pattern: run Streak for the one or two pet hypotheses you genuinely want to prove out over months, while using ChartMath as your daily discovery feed for everything else, the setups you haven't personally designed but still want tested evidence on before acting. They're not competing for the same forty minutes if you split the job that way. Our weekly trading review routine is a useful place to fold in whichever tool you're using without turning review night into another build session.
FAQ
Is ChartMath a Streak alternative if I don't want to code or build conditions?
Yes, in the specific sense that it removes the build step entirely. You're not composing rules, you're browsing 200+ already-tested screens across actively traded NSE-listed stocks and choosing which ones to follow. If building your own conditions is the part you want, ChartMath isn't a substitute for that, Streak still owns that job.
Does ChartMath place trades on my behalf in India?
No. ChartMath is a copilot, not an autopilot. It surfaces a setup with a plain-English reason and its backtested record; you decide whether to act and place the order yourself.
Is anything in this comparison investment advice?
No. This is educational content only. ChartMath is not registered with SEBI as a Research Analyst or Investment Adviser, and nothing here is a recommendation, a tip, or a buy or sell call on any named stock. Past backtested performance does not indicate future results.
Which NSE stocks does ChartMath cover?
actively traded NSE-listed equities, screened across seven timeframes. There's no F&O, no BSE, and no MCX coverage at this time.
If you've read this far and recognize your evening in the "browse tested setups, decide, act" version rather than the "design and iterate" version, you can download the app and start checking what's live on your watchlist tonight. Prefer to see it on a bigger screen first? Read a few screen pages before deciding. And if you're a builder at heart with a rule you're itching to test, that's a good reason to open Streak instead, this genuinely isn't a one-tool answer.
There is one methodological point worth stating plainly, because it is easy to get wrong and hard to see from outside. ChartMath tests a screen so that the future is never revealed to it: a signal from six months ago is evaluated on what was knowable then, not re-scored against where the stock ended up. That is a property of how the test is run rather than a feature you toggle, and it is what makes a stated record worth comparing at all.

See these setups live in ChartMath
200+ curated screens with backtest data. Free. No credit card required.