RSI Oversold on Indian Stocks: Bounce vs Falling Knife
RSI below 30 does not mean buy. It means momentum has slowed enough to count as oversold by one specific formula, and what happens next depends entirely on whether the stock is pausing inside an uptrend or sliding through a downtrend. That distinction is the whole game behind any real rsi strategy nse traders can use, and it is the piece the "buy under 30" slogan leaves out.
Key Takeaways
- RSI is a momentum reading, not a verdict: it measures the speed of recent price changes over 14 periods, it does not predict direction on its own.
- Trend regime changes the meaning: RSI near 28 inside an established uptrend is a pullback candidate; the same reading inside a downtrend is a stock that is simply going down.
- A bounce needs confirmation: a higher low, a reclaim of a short-term average, or a shift in volume, before you risk capital on "oversold."
- Falling knives stay oversold for weeks: RSI can sit under 30 through an entire downtrend leg, so "it's cheap now" is not a thesis.
- Test it, don't argue it: a deterministic, recomputable screen settles the uptrend-vs-downtrend question with a track record instead of an opinion.
RSI Oversold: Uptrend vs Downtrend At a Glance
| Factor | Oversold in an Uptrend | Oversold in a Downtrend |
|---|---|---|
| Price vs 50/200-day average | Above both, pulling back toward them | Below both, extending lower |
| What RSI under 30 usually reflects | A sharp pullback inside a larger up-move | Continued distribution, no bounce built in |
| Typical follow-through | Often stabilizes and resumes trend after confirmation | Can stay oversold for weeks (falling knife) |
| Confirmation needed before entry | Higher low or reclaim of short-term average | Base-building, not just an RSI reading |
| Risk if bought without confirmation | Moderate, trend structure still intact | High, no structure to lean on |
| How to settle the debate | Run a fixed, recomputable screen definition instead of eyeballing the chart | |
The Moment RSI Hits 28 and You Have to Decide
Say you've had a stock on your watchlist for three weeks. This morning it gaps down, RSI 14 prints 28, and your phone buzzes with a screener alert flagging it as oversold. You have to decide today, not after you've seen how the week plays out. Do you buy because the textbook says under 30 is oversold, or do you check something first?
This is the exact spot where "RSI below 30 = buy" falls apart as a rule you can actually trade. The number alone tells you nothing about whether this stock is a coiled spring or a stock that is simply falling and hasn't stopped yet. You need one more piece of information before you commit money: where is this reading happening, inside a rising trend or a falling one?
1. What RSI Actually Measures
The Relative Strength Index, developed by J. Welles Wilder and detailed on sites like Investopedia's RSI explainer, is a derived-from-price momentum oscillator. It compares the average size of recent up-moves to the average size of recent down-moves over a lookback period, usually 14 candles, and scales the result between 0 and 100.
A reading under 30 tells you one thing only: price has fallen faster and further, relative to its own recent history, than it usually does. It does not tell you why price fell, whether sellers are exhausted, or whether buyers are waiting below. RSI is derived from price, it reacts to what already happened. It is a speedometer, not a map of where the road goes next.
That's why traders who treat "oversold" as a standalone signal keep getting burned. The indicator is doing its job correctly, measuring momentum, but the job it's being asked to do, predicting a bounce, was never really its job in the first place.
2. Oversold in an Uptrend vs Oversold in a Downtrend
Picture two stocks on the same day, both showing RSI 14 at 28.
Stock A has been in a clean uptrend for four months, trading above its 50-day and 200-day moving averages. It just pulled back sharply on a broad market dip, RSI dropped to 28, but the higher-low structure from the last three months is still intact. This is a pullback inside a trend that was already working. Buyers who stepped in on prior dips in this same stock had a structural reason to expect the trend to resume: nothing about the longer-term picture broke.
Stock B has been making lower highs and lower lows for two months, trading below both its 50-day and 200-day averages. RSI also reads 28 today, but it read 27 last week, and 25 the week before that. This stock has been "oversold" for a month straight and every bounce has failed. Buying here on the RSI reading alone is not catching a pullback, it's catching a falling knife, a stock still in freefall with no structural reason to expect it to stop today rather than next week.
Same number. Completely different situation. The trend regime, not the RSI reading, is what should drive your read on which one you're looking at. This is precisely why a rule like "RSI under 30, buy" fails as a standalone strategy on NSE swing setups: it treats two different market conditions as if they were the same trade.
Why RSI Can Stay Oversold for Weeks
A common misunderstanding is thinking RSI under 30 has to resolve quickly. It doesn't. In a strong downtrend, RSI can hover in oversold territory for an extended stretch because the stock keeps making new lows on shrinking momentum, without ever mean-reverting. Traders who buy the first oversold reading in that kind of stock often average down two or three times before the position finally stabilizes, if it stabilizes at all.
3. Why a Bounce Needs Confirmation, Not Just a Number
If RSI alone can't tell you which stock is a real setup, what can? Confirmation. Before you act on an oversold reading, look for at least one of the following:
- A higher low forming: the stock stops making new lows and prints a candle that holds above the prior low.
- Reclaim of a short-term average: price closes back above a short moving average it had been trading under, a sign buyers stepped back in.
- A volume shift: down-days on shrinking volume followed by an up-day on expanding volume, suggesting selling pressure is fading.
- Trend context first: confirm price is still above its longer-term average (or was recently), rather than deep inside a multi-week downtrend.
None of these guarantee a bounce. What they do is shift the trade from "I saw a number under 30" to "I saw a number under 30, and price behavior afterward supports that sellers are losing control." That second version is a process. The first version is a guess dressed up as a rule.
This is also where the RSI Oversold Bounce setup for swing traders earns its name: bounce, not just oversold. The word "bounce" implies confirmation already happened, not that you're front-running it.
4. How to Test the Difference Instead of Arguing About It
Here's the honest problem with everything above: trend regime, higher lows, volume shifts, these are all judgment calls unless you define them precisely. Two traders can look at the same chart and disagree on whether a higher low has actually formed. That's not a flaw unique to RSI, it's a flaw in eyeballing any indicator without a fixed rule behind it.
The fix is a deterministic screen: a rule written out in plain terms, with exact conditions for trend regime, RSI threshold, and confirmation, that either triggers or doesn't. Because the rule is fixed, its historical record can be recomputed by anyone rather than taken on faith. That's the same principle a screen like no-code backtesting for Indian stocks is built around.
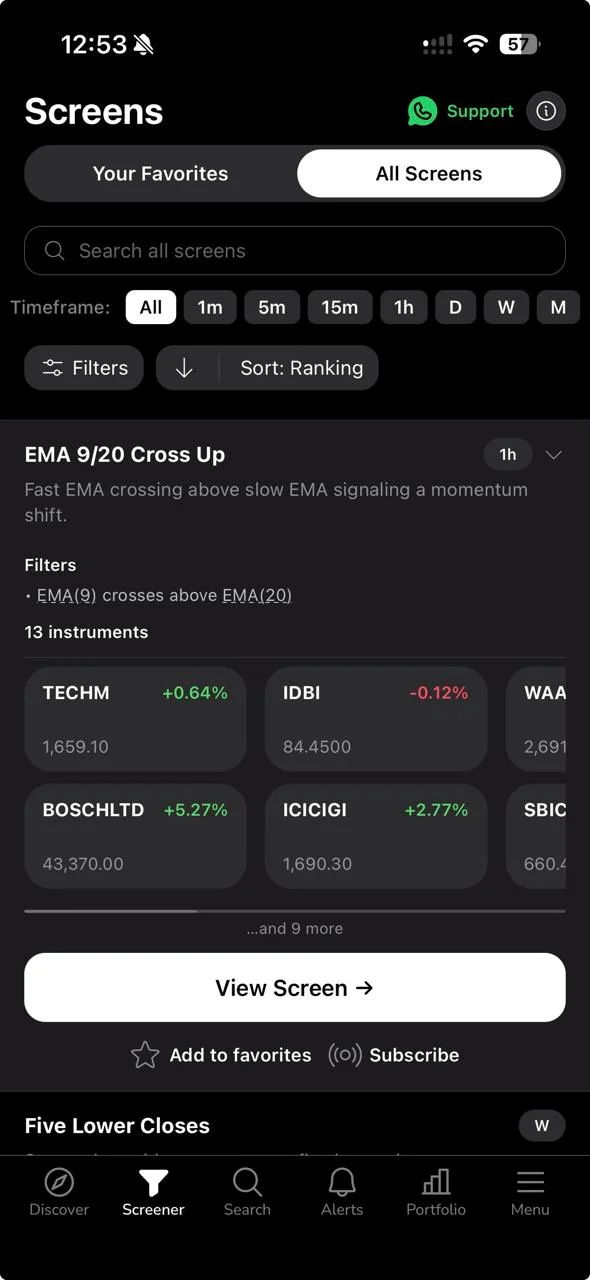
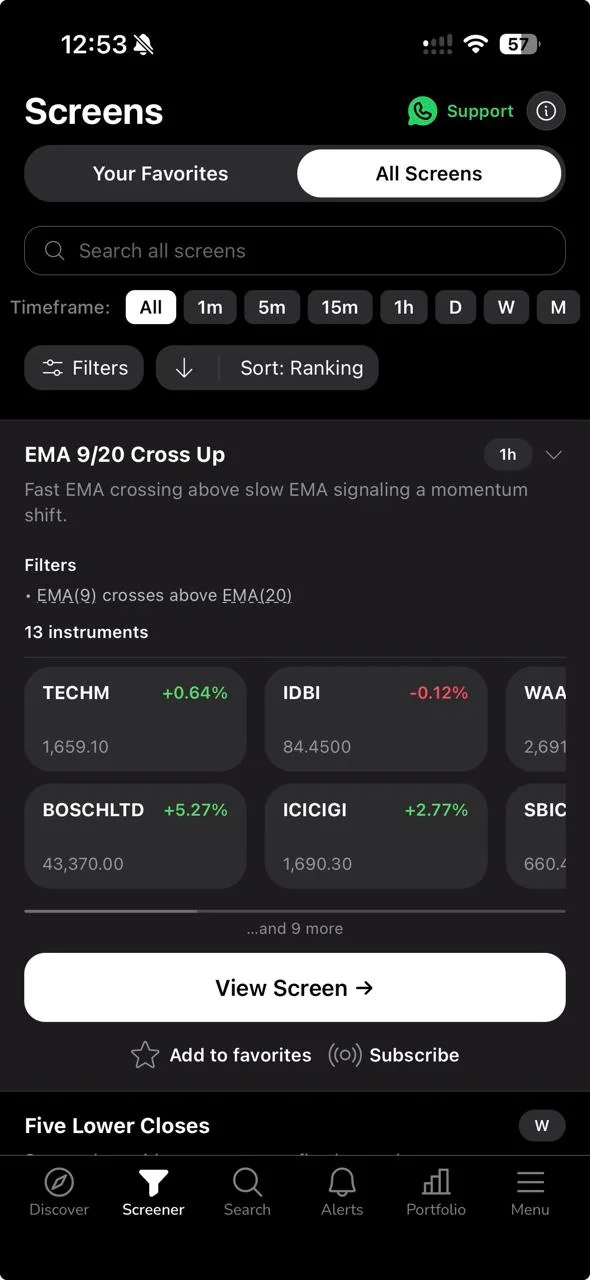
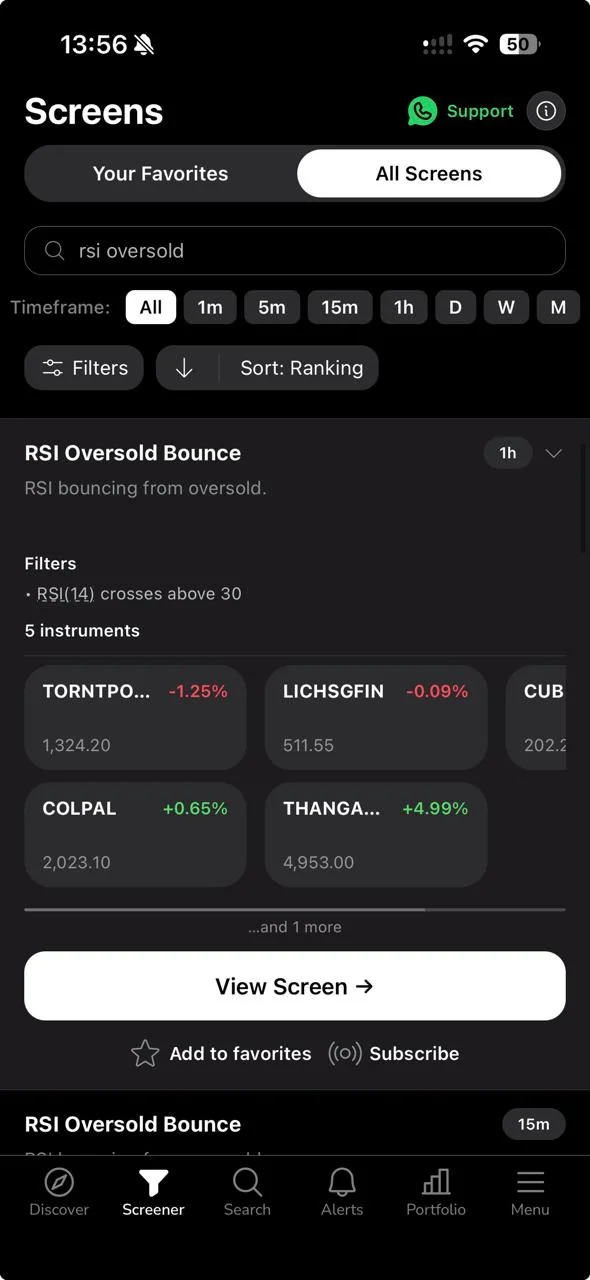
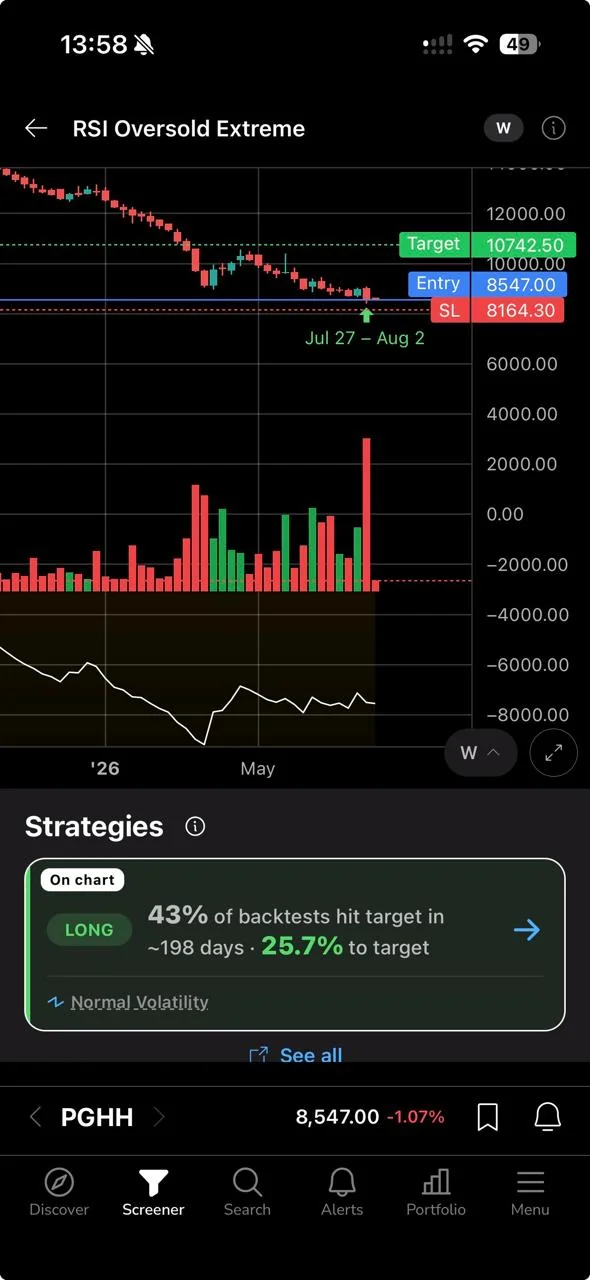
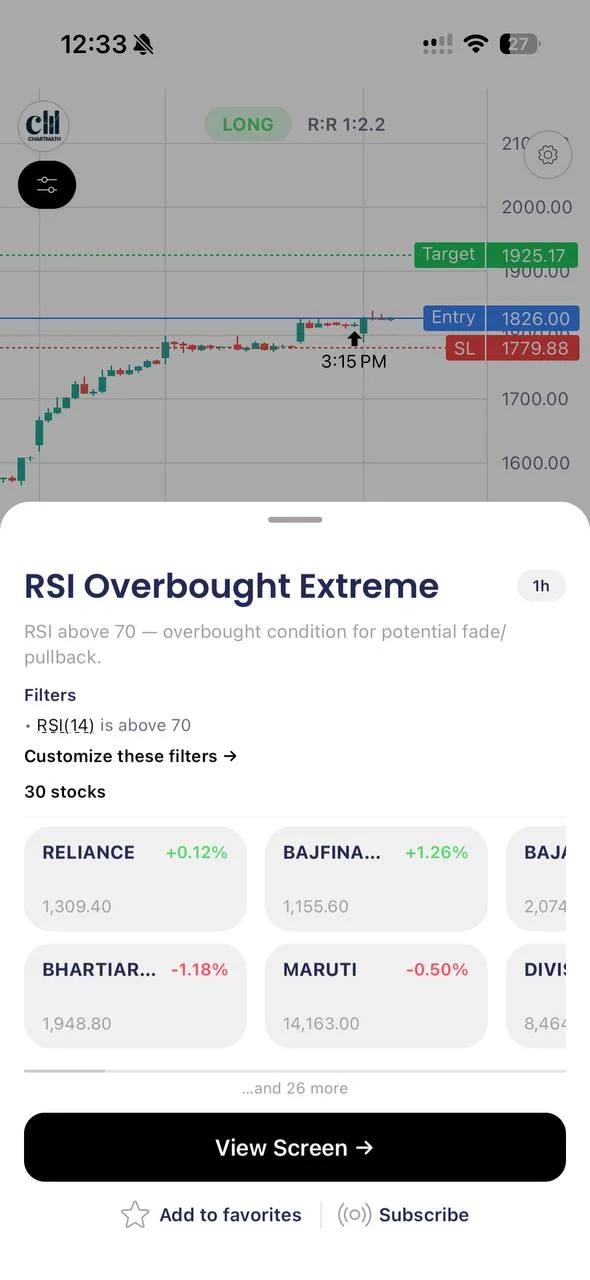
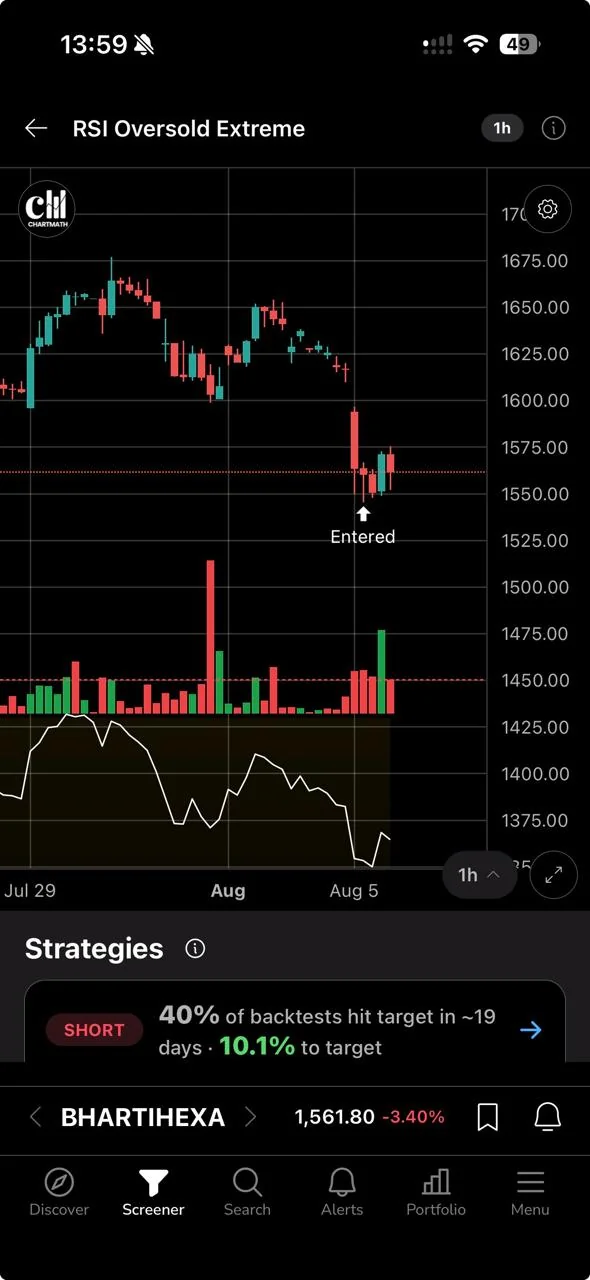
On ChartMath, three screens map directly onto this exact question. RSI Oversold Bounce and Capitulation Daily looks for RSI oversold readings that show signs of stabilizing rather than free-falling. RSI Oversold Extreme Daily flags the more severe, extended oversold condition, the kind more often seen in the downtrend scenario above. Three Lower Closes Daily is a simple, separate check for whether a stock is still actively making lower closes, useful as a quick falling-knife filter alongside an RSI reading.
To be clear on what a screen record actually shows: it's a Win Rate, an Average Return, and a sample size, computed against a fixed rule over historical data. As an illustrative example only, not a claim about any specific screen's current numbers, a screen record might show something like "62% win rate over 140 trades, average return 1.8%, holding period around 6 days." That is the kind of structure a backtested screen produces, an honest figure with a sample size attached, not a promise of what happens next. Every screen's actual current record can be recomputed and reviewed inside the app rather than taken on trust.
It's worth being fair here: ChartMath isn't the only place doing backtested screening on Indian stocks. Trendlyne ships backtestable screeners with a winners-to-losers ratio, and both TradingView and Streak let you build and test rules on NSE data too. The real difference across these tools is how the screen is defined, how transparent the plain-English logic is, and how easy it is to see the sample size behind a number rather than just a headline percentage. That's the comparison worth making before you trust any tool's "edge" claim, including this one.
5. Rules for Trading RSI Oversold on NSE Stocks
- Check the trend regime first. Is price above or below its 50-day and 200-day averages? That answer matters more than the RSI number itself.
- Wait for confirmation. A higher low, a reclaim, or a volume shift, before entry. Don't buy the first candle under 30.
- Size for the falling-knife case. If you're wrong about the regime, a downtrend oversold trade can keep falling. Size the position assuming that risk exists.
- Use a stop. Oversold is not a reason to skip risk management, it's a reason to be more careful with it.
- Check the screen's backtested record before assuming edge. Look at sample size and win rate for the specific rule you're using, not a general belief about RSI.
- Judge the rule, not the last chart. Before you trust an oversold bounce, look at how that specific screen has resolved across its whole sample, on the stop and target it was tested with, rather than on the one chart in front of you. See our guide on running a weekly trading review to track how these setups actually perform for you over time.
Common Mistakes with RSI Oversold Setups
- Buying the first red candle under RSI 30 without checking whether any confirmation exists yet.
- Ignoring the 200-day trend and treating every oversold reading the same regardless of the bigger picture.
- Averaging down into a falling knife, adding to a losing position because "it's even more oversold now."
- Treating RSI as a timing tool on its own, rather than pairing it with price structure and volume.
FAQ: RSI Oversold Strategy on NSE Stocks
Is RSI below 30 always a buy signal?
No. RSI below 30 flags reduced momentum relative to recent history. Whether it's a buyable pullback or a falling knife depends on the broader trend, which is why confirmation and trend context matter more than the raw number.
What RSI period works best for NSE swing trading?
RSI 14 on the daily chart is the standard starting point for swing trades that hold several days to a few weeks. Some traders test shorter periods for faster signals, but shorter periods also produce more false oversold readings.
Can RSI oversold work in a downtrend?
It can, but it needs stronger confirmation, since the base rate of a genuine reversal is lower in a downtrend than in a pullback within an uptrend. Waiting for a clear higher low or reclaim reduces the odds of buying too early.
Is this investment advice?
No. This article is educational content about how a technical indicator works and how to test setups systematically. It is not a recommendation to buy or sell any specific stock.
Recap and Next Step
RSI below 30 is a momentum reading, not a verdict. The same number means a pullback worth watching inside an uptrend, and a stock still falling with no structural support inside a downtrend. Confirmation, a higher low, a reclaim, a volume shift, is what separates the two, and a deterministic, recomputable screen is how you test that distinction instead of arguing about it after the fact.
If you want to see how this plays out on real setups rather than a hypothetical, open the RSI Oversold Bounce and Capitulation, RSI Oversold Extreme and Three Lower Closes screen pages and read the rule and record on each. Those pages run the US universe; for NSE names, switch the market to India inside the app. You can also watch a quick demo to see how a screen's plain-English rule and its recomputable record actually show up in the app. When you're ready to rehearse the setup yourself with a stop and target pre-filled, download the ChartMath app, it's free, with no credit card required, on iOS and Android. Related reading: why a high win rate alone doesn't equal profitable trading and how a scan-plus-win-rate approach compares to Chartink.
Educational use only. Not a broker/dealer or investment adviser and not registered with SEBI. Past performance does not indicate future results.

See these setups live in ChartMath
200+ curated screens with backtest data. Free. No credit card required.