Does the Golden Cross Actually Work on NSE Stocks?
A golden cross does not tell you a stock will go up. It tells you the 50-day moving average has crossed above the 200-day moving average, nothing more, and whether that pattern has actually made money on NSE stocks depends entirely on which stocks, which years, and which exit rule you test it with. The honest way to answer the golden cross strategy India question is to fix a rule, run it across a large, named universe, and read the win rate next to the average return, not just believe the chart someone forwarded you.
Key Takeaways
- The pattern is real, the claim usually isn't: A 50 DMA crossing above a 200 DMA is a well-defined, testable event. What's missing from most Indian trading content is the test itself.
- Universe changes the answer: The same rule run on Nifty 50 large caps and on small-cap NSE names can produce very different win rates and holding periods.
- One chart is not a sample: A single golden cross that worked on a stock you own proves nothing. You need dozens, ideally hundreds, of instances to say anything with confidence.
- Win rate alone is misleading: A high win rate with a tiny average return can still lose money after slippage. Read both numbers together.
- Test it yourself before trusting anyone's number: Fix the exact rule, define your universe, choose an exit ahead of time, and check the result on your own watchlist.
Golden Cross Strategy India: At a Glance
| Element | What to define before you test |
|---|---|
| Rule definition | 50-day SMA (or EMA) crosses above 200-day SMA (or EMA), stated exactly |
| Entry timing | End of the day the cross confirms, or next day's open |
| Universe | A named, fixed list: e.g. Nifty 50, Nifty 500, or your own watchlist |
| Exit rule | Fixed stop and target, or a time-based exit (e.g. 20 or 60 trading days) |
| Minimum sample size | At least 30-50 instances before drawing any conclusion |
| Metrics to read together | Win rate and average return, not either one alone |
| Common variation risk | SMA vs EMA, and day-count changes can shift results meaningfully |
| Regulatory note | Educational use only; not investment advice |

The Moment Nobody Talks About
You're scrolling in the evening and a stock you already own shows up in a Telegram forward: 50 DMA just crossed above the 200 DMA, golden cross confirmed, bullish signal. You open the chart yourself. Yes, the lines have crossed. But you have no idea what happens next, not for this stock, not on the NSE broadly, not with any real number attached. The person who sent it doesn't either. Nobody attached a win rate, a sample size, or even the time period they checked.
This is the gap in almost every piece of golden cross content aimed at Indian retail traders. The setup gets repeated in YouTube shorts, screener alerts, and WhatsApp groups as if repetition itself were proof. It isn't. A pattern can be real, well-documented in technical analysis literature, and still be mediocre, sector-dependent, or too rare on a single stock to build a trading routine around. The only way to know which is true is to test it, on a defined universe, with a defined exit, and enough instances to matter.
1. What the Golden Cross Rule Actually Is
Strip away the mystique and the golden cross is a moving average crossover: the 50-day average of closing price moves above the 200-day average. Some versions use the simple moving average (SMA), others use the exponential moving average (EMA), which weights recent prices more heavily and crosses sooner. Some traders also require the 200-day average to be sloping upward at the time of the cross, treating a flat or falling 200 DMA as a weaker signal.
None of these variations are wrong. They are different rules that happen to share a name, and each one needs its own test. If someone tells you "the golden cross has a good win rate," the first question worth asking is: which exact version, on which stocks, over what period? Without that, the claim is not really a claim, it is a slogan.
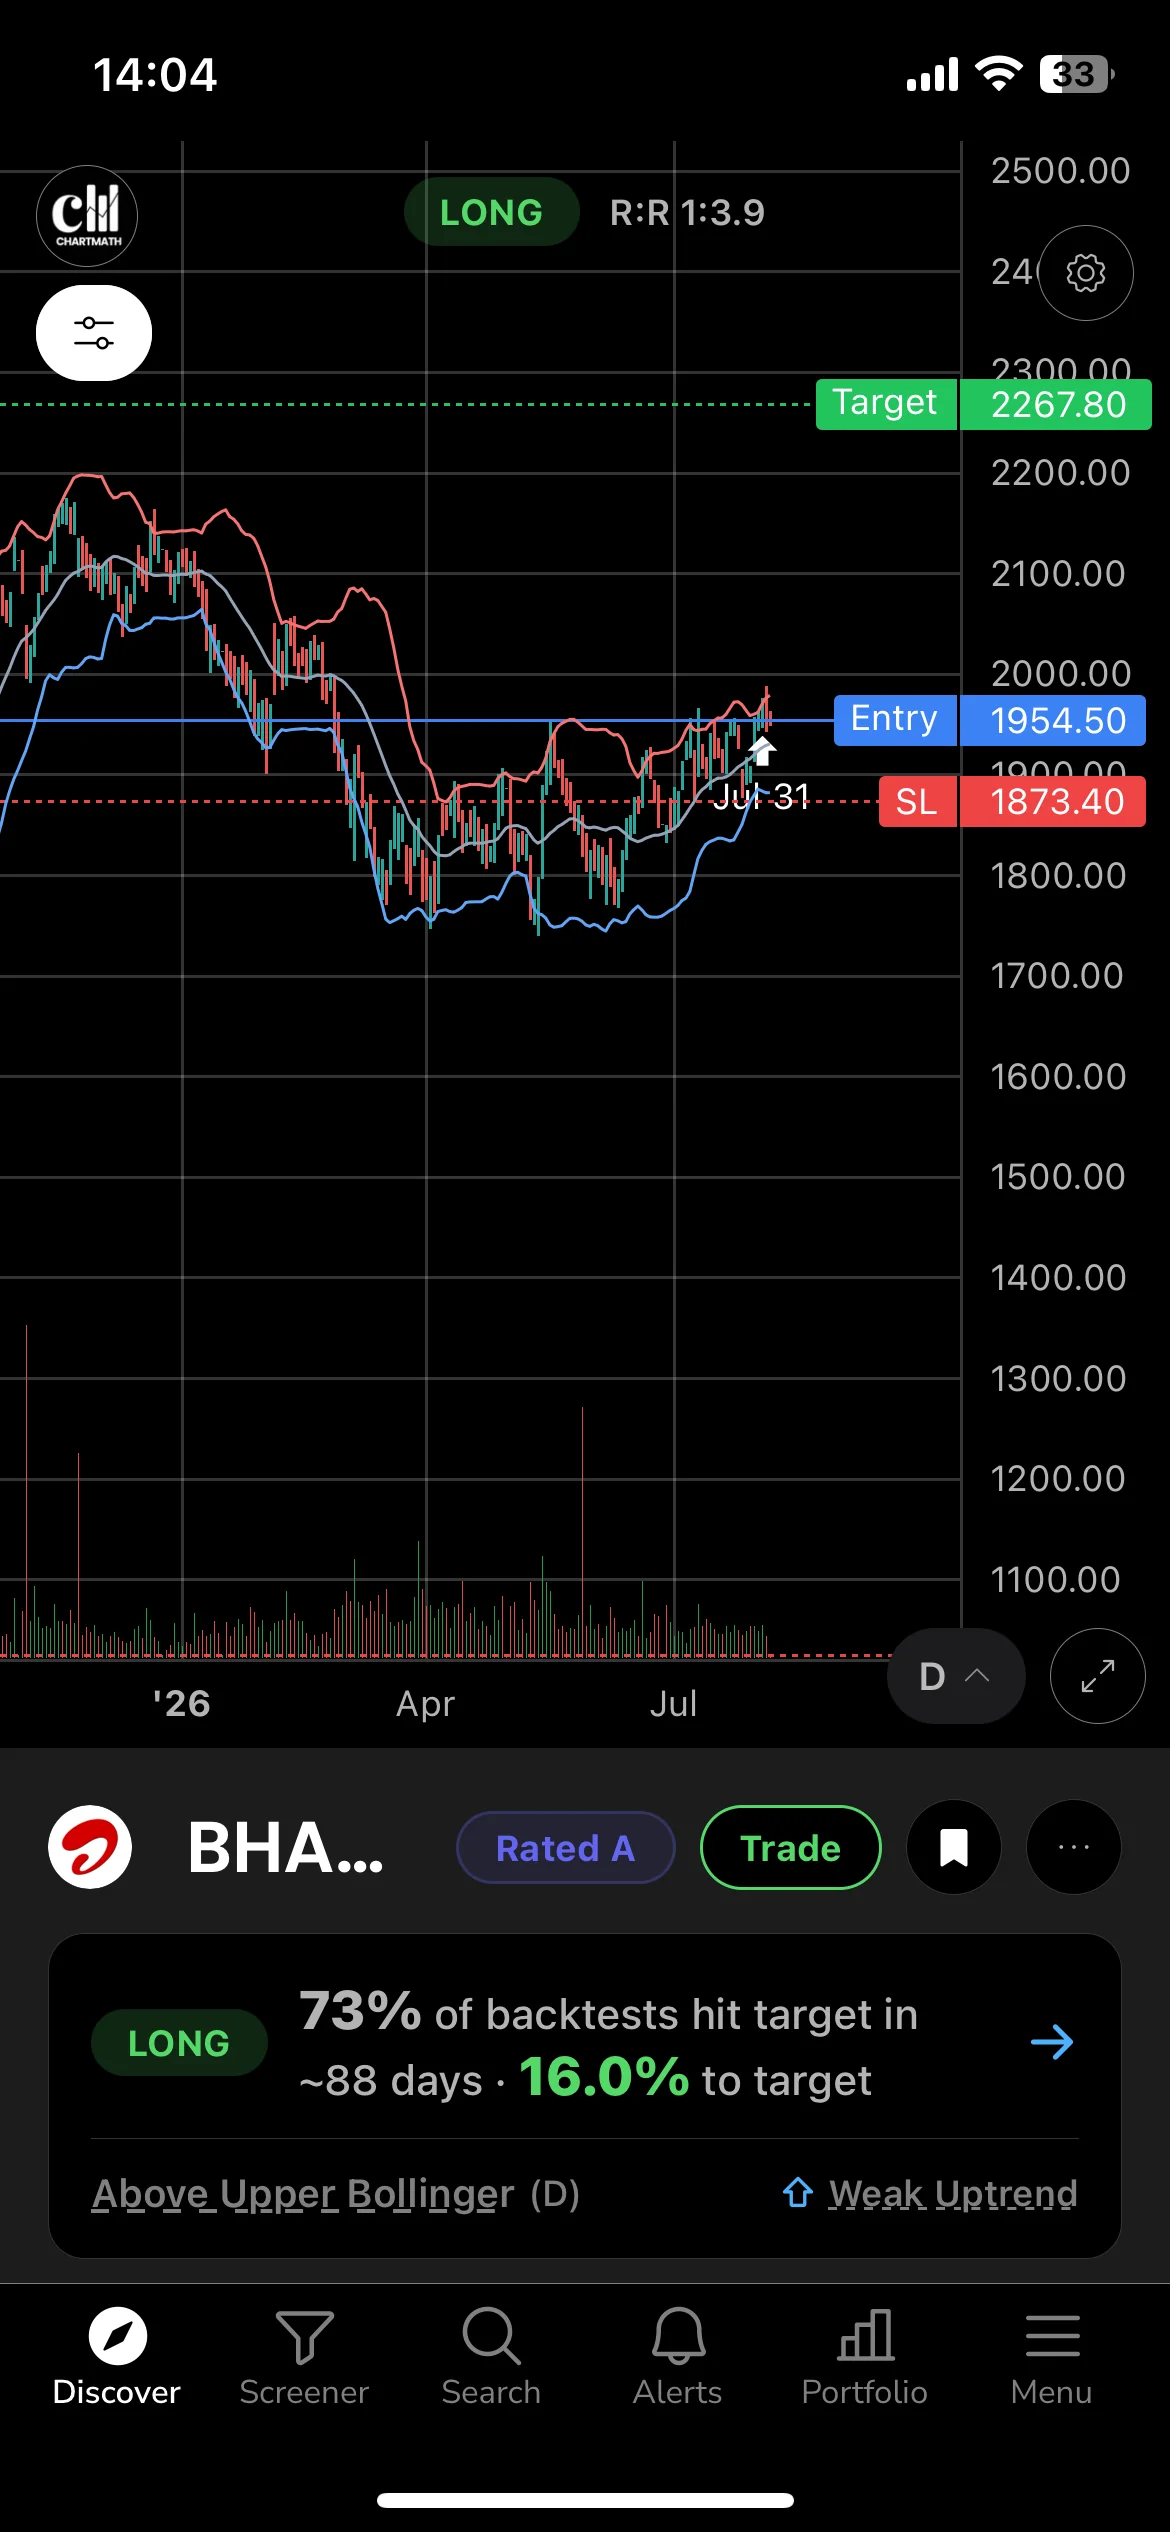
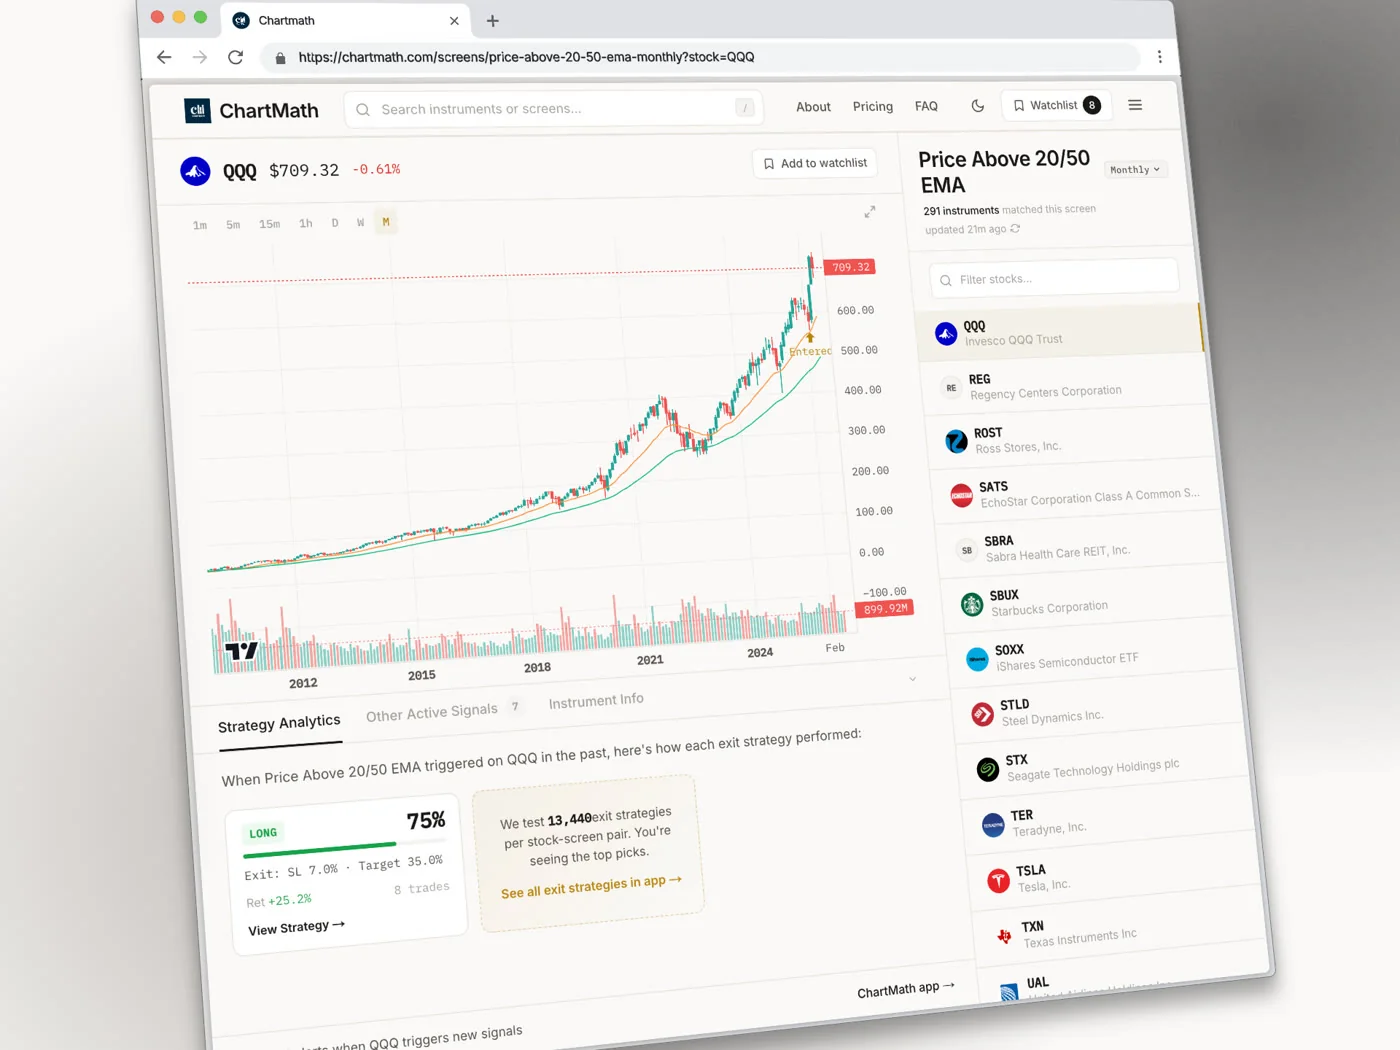
ChartMath's Golden Cross Daily screen states its entry condition in plain English, so you can read the exact rule rather than guess at it from a forwarded screenshot. That page shows the rule and its record on the US universe; for NSE names, switch the market to India inside the app.
2. Why the Answer Depends on the Universe and Holding Period You Test
Run the golden cross on Nifty 50 constituents over the last five years and you get one picture. Run the identical rule on Nifty Smallcap 250 names and you get a different one, because small caps move in sharper, choppier swings and often trend less smoothly through a 200-day average. Neither result is "the" answer for the golden cross in India. Both are answers for a specific, named universe. Holding period changes the picture just as much. Exit after 10 trading days and you're measuring short-term follow-through. Exit after 60 trading days and you're measuring whether the trend that triggered the cross actually continued. Hold with no exit rule at all and you're measuring something closer to buy-and-hold performance dressed up as a signal. These are three different tests, not one test described three ways.
NSE-specific mechanics matter here too. Circuit limits on smaller names can delay how a cross plays out intraday. Sector concentration in the index means a golden cross cluster across banking names, for instance, isn't five independent signals, it's one macro move showing up five times. None of this makes the golden cross useless. It means the honest answer is always: "on this universe, over this period, with this exit, here is what happened," never a flat "it works" or "it doesn't."
3. How to Test the Golden Cross Properly on Your Own Watchlist
Here is a workable process, in order:
- Fix the rule first. Decide SMA or EMA, 50/200 exactly or a variant, and whether you require a rising 200-day average. Write it down before you look at any results, so you aren't tempted to adjust the rule after seeing what "worked."
- Define your universe. Use your actual watchlist, or a named index like Nifty 500, not "stocks I remember doing well."
- Choose your exit before you enter, not after. A fixed stop and target, or a fixed holding period, decided in advance.
- Run it across a large sample. Aim for at least 30-50 instances of the cross across your universe and time period. Five examples, even five good ones, is a highlight reel, not a track record.
- Record win rate and average return together. A screen that wins 70% of the time with a 0.3% average gain can lose to trading costs. A screen that wins 45% of the time with a 3% average gain on winners can still be strongly profitable. Neither number alone tells you the story.

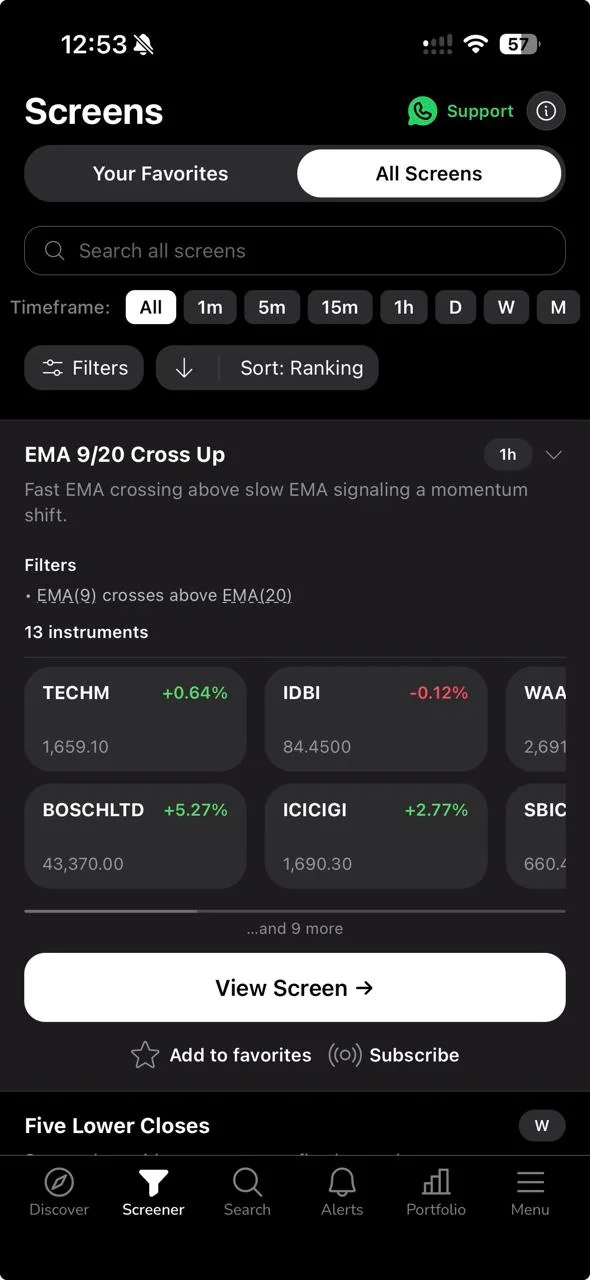
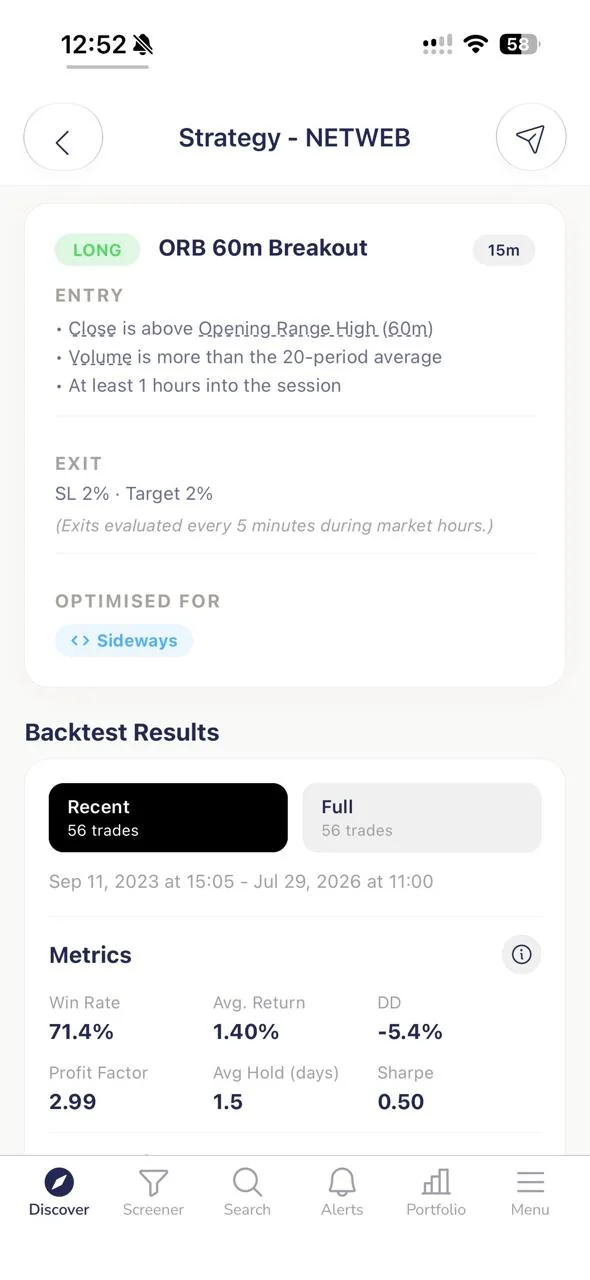
This is exactly the kind of question a fixed, stated screen is built to answer, because the rule can be recomputed rather than taken on trust. ChartMath's Golden Cross Daily screen runs this exact crossover condition and shows the matched instruments alongside the screen's backtested record, and the Above All MAs Bull screen extends the idea by requiring price to hold above multiple moving averages rather than just crossing one. Whatever number you see on any screen, in this app or anywhere else, treat it as illustrative until you've checked the sample size and time period behind it. Do not take any single figure as a forecast or a guarantee; past performance does not indicate future results.
If you're newer to this kind of testing, backtesting trading strategies on Indian stocks without writing code walks through the mechanics in more depth, and choosing a stock screener built for NSE swing trading covers what to look for in the tool itself.
4. How to Read the Result Without Fooling Yourself
Two numbers matter and they need to be read side by side. Win rate tells you how often the setup resolved in your favor. Average return tells you how much you made or lost, on average, each time. A screen can look great on one metric and mediocre on the other. Consider a golden cross that wins 65% of the time but the average winning trade returns 0.8% while the average losing trade costs 2.5%. That combination can lose money over time once brokerage and slippage are added in, even though "65% win rate" sounds strong on its own. The reverse is also true: a lower win rate paired with winners that are meaningfully larger than losers can be a solidly profitable setup. Sample size is the other filter. Eight instances over three years, even if six of them worked, tells you almost nothing statistically. You want dozens of instances at minimum before treating a result as informative rather than lucky. And it helps to compare the result against a simple baseline, buying at a random point and holding for the same period, so you can tell whether the golden cross is actually adding anything or just riding a general uptrend in the market.
For more on why a strong-looking win rate can still be a losing strategy, see why high win rate doesn't equal profitable trading.
5. When the Golden Cross Fails (And Why That's Useful to Know)
Be willing to say plainly: the golden cross is not consistently strong everywhere, and knowing where it struggles is more useful than pretending it never does. In sideways or choppy markets, the 50 DMA and 200 DMA can cross back and forth repeatedly, generating whipsaw signals that lose small amounts again and again. Because it's a lagging indicator built on 200 days of price, the cross often confirms well after a move has already started, so the "signal" arrives late relative to the actual trend change. On an individual stock, golden crosses can also simply be rare. If a name only produces two or three crosses in five years, that's too small a sample to build a routine around, no matter how good those two or three looked. And the setup performs differently across sectors and market cap on the NSE: what looks reliable in large-cap banking names may not transfer to mid-cap pharma or small-cap industrials. Reporting a mediocre result honestly, when that's what the data shows, is worth more than a polished chart with three cherry-picked wins.
A signal can be genuine and still be too infrequent, too lagging, or too inconsistent across sectors to anchor a trading routine on. The job isn't to declare it good or bad. It's to know exactly where it holds up and where it doesn't.
The RSI oversold bounce setup is a useful contrast: a mean-reversion signal with its own failure modes, worth testing the same way rather than trusting on faith either.
6. Recap: Treat the Golden Cross as a Question, Not an Answer
The golden cross is a legitimate, well-known pattern. It is not automatically a profitable strategy, and no one, including this article, should hand you a single win rate and ask you to trade on it. The right posture is to fix the exact rule, name your universe, pick your exit in advance, run it across enough instances to matter, and read win rate and average return together before deciding anything. ChartMath's Consistent Uptrend Daily screen is another example worth studying alongside the golden cross screens, since it states a different, stricter trend-following rule and lets you compare how each performs on the same NSE universe rather than judging either from a single chart.
Educational use only. ChartMath is not a broker/dealer or investment adviser and is not registered with SEBI. Nothing here is a recommendation to buy or sell any security, and past performance does not indicate future results.
FAQ
Is the golden cross reliable on Indian stocks?
It depends on the universe, holding period, and exit rule tested. It is not uniformly reliable or unreliable across all NSE stocks, which is exactly why it needs testing rather than assumption.
What timeframe works best for a golden cross on NSE?
The classic golden cross uses daily closing prices for the 50 and 200-day averages. Some traders test it on weekly charts for a slower, less frequent signal, trading fewer but potentially more significant crosses.
Does the golden cross work better on Nifty 50 or small caps?
They are different tests with different answers. Large caps tend to trend more smoothly, which can suit a lagging signal like this one; small caps are choppier and may produce more false crosses. Test each separately rather than assuming one result applies to both.
How many trades are enough to trust a backtest?
Most practitioners look for at least 30-50 instances before treating a result as meaningful. Fewer than that, and you're likely looking at noise rather than an edge.
If you want to check the golden cross, or any other moving average rule, against your own NSE watchlist instead of taking someone else's word for it, read the fixed rule and its backtested record on the Golden Cross Daily screen page, then open the app and switch the market to India to run it on NSE names and get pushed the moment a setup like this actually forms on a stock you follow. It's free, no credit card required, and it stays a copilot: you review the reasoning and decide, nothing places a trade for you.
One detail worth checking in any backtest you are shown, ours included: does the test ever see the future? A rule tested on data that was only knowable later will look far better than it was. ChartMath runs its screens so that a past signal is judged only on what was available at that moment, which is why a match from last month does not quietly change value once later candles arrive. It is the difference between a record and a re-drawing.

See these setups live in ChartMath
200+ curated screens with backtest data. Free. No credit card required.