Opening Range Breakout Stocks to Watch Premarket: How Scanners Do the Work

Most traders who trade the opening range breakout lose the game before the market even opens. Not because their strategy is wrong. Because they walk into 9:30 AM with a watchlist built from whatever was trending on Reddit at midnight, a CNBC headline they half-read, or a gut feeling about a ticker they've been watching for weeks. That's not a watchlist. That's a wish list.
The traders who consistently find strong opening range breakout stocks to watch premarket aren't smarter or faster. They have a systematic filter running before the open that does the heavy lifting for them. This guide walks through exactly what that filter looks like, which signals matter most, and how an automated scanner can deliver a ready-to-trade shortlist to your phone before 9:30 AM without you manually refreshing a single screener.
Why Your Premarket Watchlist Determines Your ORB Results
The opening range breakout is a timing strategy. You're betting that the high or low established in the first 5, 15, or 30 minutes of trading will act as a meaningful level, and that a breakout above or below it will follow through. The setup itself is well-documented and widely traded. The edge isn't in knowing the pattern. It's in applying it to the right stocks on the right days.
A stock with thin premarket volume, no gap, and a messy daily chart can technically form an opening range. It can also technically break out of it. But the probability of that breakout following through is much lower than a stock that gapped up 3% on 4x relative volume, has a clean base on the daily chart, and is showing relative strength against its sector. Same pattern. Very different odds.
That's why premarket preparation is where ORB traders actually compete. The traders who arrive at 9:30 AM with 3 to 5 high-conviction names, each pre-screened for gap size, RVOL, and daily chart structure, are playing a different game than the trader who opens their screener at 9:28 AM and starts scrolling.
The problem is that building that shortlist manually takes time most traders don't have. Checking 50 tickers for gap percentage, pulling up each daily chart, cross-referencing relative volume against a 20-day average — that's 45 minutes of work on a good morning. An automated scanner compresses that to a glance at your phone. Here's how to build that system.
What Makes a Stock a Strong ORB Candidate Premarket
Before you can automate the filter, you need to know what you're filtering for. Four signals consistently separate high-probability ORB candidates from the noise. They work as a compound filter: the more boxes a stock checks, the stronger the candidate.
Gap Size
A meaningful gap signals that something changed overnight. Earnings, news, a sector catalyst, or simply a stock breaking out of a multi-week base on the prior session's close. The gap creates a natural reference point for the opening range and tends to attract volume at the open. Gaps that are too small (under 1%) often fade into noise. Gaps that are too large (over 10-15%) can be too extended to trade cleanly. The sweet spot for most ORB setups sits in the 2-6% range, where there's enough momentum to follow through but enough room to manage risk.
Relative Volume (RVOL)
Premarket RVOL is one of the most reliable conviction signals available before the open. It compares the current premarket volume to the average premarket volume for the same time window over the prior 20 days. A stock trading at 3x or 4x its normal premarket volume is telling you that institutional and retail participants are paying attention. That attention tends to carry into the regular session and fuel the opening range breakout. Understanding how RVOL works in practice is one of the most useful skills an ORB trader can develop.
Daily Chart Structure
The best ORB setups don't happen in a vacuum. They happen in stocks that are already in a technically constructive position on the daily chart: a multi-week base, a prior breakout level acting as support, or proximity to a 52-week high. A stock gapping up into clean air above a well-formed base is a very different trade than a stock gapping up into a wall of overhead resistance. The daily chart is your context layer.
Relative Strength vs. the Market
A stock that's gapping up while the broader market (SPY) is flat or down is showing genuine relative strength. That's a signal that the move is stock-specific, not just a rising-tide effect. Relative strength premarket is a quality filter that removes a lot of false positives from your watchlist.
The 4 Premarket Signals That Filter ORB Candidates
Put those four signals together and you have a compound filter that looks like this:
- Gap percentage: 2-6% gap up (or down for short setups), indicating meaningful overnight momentum
- Premarket RVOL: 2x or higher vs. the 20-day premarket average, confirming participation
- Daily chart structure: clean base, near a key level, not extended into resistance
- Relative strength: outperforming SPY or its sector in premarket trading
A stock that passes all four is a genuine ORB candidate. A stock that passes two or three is worth watching but with lower conviction. A stock that passes one is probably noise. The filter isn't about finding more stocks. It's about finding fewer, better ones.
The challenge is applying this filter across hundreds of tickers every morning before 9:30 AM. That's where automated scanning changes the equation entirely. Instead of manually checking each signal, a scanner with pre-built ORB screens does the filtering for you and surfaces only the names that pass. Premarket scanning strategies that combine these signals are what separate systematic traders from reactive ones.
1. Set Up Your ORB Screen the Night Before
The best premarket preparation actually starts the evening before. After the market closes, you have access to the full day's data: which stocks showed unusual volume, which ones closed near key technical levels, which ones are setting up for a potential gap the next morning.
Running an ORB-focused screen on the prior session's data gives you a preliminary watchlist of candidates to monitor premarket. You're looking for stocks that closed near resistance, showed elevated volume on the day, or broke out of a multi-week base. These are the names most likely to gap and follow through the next morning.
This evening prep step takes 10-15 minutes and dramatically reduces the cognitive load of the morning session. Instead of starting from scratch at 8:30 AM, you're confirming or eliminating names you already identified. Building a repeatable trading workflow around this evening-to-morning rhythm is one of the highest-leverage habits an ORB trader can develop.
Set alerts on your top 3-5 candidates from the evening screen. If one of them gaps up with strong RVOL the next morning, you want to know immediately, not when you happen to check your phone at 9:15 AM.
2. Check Premarket RVOL and Gap Size at 8:30–9:00 AM
The 8:30 to 9:00 AM window is the most information-dense 30 minutes of the premarket session. Economic data releases hit at 8:30 AM. Institutional pre-positioning accelerates. The stocks that are going to have meaningful opening ranges start to reveal themselves through their volume and price action.
At this point, you're running two quick checks on your evening watchlist candidates:
- Is the gap holding or expanding? A gap that's growing from 8:30 to 9:00 AM on increasing volume is a stronger signal than one that's fading. Fading gaps often produce failed ORB setups.
- Is premarket RVOL confirming? If a stock is gapping 3% but trading at only 0.8x its normal premarket volume, the participation isn't there. Wait for the volume to confirm before adding it to your final shortlist.
Doing this manually means pulling up each ticker individually, checking the premarket chart, and calculating RVOL by hand or from memory. A scanner with real-time ORB screens does this automatically. It's already filtered for gap size and RVOL thresholds. The names that appear on your screen at 8:45 AM have already passed the filter. You're reviewing, not searching.
This is the core workflow difference between traders who spend 45 minutes scrambling premarket and traders who spend 10 minutes confirming. The scanner handles the search. You handle the judgment call. That's the right division of labor. For traders who want to understand how this fits into a broader intraday approach, comparing VWAP, RVOL, and ORB signals is a useful next step.
3. Confirm Daily Chart Structure Before the Open
Once your scanner has surfaced the premarket candidates, the daily chart is your final quality check. This step takes 2 minutes per name and answers one question: is this stock in a technically constructive position, or is it gapping into a mess?
What you're looking for on the daily chart:
- Prior base: Has the stock been consolidating for at least 2-3 weeks? A tight base before a gap-up is a much stronger setup than a stock that's been in a straight-line run for 6 weeks.
- Key level proximity: Is the stock gapping up near a prior resistance level that could now act as support? Or is it gapping into a zone of heavy overhead supply?
- 52-week high proximity: Stocks gapping toward or above their 52-week high often attract momentum buyers at the open. 52-week high breakout setups pair naturally with ORB strategies.
- Multi-timeframe alignment: Does the 1-hour chart confirm the daily setup? A stock that looks constructive on the daily but is showing a downtrend on the 1-hour is a lower-conviction trade.
This daily chart check is the step most traders skip when they're in a hurry. It's also the step that eliminates the most false positives. A stock can have a great gap and strong RVOL and still be a poor ORB candidate if the daily chart structure is weak. Two minutes per name is all it takes to make this call.
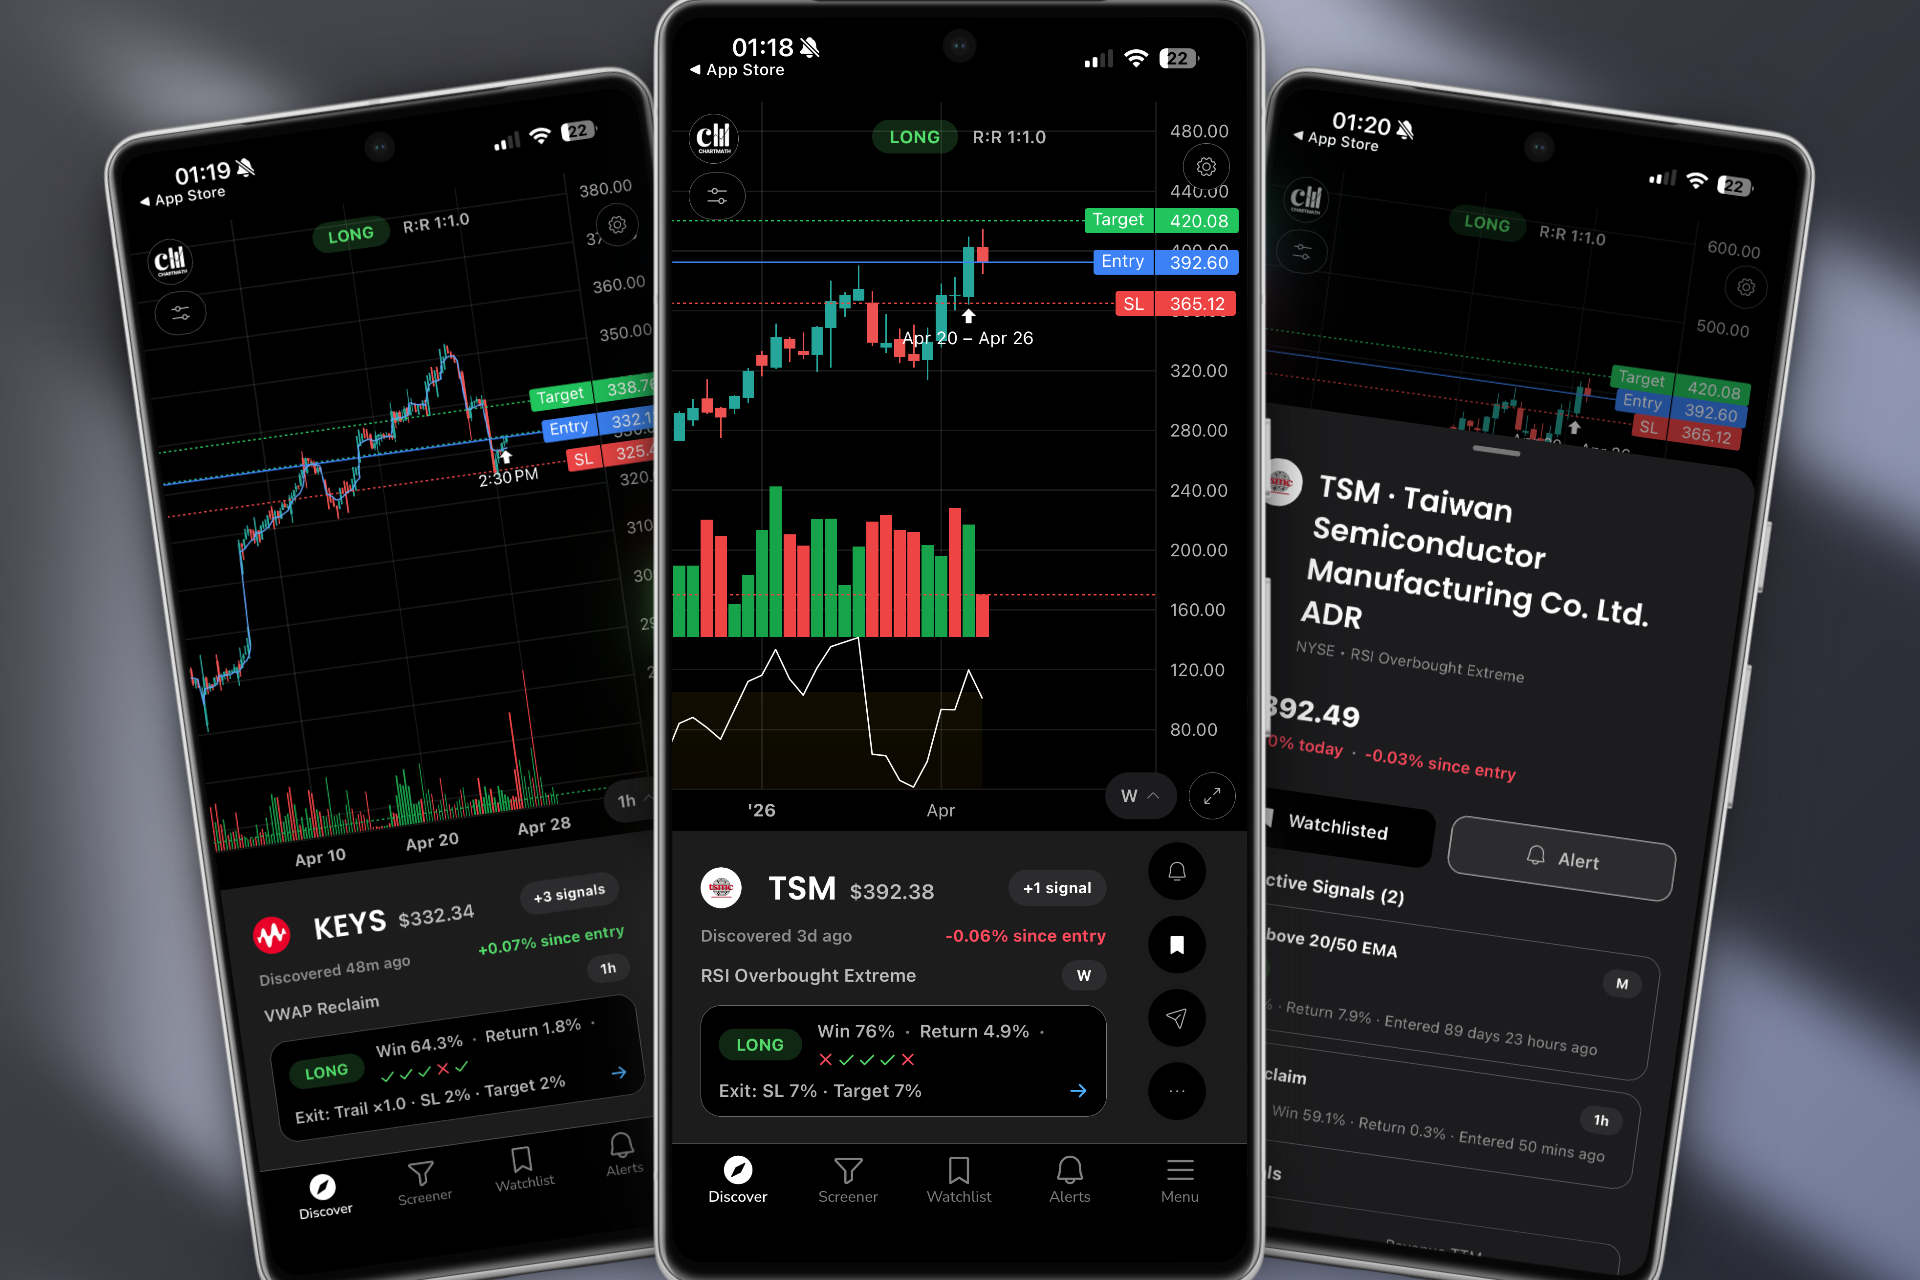
4. Let the Scanner Deliver Your Shortlist to Your Phone
Here's where the workflow becomes genuinely scalable for traders who can't sit at a desk from 8:00 to 9:30 AM every morning.
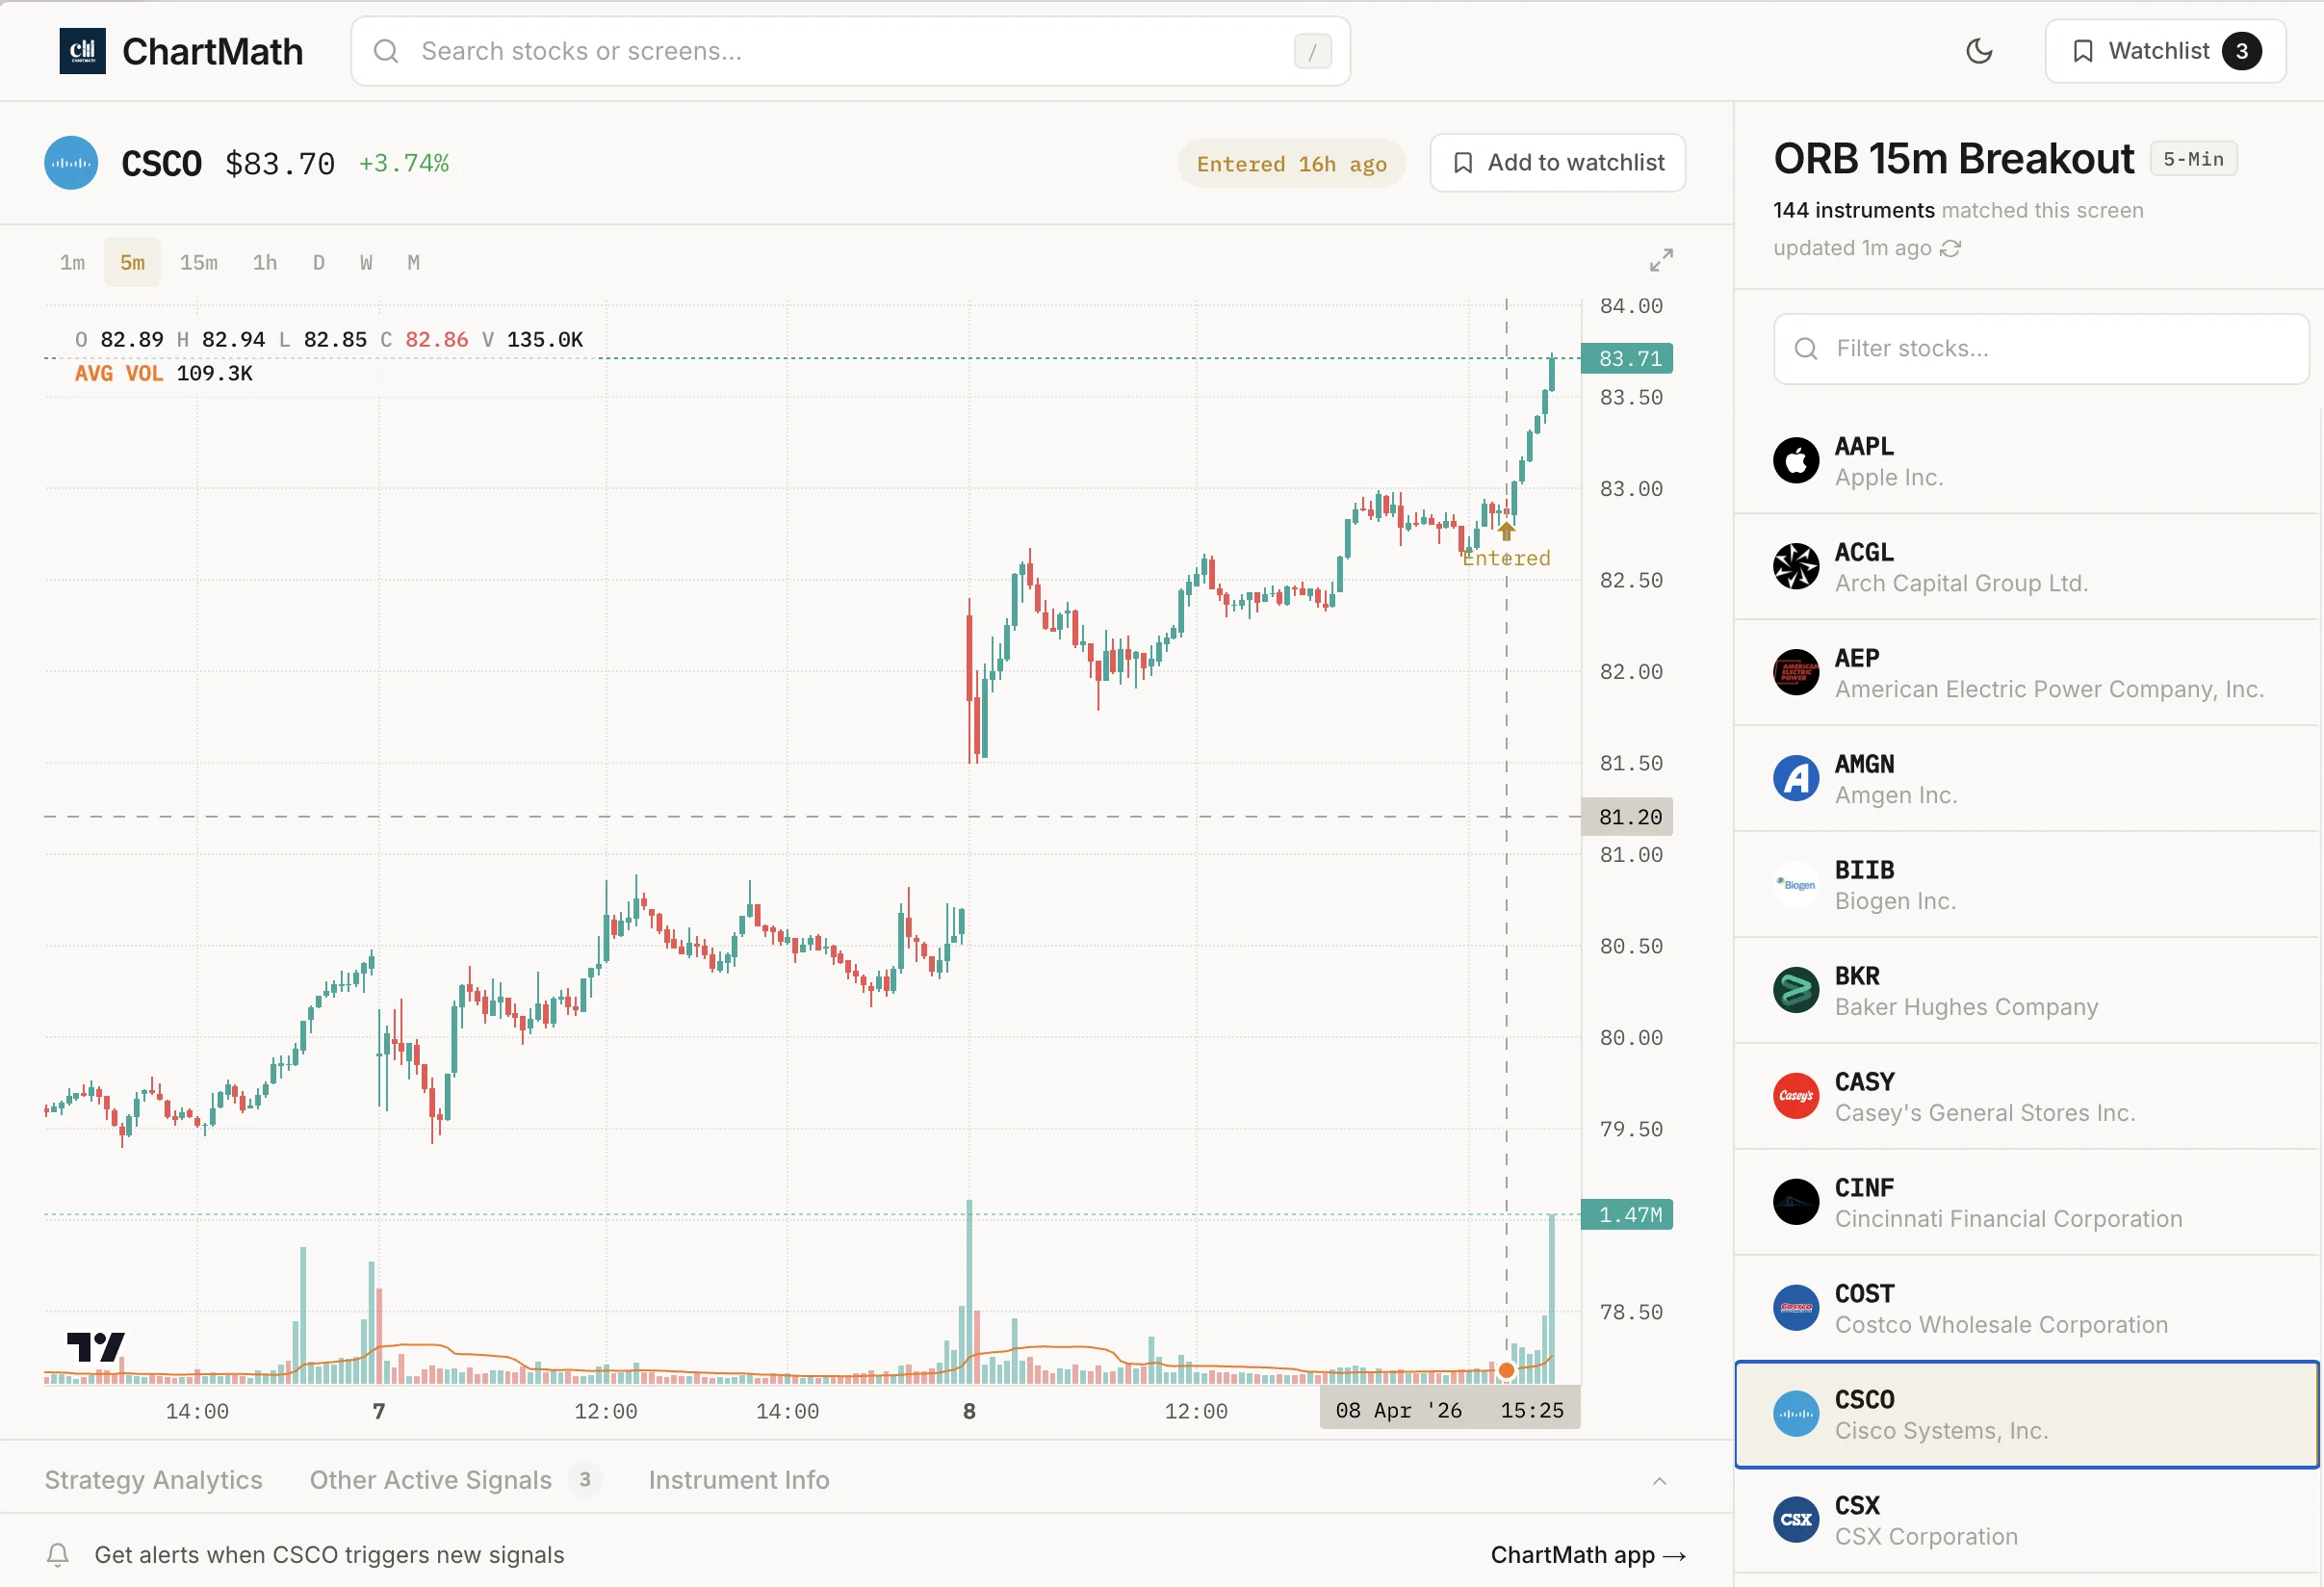
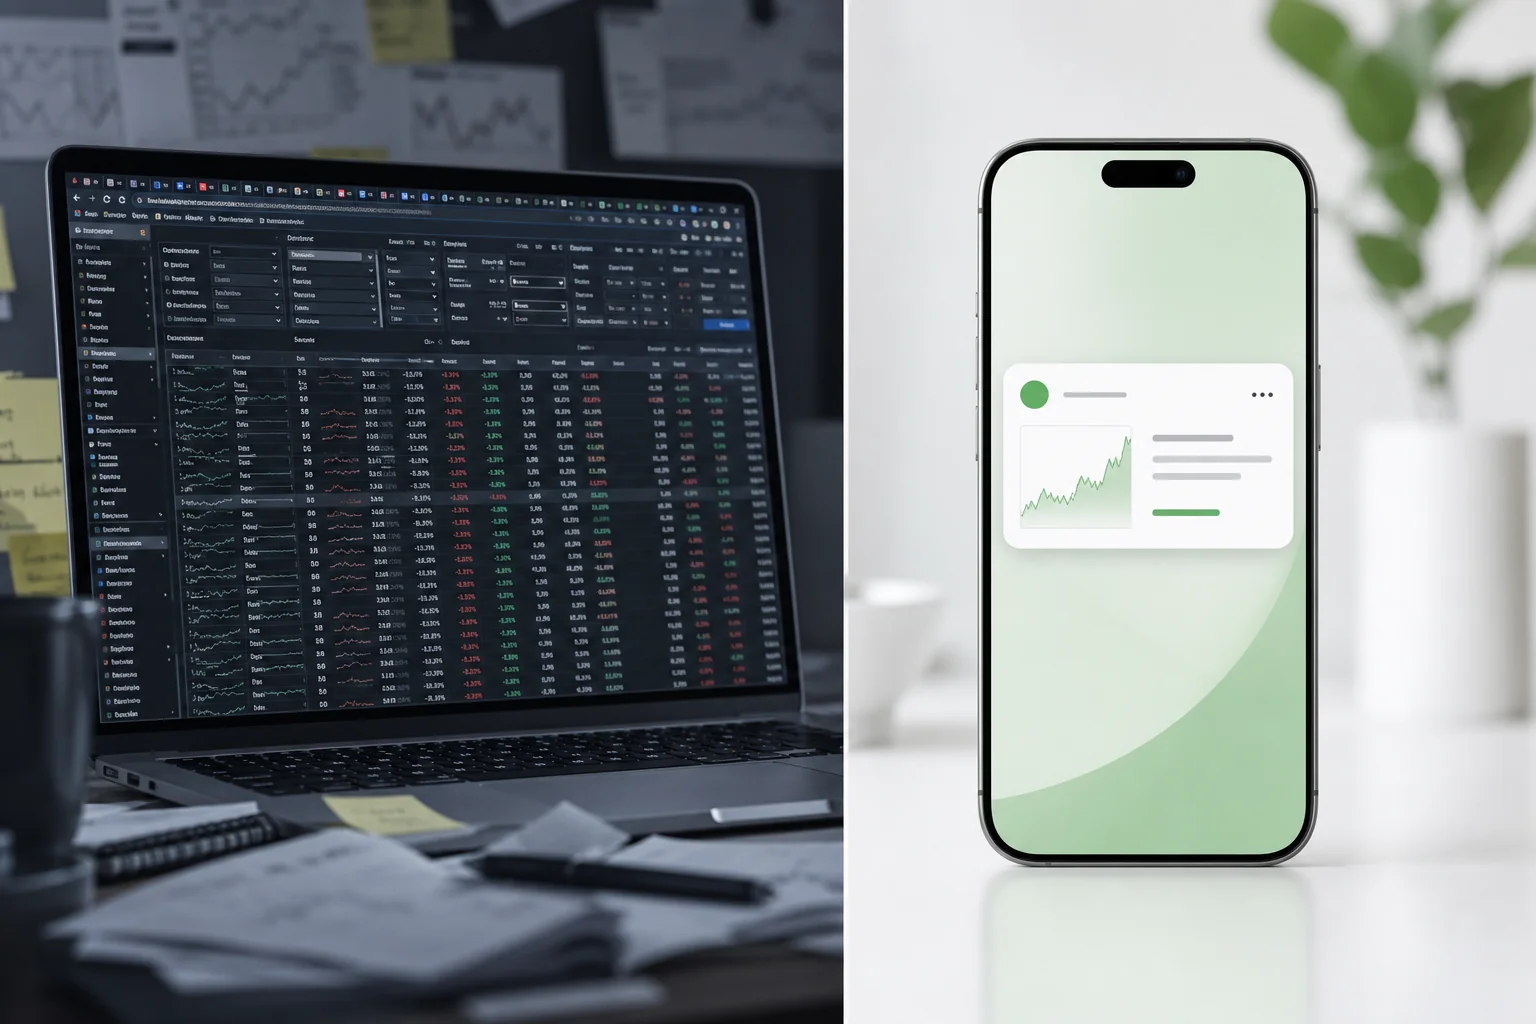
ChartMath scans 500+ US equities (plus 100 crypto pairs and 11 US futures) across 200+ curated technical screens, including ORB-focused setups, across 7 timeframes from 1-minute to monthly. The screens are pre-built and read-only: no Pine Script, no coding, no building your own filter from scratch. You browse the screens, favorite the ones that match your strategy, and ChartMath sends you a push or email alert the moment a ticker enters one of those screens.
The alert isn't just a ticker symbol. It tells you the screen name, the timeframe, and a plain-English explanation of why it triggered. You know immediately whether it's worth pulling up the chart or ignoring. That's the difference between an alert that informs a decision and an alert that just adds to the noise.
For ORB traders specifically, this means:
- You favorite the ORB-related screens in ChartMath the night before
- ChartMath monitors the universe continuously and fires an alert when a ticker enters the screen
- You receive a push notification on your phone with the ticker, the setup, and the reason it triggered
- You pull up the daily chart for a 2-minute confirmation check
- You execute in your own broker
No manual scanning. No refreshing Finviz at 9:15 AM. No missing a setup because you were in a meeting. The scanner does the searching. You do the deciding. That's the copilot model, and it's the right one for self-directed traders who want to stay in control of their own trades. If you're currently paying for a desktop-only platform to do this, the comparison between Trade Ideas and a mobile-first alternative is worth reading before your next renewal.
You can browse ChartMath's full screen library at chartmath.com/screens before downloading the app, so you can see exactly which ORB and momentum screens are available.
5. Execute in Your Own Broker — ChartMath Is the Copilot
ChartMath does not place trades. It does not connect to your broker. It does not have a positions tab or a one-tap order button. That's intentional, and it's worth understanding why.
The ORB setup is a judgment call. The scanner can tell you that a stock has gapped 3.5% on 4x RVOL and entered an ORB screen. It cannot tell you whether the broader market is in a risk-off mood that morning, whether you're already at your position limit, or whether the stock's sector is showing weakness that makes the setup lower-conviction. Those are human judgments, and they belong to you.
What ChartMath gives you to support that judgment is the backtest data behind every screen: the historical Win Rate and Average Return for each setup, so you know whether you're trading a screen with a strong historical edge or a marginal one. That data doesn't guarantee future results, but it gives you a real basis for sizing your conviction. A screen with a strong Win Rate and Average Return across a meaningful sample size deserves more attention than one with thin data.
The workflow is: ChartMath surfaces the setup, you confirm it on your charting platform (TradingView, TrendSpider, or whatever you use), and you execute in your brokerage. Three tools, each doing what it does best. No single platform trying to do everything and doing none of it well.
For traders who want to understand how backtest data should inform position sizing and setup selection, the complete guide to backtesting strategies covers the methodology in detail.
A Sample Premarket ORB Workflow Using ChartMath
Here's what this looks like as a concrete morning routine for a trader with a 9-to-5 job:

The Night Before (10 minutes)
Open ChartMath's Discover feed or browse the Screener tab. Review which stocks appeared in ORB-related screens during the prior session. Check the daily chart on 3-5 candidates that look constructive. Add the strongest ones to your watchlist. Favorite the ORB screens you want alerts on.
8:30, 9:00 AM (5 minutes)
Check your phone for any alerts that fired overnight or early premarket. Review the Discover feed for new ORB candidates that appeared since your evening prep. Note which of your watchlist names are gapping with volume. You're not searching. You're confirming.
9:00, 9:25 AM (5 minutes)
Pull up the daily chart on your 2-3 highest-conviction names. Confirm the structure looks clean. Set your entry level just above the prior day's high or the premarket high, depending on your ORB variant. Know your stop before the open.
9:30 AM onward
The opening range forms. If your candidate breaks out with volume, you have a decision to make. ChartMath may fire an additional alert if the stock enters a breakout screen in real time. You execute in your broker. ChartMath continues monitoring the rest of the universe in the background.
Total active time: under 20 minutes. Total screen-staring required: zero, after the open. That's the workflow a scanner makes possible for traders who can't be glued to their desk from 8:00 AM to 4:00 PM. For a deeper look at how this fits into a full trading day, trading stocks without watching the screen all day covers the broader system.
ChartMath starts with a 14-day free trial — every screen, every backtest, every alert, no card to start. After the trial, founding pricing is $24.99/mo (locked for your first 12 months) or $149/yr. You can get the app at chartmath.com/app on iOS or Android, or browse the screen library on the web at chartmath.com/screens before you download.
Frequently Asked Questions
What is the opening range in ORB trading?
The opening range is the high and low established during a defined window at the start of the regular trading session, typically the first 5, 15, or 30 minutes. An opening range breakout occurs when price moves decisively above the range high (bullish) or below the range low (bearish). The strategy is based on the idea that the opening range reflects the initial balance of supply and demand, and a breakout signals that one side has taken control.
How many stocks should be on a premarket ORB watchlist?
Three to five names is the practical target for most traders. More than that and you're splitting your attention at the open, which is the worst time to be distracted. The goal of premarket scanning is to narrow the field, not expand it. A scanner with pre-built ORB screens helps you get to that shortlist without manually reviewing 50 tickers.
Does ChartMath cover premarket data?
ChartMath scans 500+ US equities, 100 crypto pairs, and 11 US futures across 7 timeframes (1m, 5m, 15m, 1h, Daily, Weekly, Monthly). The platform is designed to surface setups and fire alerts in real time as conditions develop. For the specific premarket data coverage details, check the screens page or the app directly.
What timeframes work best for ORB setups?
The 5-minute and 15-minute timeframes are the most commonly used for defining the opening range itself. The 1-hour and daily timeframes provide the structural context that determines whether the breakout is likely to follow through. ChartMath supports all seven timeframes (1m, 5m, 15m, 1h, Daily, Weekly, Monthly), so you can use multi-timeframe confirmation without switching between platforms. Understanding VWAP alongside ORB adds another layer of confirmation on intraday timeframes.
Do I need to code anything to use ChartMath's ORB screens?
No. ChartMath requires no Pine Script and no coding of any kind. The 200+ screens are pre-built, curated, and ready to use. You browse them, favorite the ones that match your strategy, and set alerts. The only thing you need to do is decide which setups you want to trade. The scanning and alerting happen automatically.
The traders who find the best opening range breakout stocks to watch premarket aren't doing more work than everyone else. They've built a system that does the searching for them, so they can spend their limited premarket time on the judgment calls that actually matter. If you're still manually refreshing screeners at 9:15 AM and hoping you haven't missed anything, that's the problem a scanner solves.
Start your premarket ORB workflow today. Download ChartMath on iOS or Android, browse the full screen library at chartmath.com/screens, and arrive at tomorrow's open with a shortlist that was built by a system, not assembled in a panic. It starts with a 14-day free trial, no card required.

Ankush Jindal
LinkedInSee these setups live in ChartMath
200+ curated screens with backtest data. 14-day free trial.