Telegram Trading Signals vs Backtested Screener: Which Wins?
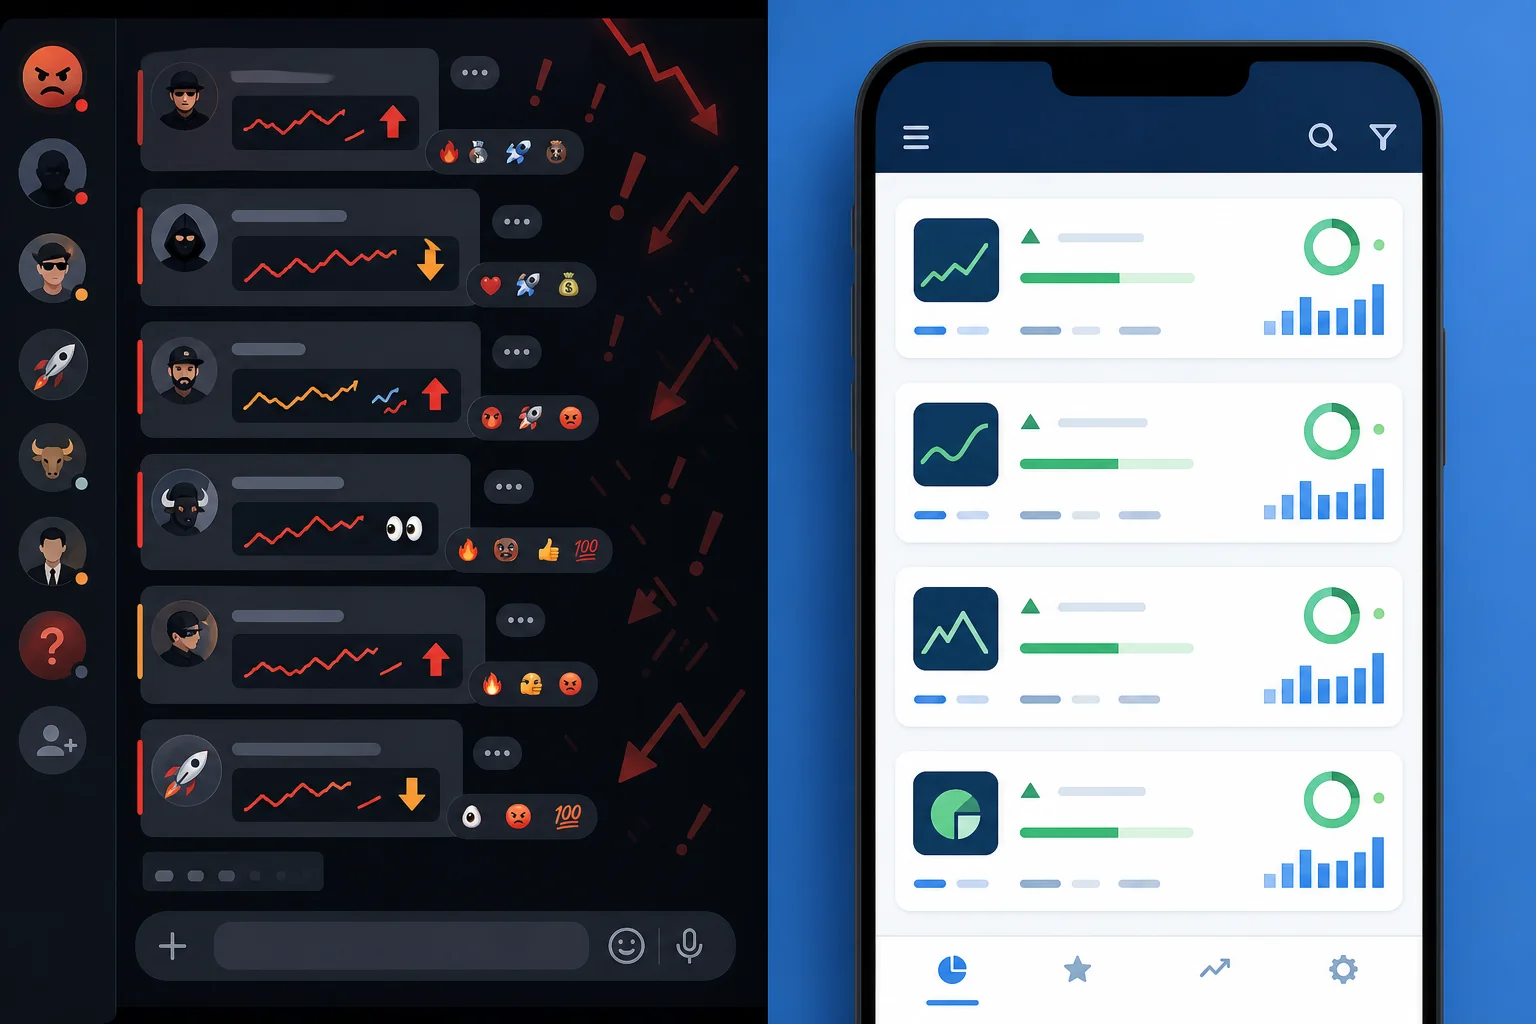
Picture a Telegram group with 12,000 members. Every day, someone posts a ticker, an entry price, and a target. The calls come fast. Some of them work. The channel admin posts the winners in a highlight reel at the end of the week. What you never see is the full list: every call, every outcome, every loss. That missing data is the entire problem.
This post is a direct comparison between Telegram (and Discord) trading signal groups and a backtested stock screener. The argument is not that signal groups are run by bad people. The argument is structural: a signal channel cannot make you a systematic trader, because it has no verifiable track record, no rule transparency, and no risk framework. A backtested screener does. Here is how they differ across every dimension that actually matters.
The Signal Group Promise (and the Fine Print)
The pitch for a Telegram or Discord signal group is simple: someone smarter than you watches the market all day, spots the setups, and sends you the call. You follow along. You make money. You do not need to learn anything.
That pitch is appealing, especially if you have a day job and limited screen time. The problem is not the appeal. The problem is what the pitch leaves out.
Here is what a typical signal group actually delivers:
- A ticker symbol, an entry price, a target, and sometimes a stop
- A short rationale ("breaking out of consolidation", "strong volume today")
- No historical data on how often that rationale has worked
- No sample size, no win rate, no average return
- No defined rule set you could apply yourself to a different stock
The caller's track record, if it exists at all, is usually a screenshot collection of winning trades. Losses disappear. Entries get quietly revised after the fact. There is no audit trail. You are trusting a person's memory and their incentive to look good, not a verifiable data set.
Survivorship bias compounds the problem. The groups that grow large are the ones that had a good run. The ones that blew up quietly dissolved. You are selecting from a biased sample before you even join.
What "Backtested" Actually Means (and Why It Matters)
A backtested screen is a defined rule set applied to historical price data. The rules are explicit: price crosses above a moving average, RSI is below a threshold, volume exceeds a multiple of its average. When those conditions are met, the screen fires. Every historical instance is logged.
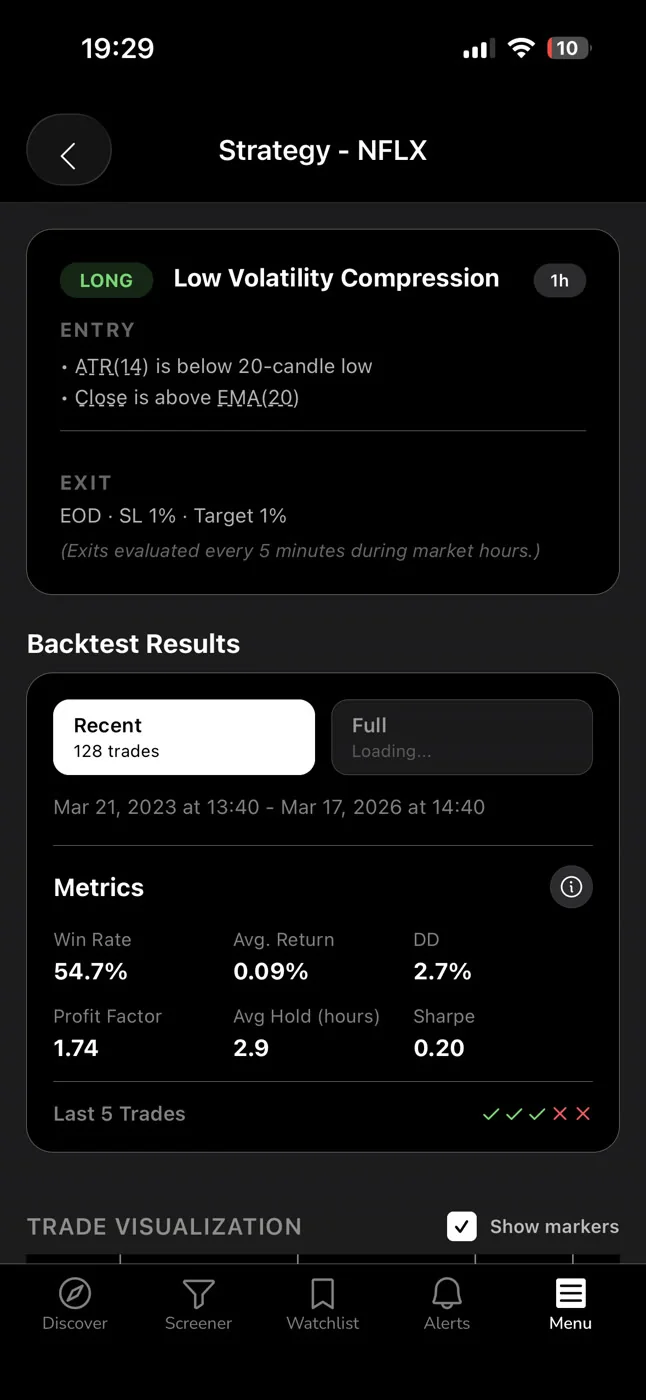
The output is auditable: Win Rate (how often the setup led to a profitable outcome under a defined exit), Average Return per trade, sample size, and an equity curve. These numbers come from a fixed rule applied consistently across hundreds of historical occurrences. They are not a caller's memory. They are not a highlight reel.
Two important caveats apply here, and any honest screener will tell you both. First, backtested results are historical. Past performance does not guarantee future results. A screen with a strong historical Win Rate can still lose on any given trade. Second, backtests that do not model commissions, slippage, or spread will show cleaner numbers than live trading produces. The value of backtest data is not certainty. It is evidence of a repeatable edge, which is something a signal group cannot give you at all.
The question is not "is backtest data perfect?" The question is "is it better than nothing?" Compared to an unverified human caller, the answer is clearly yes. For a deeper look at how to read and use backtest data in your own process, see How to Build Winning Backtesting Strategies: A Complete Guide.
Head-to-Head: 6 Dimensions That Separate Them
Here is a direct comparison across the dimensions that matter most to a retail swing trader.
1. Track Record Transparency
Signal group: No verifiable track record. You see what the admin chooses to share. Wins get highlighted; losses get buried or quietly deleted. There is no way to audit the full call history independently.
Backtested screener: Every screen shows its historical Win Rate, Average Return, and sample size. The numbers are derived from a fixed rule set applied to historical data. You can see the track record before you act on a single alert.
2. Rule Clarity
Signal group: The caller's logic is a black box. "Strong setup" and "breaking out" are not rules. You cannot apply the same logic to a different stock because the logic was never defined in the first place.
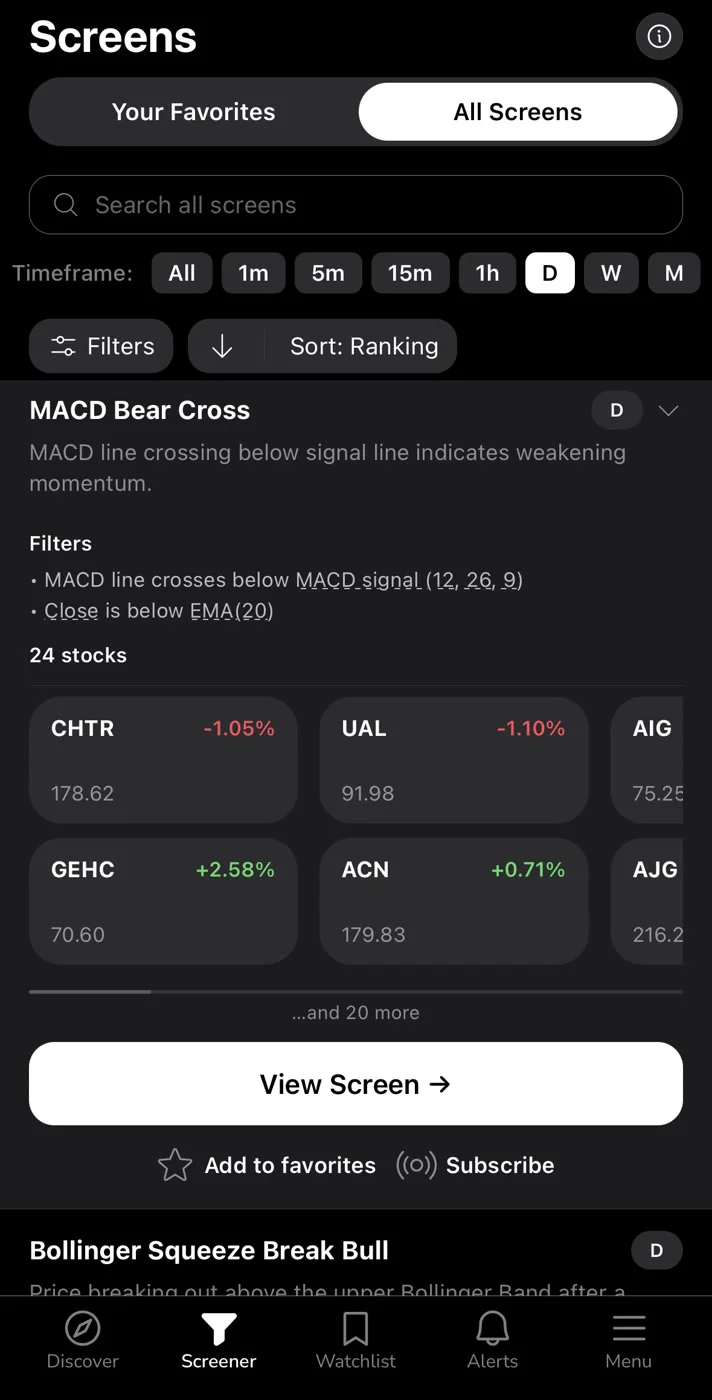
Backtested screener: Each screen has a defined filter rule set written in plain English. You can read exactly what conditions triggered the alert. That transparency is what makes the setup repeatable and auditable.
3. Sample Size and Statistical Validity
Signal group: Even if a caller shares a win rate, the sample size is almost never disclosed. A 70% win rate over 10 trades is statistically meaningless. You need hundreds of occurrences before a win rate tells you anything reliable.
Backtested screener: Sample size is part of the output. A screen with a documented win rate across a large number of historical occurrences carries statistical weight. A screen with a small sample size is flagged as such, so you can weight it accordingly.
4. Noise and Alert Volume
Signal group: Calls fire whenever the caller feels like posting. There is no throttling, no deduplication, no quiet hours. High-volume groups can send dozens of calls per day, most of which conflict with each other or arrive too late to act on.
Backtested screener: Alerts fire when a ticker enters a screen, based on defined rules. A well-built screener includes deduplication and per-bar caps so you are not flooded with repeat alerts on the same setup. Fewer alerts, each with a documented edge behind them.
5. Bias and Conflict of Interest
Signal group: The caller may hold a position before posting the call. They may be paid to promote certain stocks. Even without bad intent, human callers are subject to recency bias, overconfidence after a winning streak, and loss aversion after a drawdown. These biases affect call quality in ways that are invisible to you.
Backtested screener: A rule-based screen has no position to protect and no emotional state. It fires when the rules are met, regardless of what happened yesterday. The bias risk shifts to the screen design itself, which is why backtesting and sample size validation matter.
6. Repeatability and Systematic Edge
Signal group: You cannot replicate the caller's process. If the caller stops posting, or the group shuts down, your edge disappears entirely. You have learned nothing transferable.
Backtested screener: The rules are defined. The edge is documented. You can apply the same screen tomorrow, next month, and next year. You are building a process, not a dependency.
Why Signal Groups Can't Make You Systematic
Systematic trading has a specific meaning. It means you have a defined set of rules for entry, exit, and position sizing. You apply those rules consistently. You track your results. You adjust based on data, not emotion.
A Telegram call gives you a ticker and a price. That is not a system. It is a tip. The difference matters enormously over time.
Without a defined rule set, you cannot size your position correctly. You do not know the historical stop-out rate, so you cannot calculate expected value per trade. You cannot tell whether a losing streak is within the normal variance of a valid strategy or a sign that the strategy has broken down. You are flying blind with someone else's compass.
There is also the dependency problem. If the signal group goes quiet, changes its focus, or the admin has a bad month and stops posting, your entire process collapses. You have not built a skill. You have rented someone else's judgment, with no lease agreement and no exit clause.
For traders who want to build a real process around a day job, the foundation has to be rules-based. That is the only way to trade consistently when you have limited screen time and cannot monitor positions all day. See Swing Trading with a Full-Time Job: A Real System for a practical framework.
What a Backtested Screener Gives You Instead
ChartMath is a mobile-first trade-discovery app built around this exact problem. It scans 500+ US equities (plus 100 crypto pairs and 11 US futures) across 200+ curated, read-only technical screens, across 7 timeframes from 1-minute to monthly.
Every screen in the library has a defined rule set and a backtested track record: Win Rate, Average Return, sample size, and an equity curve. You do not build the screens. You do not write Pine Script. You do not code anything. The screens are pre-built, backtested, and ready to use.
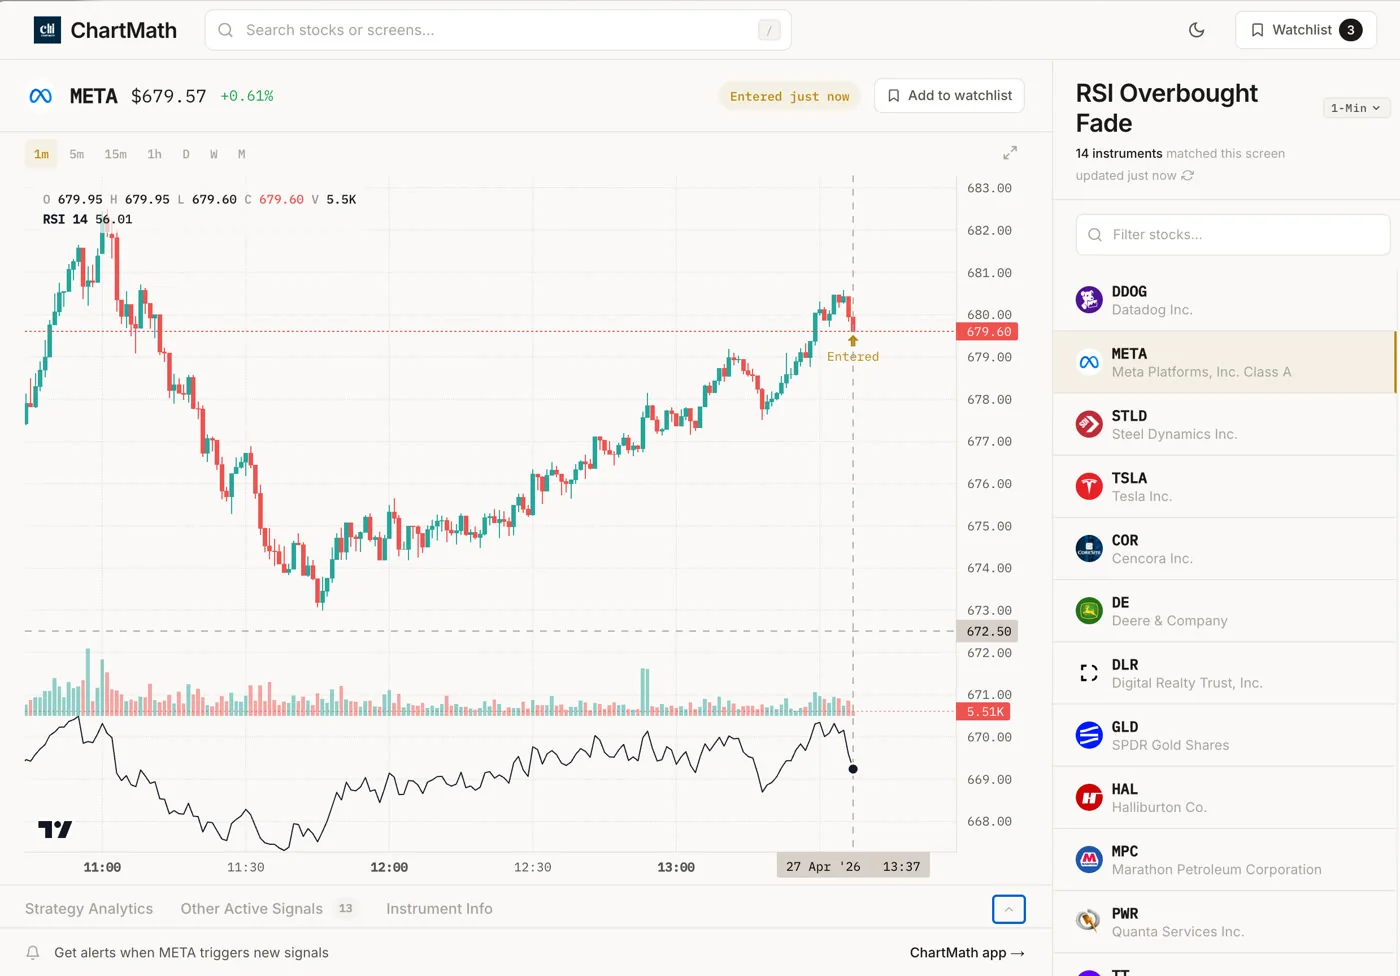
When a ticker enters a screen, you get a push alert. The alert carries the ticker, the timeframe, the screen name, and a timestamp. You can open the screen to read its filter rules in plain English and review its historical Win Rate and Average Return. That is the evidence layer between the alert and your trade decision.
ChartMath is a copilot, not an autopilot. It surfaces the setup. You decide whether to act. You execute in your own brokerage. There is no broker connection, no order placement, no auto-trading. The app does not place trades. It gives you the information to make a better decision yourself.
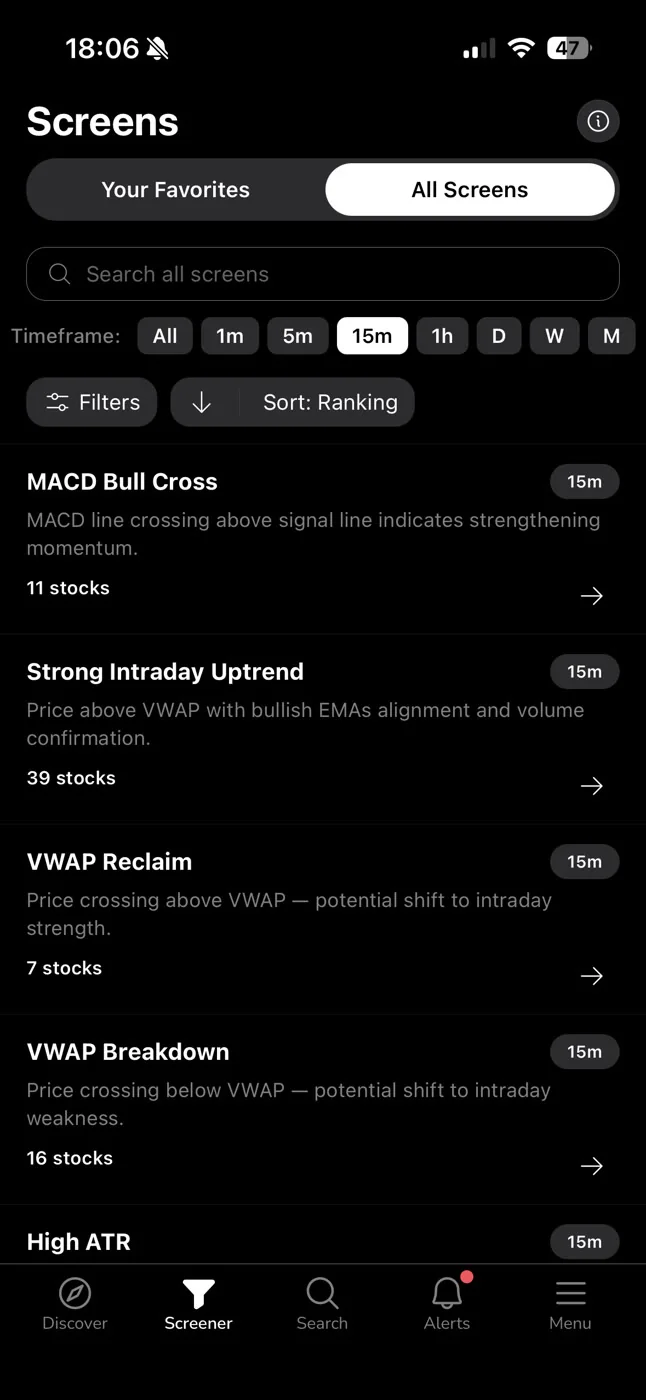
Alerts go out via push notification and in-app only. The Discover feed shows a swipe-based card for each setup, with the screen name, timeframe, and backtested stats. The Screener tab lets you browse all 200+ screens and see which tickers currently match each one. The Search tab gives you access to your single watchlist, synced across devices on mobile.
ChartMath is a paid product with a 14-day free trial, no card to start. After the trial it's $24.99/month founding pricing (locked for 12 months) or $149/year. Every screen, every backtest, and every alert is included.
For a closer look at how the screen library works, you can browse it directly at chartmath.com/screens.
The Noise Problem: Alert Fatigue in Signal Groups vs Screeners
Alert fatigue is a real and underappreciated problem. When you receive too many alerts, most of which are low-quality or redundant, you start ignoring all of them. The good ones get buried in the noise. You either act on everything (and overtrade) or tune everything out (and miss the setups you actually wanted).
Signal groups are structurally prone to this problem. There is no mechanism to prevent a caller from posting 15 tickers in a day. There is no deduplication. There is no quiet hours setting. The volume is driven by the caller's activity level, not by the quality of the setups.
A well-designed screener addresses this directly. ChartMath's alert system includes deduplication (so the same setup does not fire multiple times for the same ticker on the same bar), per-bar caps, and throttling. The result is fewer alerts, each tied to a screen with a documented historical edge.
The goal is not to send you as many alerts as possible. The goal is to send you the right alerts at the right time, so you can act on them without drowning in noise. For more on managing alert volume, see How to Avoid Alert Fatigue From Stock Screeners: The Swing Trader's Fix.
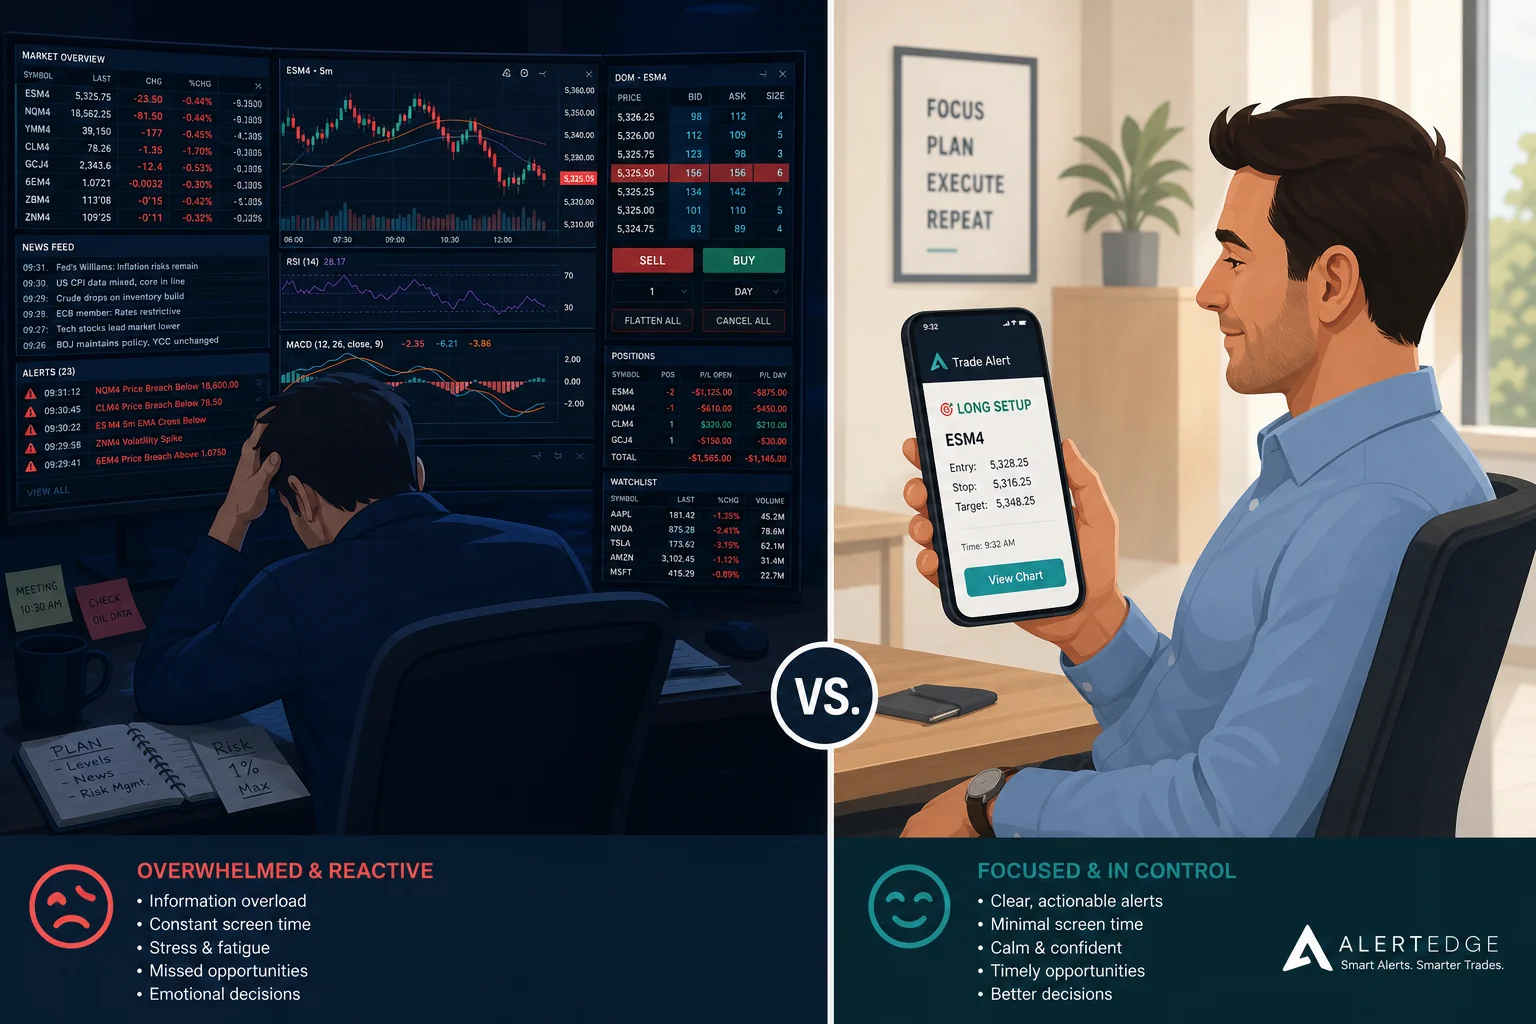
A Practical Workflow: From Signal to Trade Decision
Here is how the two approaches play out in practice for a trader with a day job.
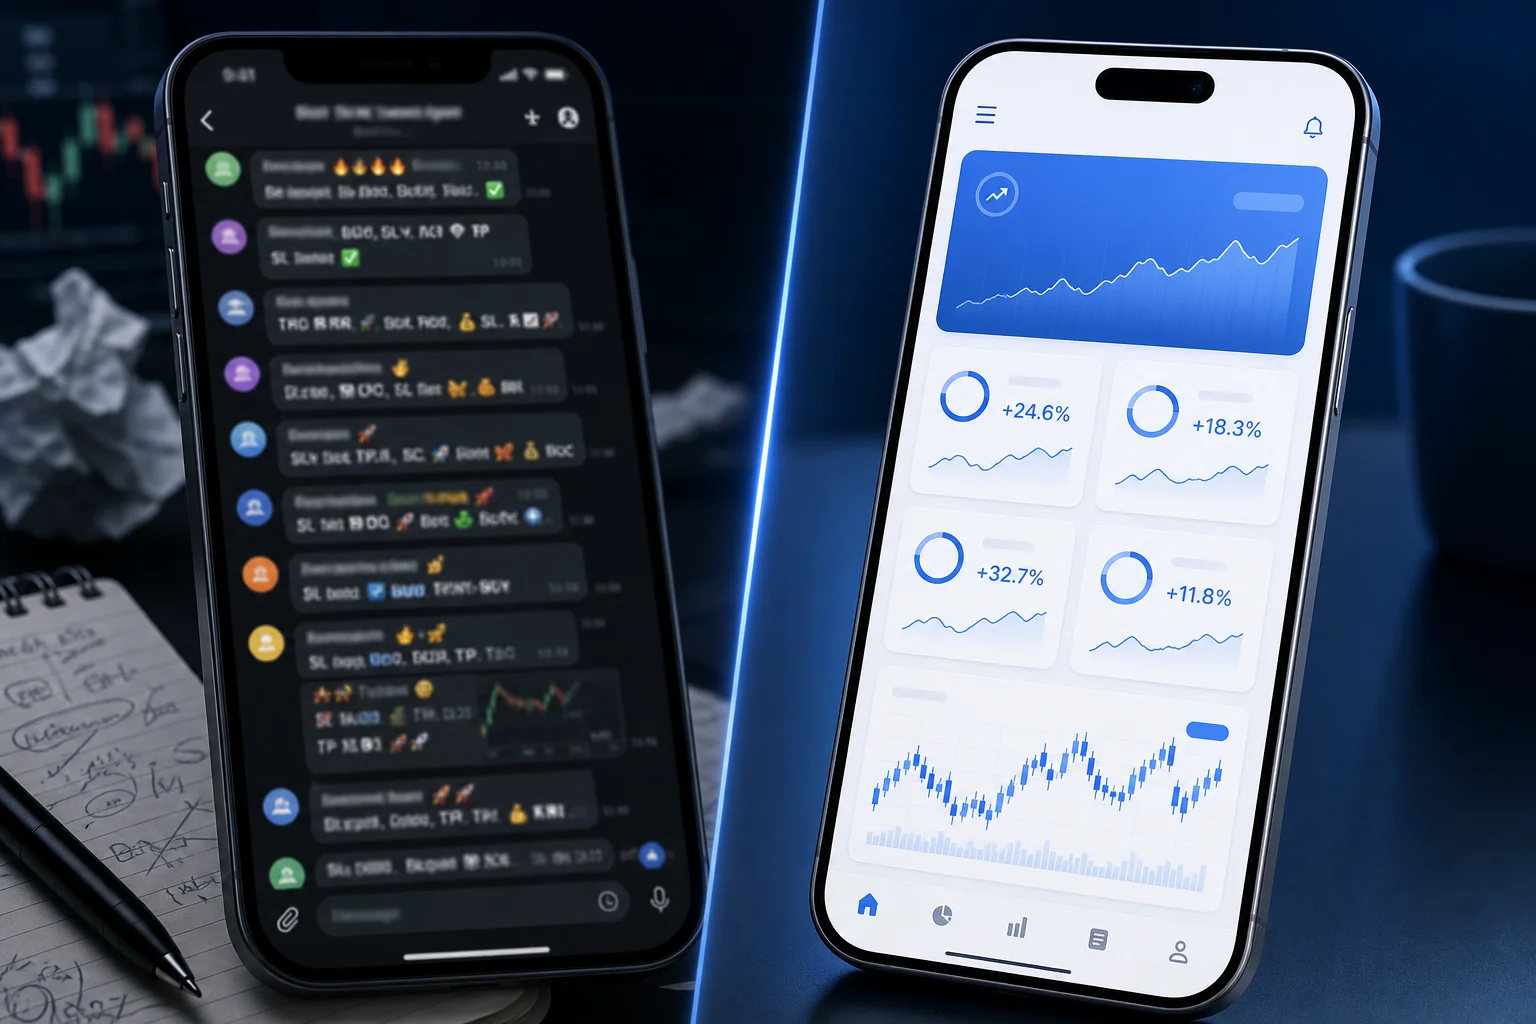
The Signal Group Workflow
- You receive a Telegram message: "TICKER X, entry $48, target $54, stop $45."
- You check the chart. It looks reasonable, but you have no idea how often this setup has worked historically.
- You have no position sizing framework because you do not know the historical stop-out rate.
- You either take the trade on faith or skip it. Either way, you are not building a process.
- The trade works or it does not. You have no way to know whether the outcome was skill, luck, or variance.
The Backtested Screener Workflow
- You receive a push alert: a ticker has entered a specific screen on the daily timeframe.
- You open the app and check the screen's Win Rate and Average Return across its historical sample.
- You read the screen's filter rules in plain English to confirm the setup matches your criteria.
- You check the chart in your own charting platform to confirm the setup visually.
- You size the position based on your standard risk per trade, informed by the screen's historical stop-out rate.
- You execute in your own brokerage. The app does not place the trade for you.
The difference between these two workflows is the evidence layer. In the signal group workflow, you are acting on someone else's judgment with no data to support or challenge it. In the screener workflow, you are acting on a rule-based alert with a documented historical track record. You are still making the decision. You just have better information.
For traders who want to build this kind of workflow around a busy schedule, see How to Trade Stocks Without Watching Screen All Day and How to Build an Efficient Trading Workflow in 2026.
If you want to see how VWAP-based setups work within a systematic screener framework, VWAP Trading: How to Use Volume-Weighted Average Price is a good starting point.
Frequently Asked Questions
Are Telegram trading signals ever useful?
They can surface tickers worth researching. The problem is using them as a primary decision-making tool. Without a verifiable track record, defined rules, or a risk framework, a signal group call is a starting point at best. It is not a system.
What is a backtested win rate and can I trust it?
A backtested win rate is the percentage of historical occurrences of a defined setup that resulted in a profitable outcome under a specific exit rule. It is historical data, not a forecast. It tells you how a rule-based setup has performed in the past, which is meaningful evidence of edge, but it does not guarantee future results. Backtests that do not model commissions, slippage, or spread will show cleaner numbers than live trading. Use win rate as one input in your decision, not as a certainty.
Do I need to know coding to use a backtested screener?
Not with ChartMath. There is no Pine Script, no coding, and no screen builder. The 200+ screens are pre-built and ready to use. You browse them, set alerts on the ones that match your strategy, and receive push notifications when a ticker enters a screen.
What markets does ChartMath cover?
ChartMath is US-first: 500+ US equities (NYSE/Nasdaq), plus 100 crypto pairs and 11 US futures, across 7 timeframes from 1-minute to monthly.
Is ChartMath free?
ChartMath is a paid product with a 14-day free trial, no card to start. After the trial it's $24.99/month founding pricing (locked for 12 months) or $149/year.
The core difference between a Telegram signal group and a backtested screener is not convenience or cost. It is whether you are building a systematic process or renting someone else's judgment. Signal groups give you calls. A backtested screener gives you rules, evidence, and a repeatable framework you can apply yourself.
If you are ready to trade with data behind every setup rather than a stranger's screenshot, download ChartMath on iOS or Android and start with the screen library. And unlike a signal group, every setup we post on our @BacktestedSetups channel is backed by a documented backtest. Start with a 14-day free trial, then $24.99/mo founding (locked 12 months) or $149/yr, no card to start. Or browse the full screen catalog at chartmath.com/screens before you download.

Ankush Jindal
LinkedInSee these setups live in ChartMath
200+ curated screens with backtest data. 14-day free trial.