Best Trade Ideas Alternative for Swing Traders
Trade Ideas has a reputation. Ask any serious day trader what scanner they use, and there's a good chance it comes up. The platform is genuinely powerful: real-time scanning, AI-assisted alerts, a deep filter library. For a professional day trader who sits at a three-monitor setup from 9:30 AM to 4:00 PM, it earns its place.
But here's the thing most reviews skip: Trade Ideas was built for that person. Not for you. If you have a day job, a commute, and a phone that needs to do most of the heavy lifting, Trade Ideas is a $118-per-month solution to a problem you don't have — while leaving your actual problem completely unsolved.
This post breaks down the real differences between Trade Ideas and the alternatives that actually fit a swing trader's schedule. No fluff, no affiliate rankings. Just an honest look at cost, mobile usability, alert quality, and backtest transparency so you can pick the right tool for the way you actually trade.
Why Trade Ideas Is the Wrong Tool for Most Swing Traders
Trade Ideas is a professional-grade intraday scanner. That's not a knock — it's a description. The platform is built around real-time Level 2 data, sub-second scanning, and an AI assistant called Holly that generates pre-market trade ideas for the opening bell. Every one of those features assumes you're at your desk when the market opens and staying there until it closes.
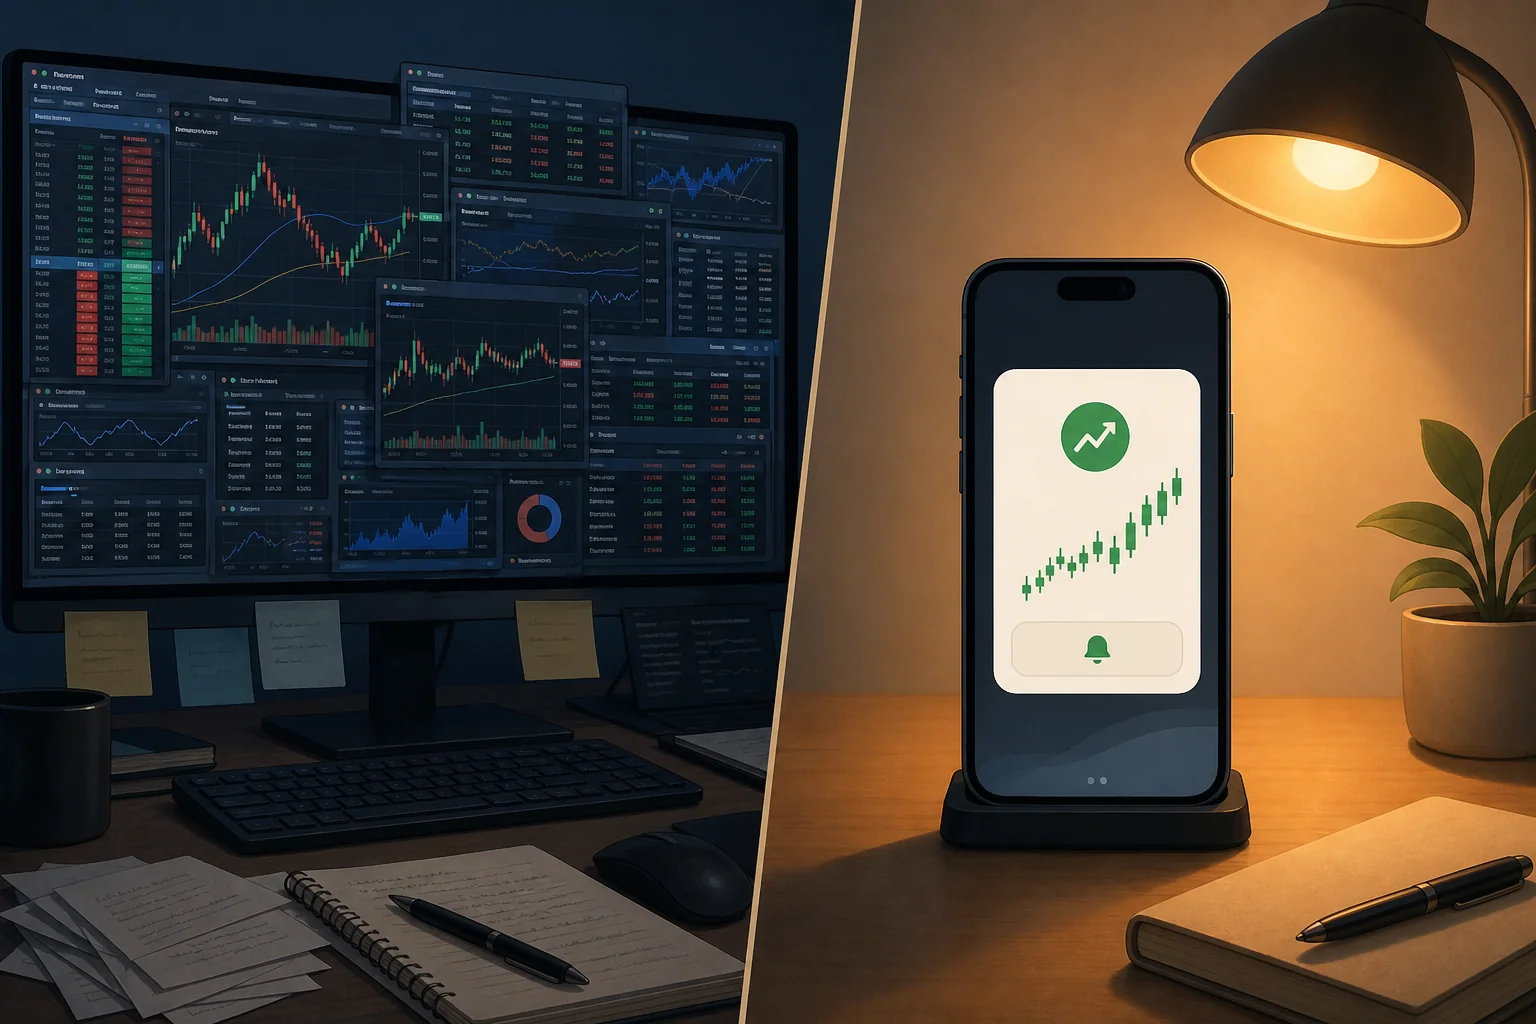
Swing traders with day jobs operate on a completely different schedule. You're checking charts at 7 AM before work, maybe glancing at your phone during lunch, and doing your real prep after 5 PM. The setups you care about form over days and weeks on the daily and weekly chart, not in 30-second candles. You need a scanner that works on your timeline, not one that demands you work on its timeline.
The cost compounds the mismatch. At $118 per month for the standard plan, Trade Ideas is priced for traders who generate enough daily P&L to justify it as a business expense. For a part-time swing trader running a $10,000 to $30,000 account, that's a meaningful drag on returns before you've placed a single trade.
There's also the complexity problem. Trade Ideas gives you enormous flexibility to build custom scans, but that flexibility comes with a steep learning curve. Setting up a scan that actually matches your strategy takes hours of configuration. Most swing traders don't need that level of customization. They need a curated set of proven setups, ready to go, with alerts that fire when something matches.
The mobile experience is the final gap. Trade Ideas has a mobile app, but the platform was designed desktop-first. The core workflow — building scans, monitoring windows, acting on Holly's alerts, is a desktop experience. For a trader whose primary device during market hours is a phone, that's a fundamental mismatch.
What Swing Traders Actually Need From a Scanner
Before comparing tools, it helps to be specific about what a swing trader with a day job actually needs. The requirements are different enough from a day trader's that most scanner reviews miss them entirely.
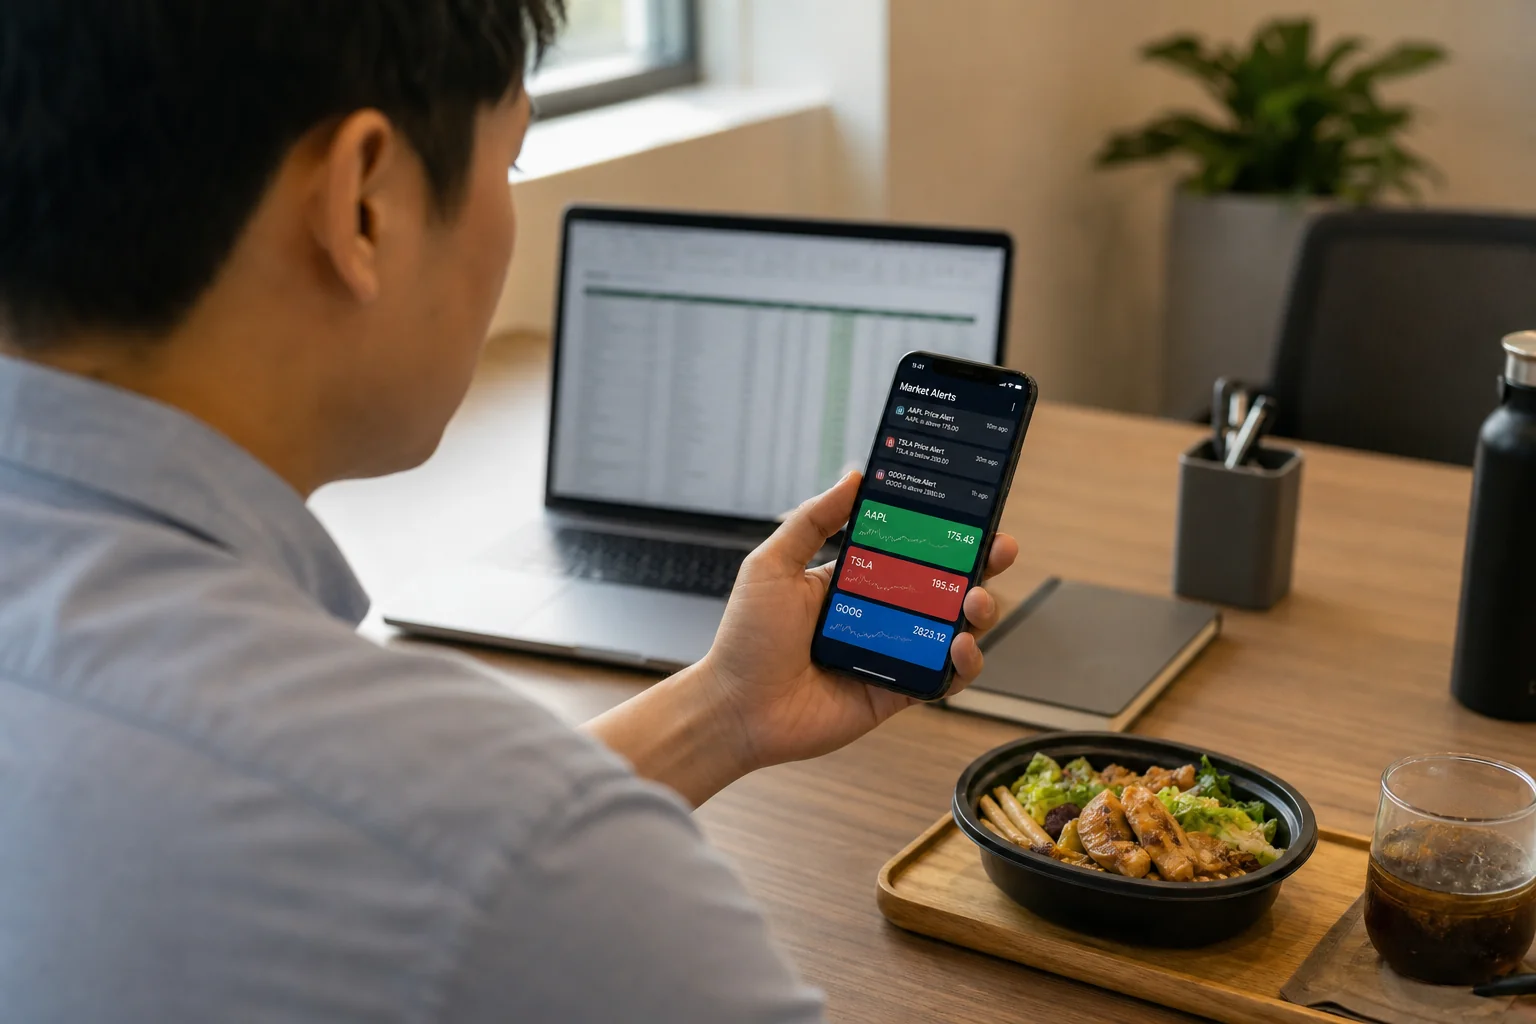
Mobile-first alerts. You're not at your desk when setups form. You need push notifications that fire the moment a stock matches a setup, with enough context in the alert itself to decide whether it's worth acting on. An alert that just says "AAPL triggered" is useless. An alert that tells you which setup fired, on which timeframe, and why, is actionable.
Backtested performance data. Every scanner will show you signals. Very few will tell you whether those signals have historically worked. Win Rate and Average Return per setup are the difference between trading with an edge and trading on hope. Without that data, you're flying blind. For a deeper look at how to evaluate backtest data, see our guide on how to build winning backtesting strategies.
Daily and weekly timeframe coverage. Swing setups live on the daily and weekly chart. A scanner optimized for 1-minute and 5-minute bars is solving a different problem. You need a tool that scans across multiple timeframes, with the daily chart as the primary signal source.
Low noise. Alert fatigue is real. A scanner that fires 200 alerts a day trains you to ignore them. You need a system with built-in quality filters, de-duplication, throttling, and a curated universe, so that when an alert fires, it's worth looking at. If you've dealt with this problem before, our post on trading stocks without watching the screen all day covers the workflow side of the equation.
No coding required. Pine Script and custom scan logic are powerful tools for traders who have time to learn them. Most swing traders with day jobs don't. A scanner with 200+ pre-built, backtested screens eliminates the setup overhead entirely.
Trade Ideas vs. the Alternatives: Head-to-Head Comparison
Here's how the main options stack up across the dimensions that matter most for swing traders:
| Tool | Price | Mobile Alerts | Backtest Data | Ease of Use | Best For |
|---|---|---|---|---|---|
| Trade Ideas | ~$118/mo | Limited (desktop-first) | Via Holly AI (intraday) | Steep learning curve | Full-time day traders |
| TradingView | Free–$60+/mo | Price alerts only | No per-signal backtest | Moderate (Pine Script) | Charting & analysis |
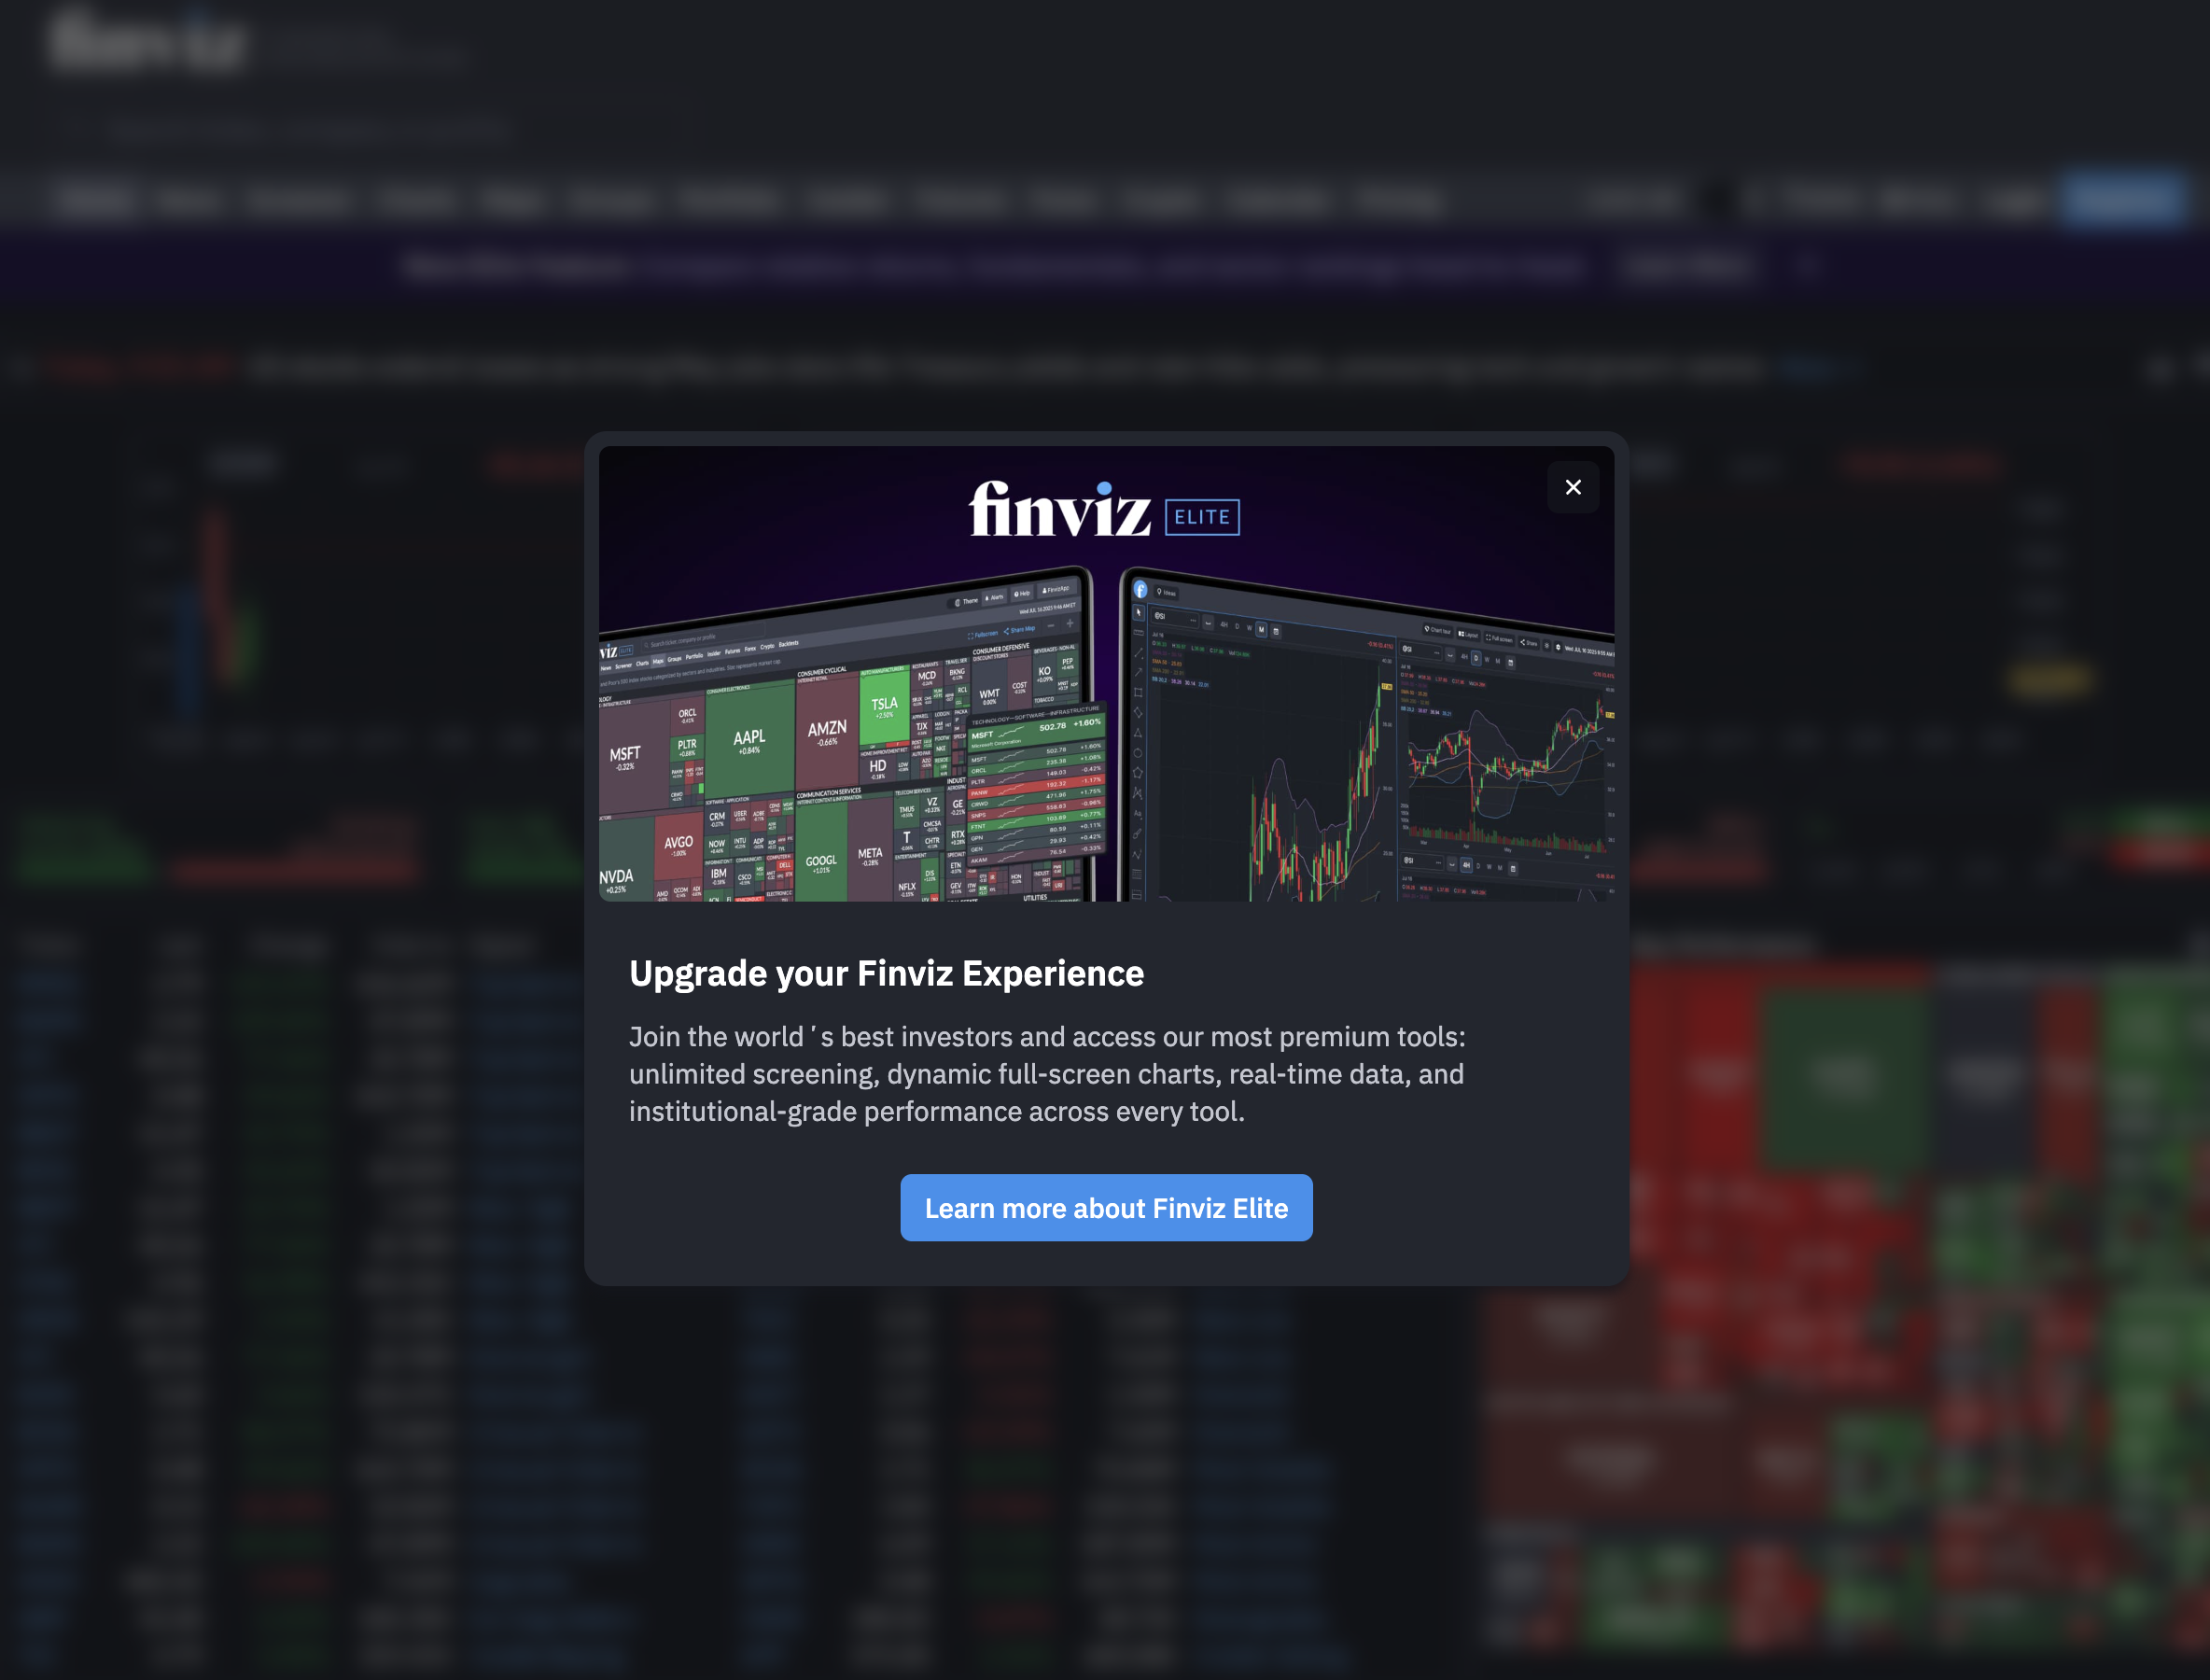
| Finviz | Free–$40/mo | No push alerts | None | Easy (static filters) | Static screening |
| ChartMath | 14-day trial, then $24.99/mo | Push + email, explainable | Win Rate + Avg. Return per screen | No coding needed | Swing traders with day jobs |
Trade Ideas is the most powerful tool on this list for intraday scanning. But power and fit are different things. For a swing trader who needs daily-chart setups pushed to their phone, the complexity and cost are hard to justify.
TradingView is the charting standard for a reason. The screener is solid, the community scripts are extensive, and the charts are best-in-class. The gap is that TradingView's screener doesn't attach historical win rate data to each signal, and its mobile alerts are price-level only, not setup-based push notifications. It's a great companion tool, but it's not a trade discovery engine on its own. Our post on the real tradeoffs of switching from Trade Ideas covers this in more depth.
Finviz is a capable static screener. It's fast, free at the basic tier, and easy to use. The problem for swing traders is that it doesn't push alerts to your phone, and it doesn't explain why a setup triggered. You have to go to it, it won't come to you.
ChartMath is built specifically for the gap these tools leave open: a mobile-first trade-discovery app that scans a curated universe, attaches backtested performance data to every setup, and pushes explainable alerts to your phone the moment a stock matches a screen.
ChartMath: The Standout Pick for Swing Traders With a Day Job
ChartMath was designed around a specific constraint: the trader who can't watch charts during market hours. Every product decision flows from that starting point.
The universe is curated rather than exhaustive: 500+ US equities, 100 crypto pairs, and 11 US futures, scanned across 200+ pre-built technical screens and 7 timeframes (1-minute, 5-minute, 15-minute, 1-hour, Daily, Weekly, and Monthly). For swing traders, the Daily and Weekly timeframes are where most of the action is. The 1-minute and 5-minute coverage is there for traders who want intraday precision, but the platform doesn't force you into a timeframe that doesn't fit your style.
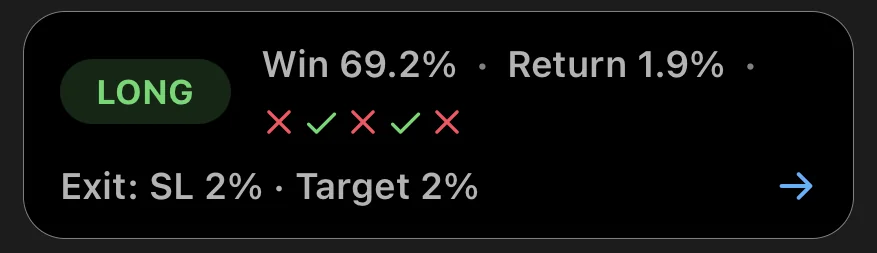
The core surface is the Discover feed: a swipe-first stream of explainable entry cards. Each card shows you a symbol, the screen it matched, and a plain-English explanation of why the setup triggered right now. Not "AAPL triggered Screen 47." Something closer to "Apple cleared a multi-week resistance level on above-average volume on the daily chart." That context is what turns a signal into a decision.
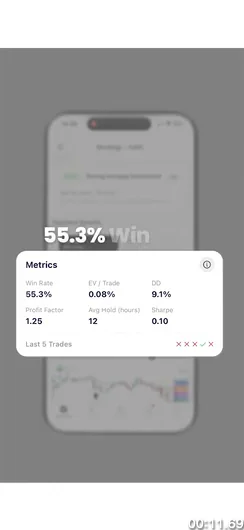
Every screen in ChartMath ships with its Win Rate and Average Return from backtesting. You can see, before you act, how often this type of setup has historically worked and what the average move looked like. That's the data most scanners don't give you, and it's the data that separates systematic trading from guesswork.
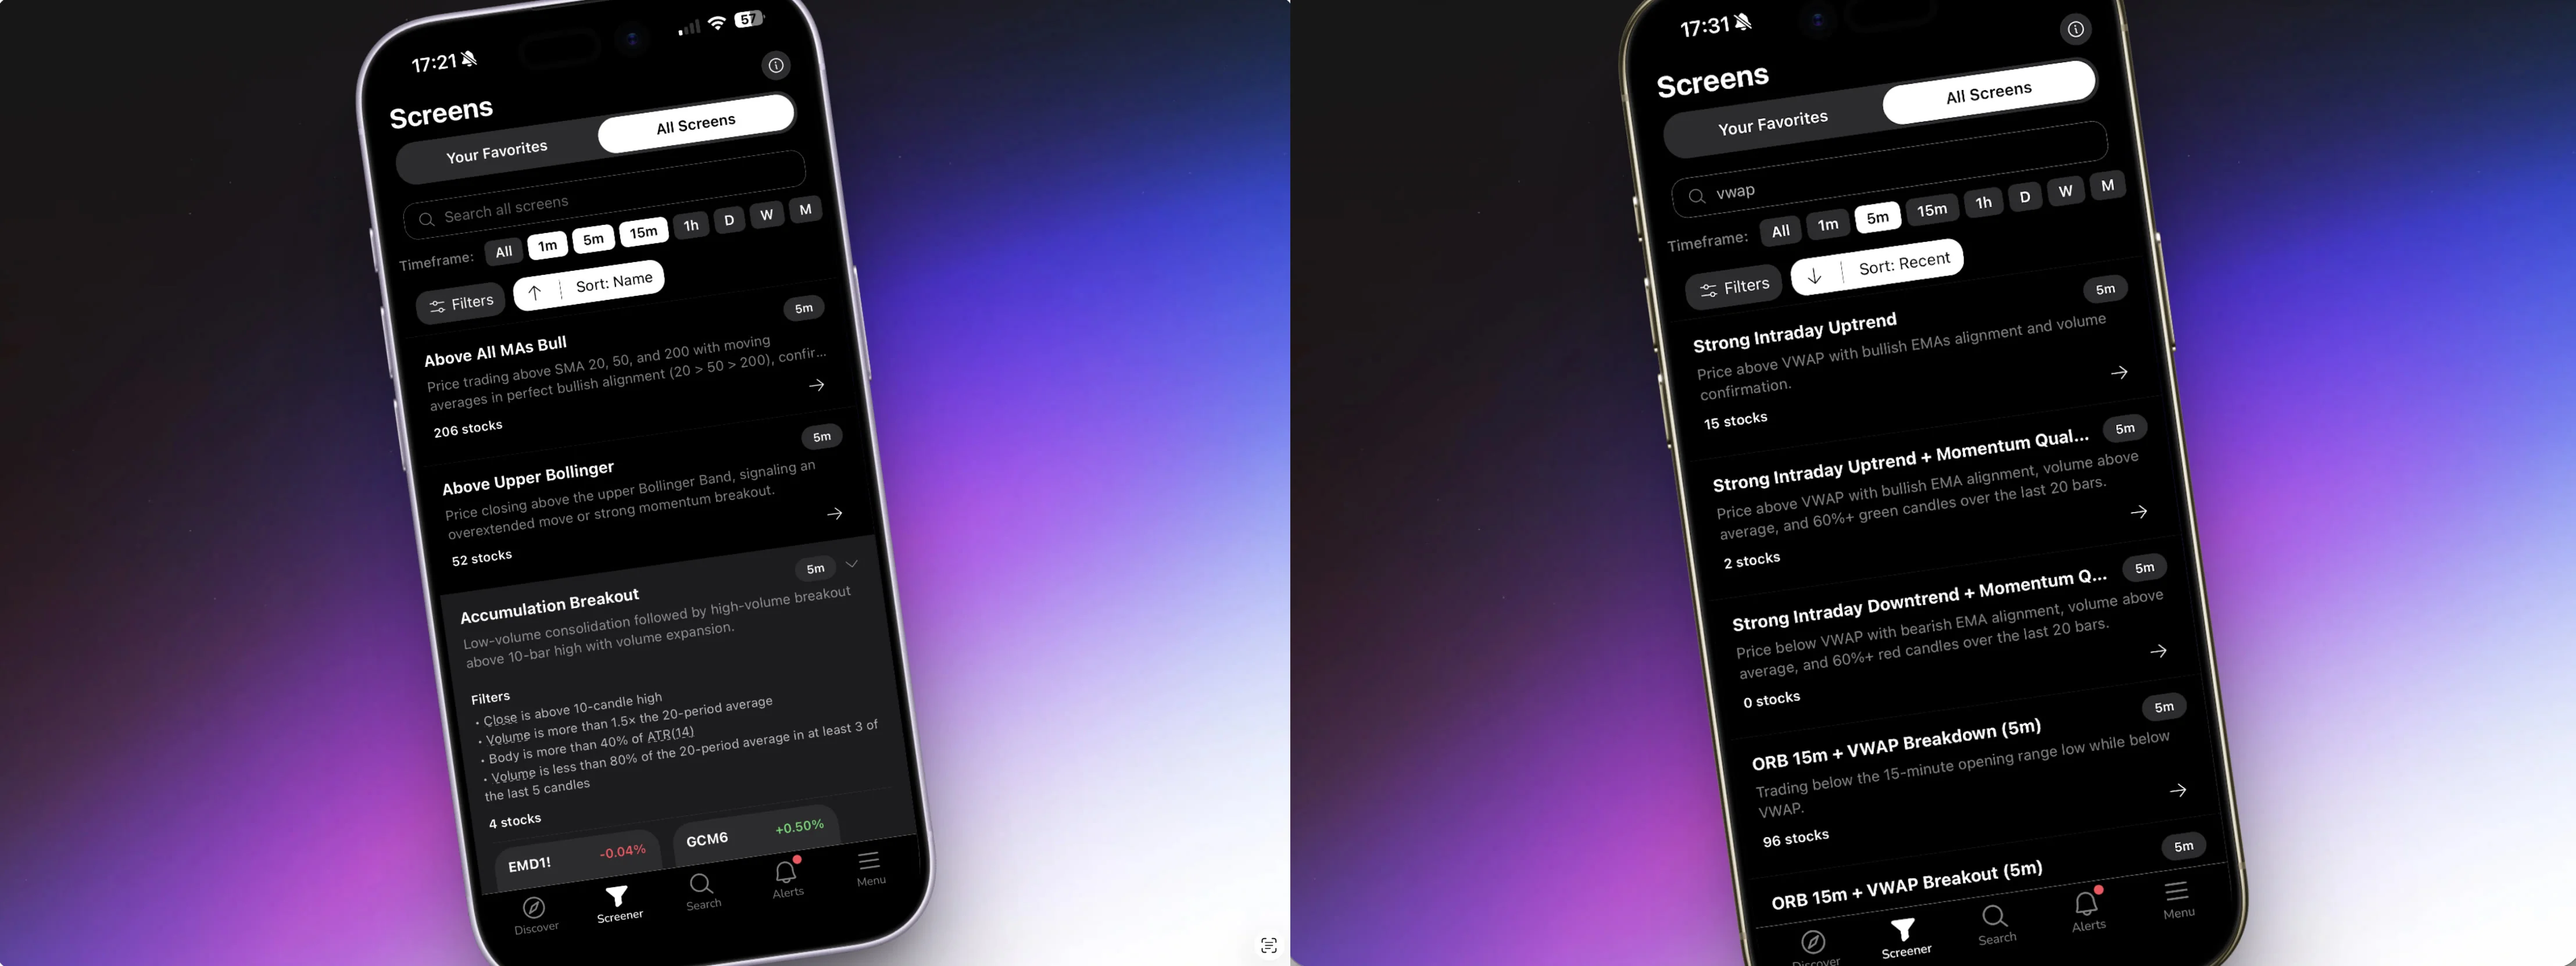
The platform requires no Pine Script and no coding. There's no screen builder to configure, no filter logic to write. You browse 200+ curated, read-only screens in the Screener tab, favorite the ones that match your strategy, and enable alerts. That's the entire setup process. For traders who've spent hours wrestling with TradingView's Pine Script editor or Trade Ideas' scan builder, the contrast is significant. Our post on stock scanning without Pine Script explains why this matters for part-time traders.
ChartMath starts with a 14-day free trial: every screen, every backtest, every alert, no card to start. After the trial, founding pricing is $24.99/mo (locked for your first 12 months) or $149/yr.
How ChartMath's Alert System Beats Trade Ideas for Part-Time Traders
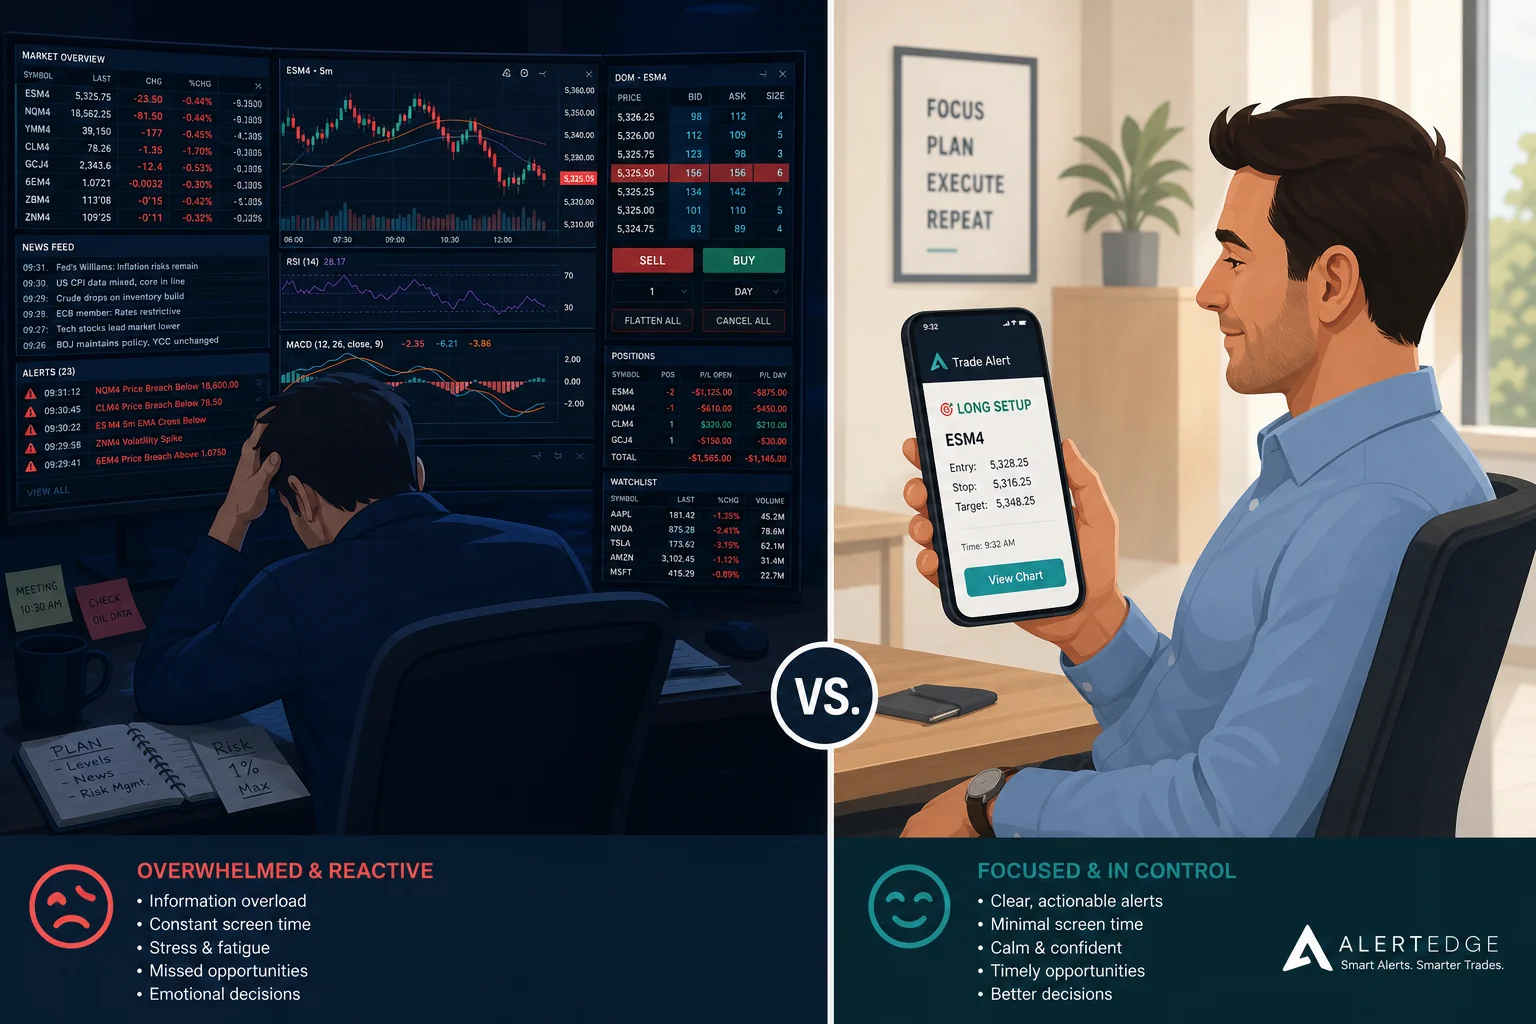
The alert is the product for a trader who can't watch charts. Everything else is setup. So the quality of what arrives on your phone matters more than almost any other feature.
ChartMath alerts carry real payload. When a stock enters a screen you've favorited, the push notification includes the ticker, the timeframe, the screen name, a plain-English explanation of why it fired, a timestamp, and a deep link that takes you directly to the setup in the app. You don't have to open the app and hunt for what triggered. The alert itself tells you what you need to know to make a decision.
The system is also built to prevent alert fatigue. De-duplication means the same setup on the same ticker doesn't fire repeatedly. Throttling prevents a single volatile session from flooding your phone. A per-bar cap limits how many alerts can fire in a given period. Timezone-aware quiet hours mean you're not getting pinged at 2 AM. These aren't minor conveniences, they're the difference between a notification system you trust and one you eventually mute.
Trade Ideas, by contrast, is built for volume. The platform's strength is scanning thousands of conditions simultaneously and surfacing intraday momentum plays in real time. For a day trader at their desk, that firehose is the point. For a swing trader checking their phone between meetings, it's noise. The alert philosophies are fundamentally different.
ChartMath also offers a symbol-level alert builder alongside the screen-enter alerts. You can set alerts on specific tickers in your watchlist, so when a stock you're already tracking enters any of the 200+ screens, you hear about it. That's a meaningful upgrade over price-level alerts that fire regardless of whether the technical setup is actually there.
Alerts go out via push and email only. No SMS. That's a deliberate choice: push notifications are immediate and actionable, email provides a record, and SMS adds noise without adding value for this use case.
The Backtest Transparency Gap: Why It Matters for Swing Traders
Most scanners will show you a signal. Almost none will tell you whether that signal has historically worked.
That gap matters more for swing traders than for day traders. A day trader can take 20 trades a week and build a real sample size of personal results relatively quickly. A swing trader holding positions for days or weeks might take 5 to 10 trades a month. At that pace, it takes a long time to know whether your edge is real or whether you've just been lucky. Backtest data fills that gap before you risk capital.
ChartMath attaches Win Rate and Average Return to every screen. You can see how often a given setup has historically resulted in a profitable trade, and what the average gain looked like when it did. That data is available before you act on a single alert.
A few important caveats apply. ChartMath's backtests use bar-close entries with no look-ahead bias, which is methodologically sound. They do not yet model commissions, slippage, or spread. Real-world results will differ from backtest results, and past performance doesn't guarantee future results. Treat the Win Rate and Average Return as a starting point for evaluating a setup's historical edge, not as a prediction of what your next trade will do. For a full breakdown of how to use backtest data responsibly, see our guide on building winning backtesting strategies.
The contrast with Trade Ideas is instructive. Trade Ideas' Holly AI generates pre-market trade ideas with historical performance data, but that data is tied to Holly's specific intraday strategies. For swing setups on the daily chart, the backtest transparency is thinner. Finviz and TradingView's screeners don't attach per-signal historical performance data at all. You get the signal; you don't get the edge.
Knowing the historical edge on a setup also changes how you size positions. A screen with a high Win Rate and a strong Average Return warrants different sizing than a speculative setup with limited history. That's systematic trading. It's what separates traders who build consistent results from traders who are essentially gambling with extra steps.
How to Switch From Trade Ideas to ChartMath in 3 Steps
The switch is simpler than you might expect. There's no configuration overhead, no scan logic to rebuild, and no learning curve to climb.
Step 1: Browse the Screener and Preview Setups
Before downloading the app, you can preview all 200+ screens at chartmath.com/screens. The web layer is anonymous and read-only, no sign-in required. Browse the screen catalog, see which setups match your trading style, and get a feel for the platform before committing to anything. Screens are organized by setup type, so it's easy to find the ones relevant to swing trading: breakouts, VWAP reclaims, momentum setups, and more. For context on how VWAP-based setups work, our post on VWAP trading is a good primer.
Step 2: Download the App and Favorite Your Screens
Get the iOS or Android app at chartmath.com/app. Once you're in, open the Screener tab and browse the full screen library. Tap the star on any screen that matches your strategy to favorite it. Favoriting a screen does two things: it pins that screen to your Discover feed so you see matching setups first, and it enables screen-enter alerts so you get a push notification when a stock enters that screen.
Step 3: Build Your Watchlist and Let Alerts Work for You
Under the Search tab, add the tickers you're already tracking to your watchlist. ChartMath runs all 200+ screens against your watchlist tickers continuously, so when a stock you're watching enters a setup you care about, you get an alert. From that point, your job is to review the alert, check the Win Rate and Average Return on the screen, look at the chart in your preferred charting tool, and decide whether to act. ChartMath is the discovery layer. You execute in your own broker. For a complete workflow that integrates this kind of alert system into a daily routine, see our post on building an efficient trading workflow.
The whole setup takes under 15 minutes. There's no Pine Script to write, no scan logic to configure, and no subscription to justify before you've seen a single result.
Frequently Asked Questions
How much does ChartMath cost?
ChartMath starts with a 14-day free trial — every screen, every backtest, and every alert included, no card required to start. After the trial, founding pricing is $24.99/mo (locked for your first 12 months) or $149/yr.
Does ChartMath cover crypto and futures, not just stocks?
Yes. The universe is 500+ US equities, 100 crypto pairs, and 11 US futures, across all 7 timeframes. US equities are the primary focus, but crypto and futures coverage is live and real. If you trade Bitcoin, Ethereum, or US futures contracts alongside your equity swing trades, ChartMath covers those too.
Can I build my own screens in ChartMath?
No, and that's intentional. ChartMath's 200+ screens are curated and read-only. There's no screen builder. The tradeoff is that you get 200+ pre-validated setups with documented Win Rates and Average Returns, ready to use immediately, without writing a line of code. If you want to build custom scans from scratch, TradingView with Pine Script is the right tool for that job. ChartMath is for traders who want proven setups without the configuration overhead.
How is ChartMath different from Trade Ideas for swing trading specifically?
Trade Ideas is built for intraday day trading: real-time sub-second scanning, AI-generated pre-market plays, and a desktop-first workflow. ChartMath is built for swing traders with day jobs: mobile-first push alerts, daily and weekly timeframe coverage, backtested Win Rate and Average Return on every screen, and a curated universe that keeps signal quality high. The price difference is also significant: Trade Ideas runs around $118 per month; ChartMath starts at $24.99/mo (founding) after a 14-day free trial.
Does ChartMath place trades automatically?
No. ChartMath is a copilot, not an autopilot. It surfaces setups, explains why they triggered, and shows you the historical edge. You decide whether to act, and you execute in your own brokerage. There is no broker connection and no order placement in the app.
The right scanner for a swing trader with a day job isn't the most powerful one. It's the one that fits your schedule, explains its signals, and shows you the historical edge before you risk a dollar.
The Bottom Line
Trade Ideas is a serious tool for serious day traders. If you're at your desk from open to close and you need the most powerful real-time intraday scanner available, it earns its price. But if you're a swing trader with a day job, you're paying for a platform built around a workflow you don't have, while the features you actually need, mobile alerts, backtest transparency, daily-chart coverage, and plain-English signal explanations, are either missing or buried.
The best Trade Ideas alternative for swing traders isn't a cheaper version of Trade Ideas. It's a tool built from the ground up for a different kind of trader. ChartMath scans 500+ US equities, 100 crypto pairs, and 11 US futures across 200+ curated technical screens, pushes explainable alerts to your phone the moment a setup forms, and shows you the Win Rate and Average Return on every screen before you act. No Pine Script. No coding. No $118 monthly bill.
If you've been using Trade Ideas and wondering why it doesn't quite fit, or if you've been piecing together TradingView and Finviz and still missing entries while you're at work, this is the gap those tools leave open. Browse the full screen library at chartmath.com/screens to see what's available, then download the app and set up your first alerts in under 15 minutes. Every screen, every backtest, every alert, on a 14-day free trial, no card required.

Ankush Jindal
LinkedInSee these setups live in ChartMath
200+ curated screens with backtest data. 14-day free trial.