The Complete Buyer’s Guide to Trading Tools in 2026
Your lunch break is 40 minutes. You've got a charting tab open, a screener tab open, a Discord you half-trust, and a spreadsheet you haven't updated since March. That's not a trading tools stack, that's five separate jobs pretending to be one habit. This guide breaks trading tools down by the actual job each one does, charting, discovery, alerting, backtesting, journaling, and execution, so you can buy what you'll use instead of what looked good in a YouTube review.
Key Takeaways
- Six jobs, not six brands: a full trading tools stack covers charting, discovery/screening, alerting, backtesting, journaling, and execution. Some platforms do one job well, some do two or three.
- Buy for your actual hours: a full-time desktop day trader and a swing trader with a day job need different tools even if they're trading the same tickers.
- Recomputable beats a screenshot: a win rate you can trace back to a stated rule and sample size is worth more than a number someone posted once and never showed again.
- Coding is a cost, not a feature: Pine Script and custom screen builders are powerful, but only if you have hours to spend maintaining them. Most swing traders don't.
- ChartMath covers two of the six jobs honestly: discovery and backtesting, across 200+ deterministic screens on 500+ US equities, each with a win rate you can recompute. It's free, no credit card required, and it isn't trying to replace your charting platform or broker.
Trading Tools at a Glance
| Job | What "good" looks like | Check before you pay | Common trap |
|---|---|---|---|
| Charting | Clean price action, multiple timeframes, mobile parity | Indicator depth, chart load speed on mobile | Paying for a full suite when you only need confirmation |
| Discovery/Screening | Stated universe, plain-English match reason | Can you name the universe out loud? | A ticker list with no reasoning attached |
| Alerting | Push the instant a setup triggers | De-duplication, quiet hours, delivery channel | Alert fatigue from unfiltered noise |
| Backtesting | Win rate and average return tied to a stated rule | Sample size, is the rule recomputable | Trusting a screenshot with no way to verify it |
| Journaling/Review | Structured logs of setup, entry, exit, reason | Does it force you to log the setup name, not just P&L | Logging wins only, skipping the review |
| Execution | Fast order entry, sizing from account risk | Paper orders with stop, target and size pre-filled; you tap to place every one | Tools that place trades for you, or hide why an order was sized that way |
Why Most Trading Tool Stacks Fail Before They Start
It's 12:15 PM. You've got 25 minutes before your next meeting. You open a charting tab to check three tickers you flagged over the weekend. Two of them never moved. The third one is up 6% and you missed the entry three hours ago because nothing told you it happened. This is the actual failure mode for most retail traders, not a lack of tools, a mismatch between the tools you bought and the hours you actually have.
Most trading tool marketing sells you on features: more indicators, more timeframes, more customization. None of that solves the real problem for someone holding a job. The real question isn't "does this tool do more," it's "does this tool do the specific job I need, in the time I actually have, without me having to babysit it." That's why it helps to stop thinking in brand names and start thinking in jobs. A full trading stack breaks into six: charting, discovery and screening, alerting, backtesting, journaling and review, and execution. Some tools do one job. Some try to do all six and end up doing none of them well.
1. Charting: Where You Read Price and Confirm a Setup
Charting software is where you look at a candle and decide if a setup is real. It's not where you should be finding ideas, that's a different job, but it's where you confirm one before you act on it. Good charting software gives you clean price action, a reasonable indicator library, and multiple timeframes that actually sync when you switch between them.
Before you pay for a charting platform, check three things: does the mobile app load a chart as fast as the desktop version, does it support the timeframes you actually trade (if you're a swing trader, that's likely daily and weekly, not 1-minute), and can you save a layout so you're not rebuilding your indicator stack every session. TradingView remains the default answer here for a reason, its charting is deep and its mobile app is genuinely usable. The common trap is paying for a top-tier charting subscription because you assumed it would also find trades for you. It won't. Charting confirms, it doesn't discover. For more on where VWAP and other overlays fit into that confirmation step, see VWAP Trading: How to Use Volume-Weighted Average Price.
2. Discovery and Screening: Finding Candidates Without Refreshing a Browser Tab
This is the job most traders underestimate and overpay for in the wrong way. Discovery and screening means finding candidates, not confirming ones you already have. A stock scanner or screener's entire value is narrowing a universe of names down to a shortlist worth your 20 minutes.
Good screening starts with a universe you can state out loud. If you can't say "this scans roughly 500 US equities" or "this covers the S&P 1500," you don't actually know what you're not seeing. Good screening also explains why a ticker matched, in plain English, not just "RSI: 28." A number without context forces you to reverse-engineer the logic every single time, which defeats the purpose of automating the search. And good screening runs continuously, so you're not the one triggering the scan by opening an app at 9:29 AM.
Stock scanners that require Pine Script or a custom builder put a fourth requirement on your list: coding time. That's a real cost, not a footnote. If you're indicator-literate but not a coder, and most swing traders with day jobs fall into that camp, a curated, pre-built screen library saves you the hours you'd spend writing and debugging a filter you're not sure works. Concepts like relative volume (RVOL) and VWAP reclaim are common screen logic; the question is whether the tool applies them for you with a stated rule, or leaves you to build the filter from scratch.
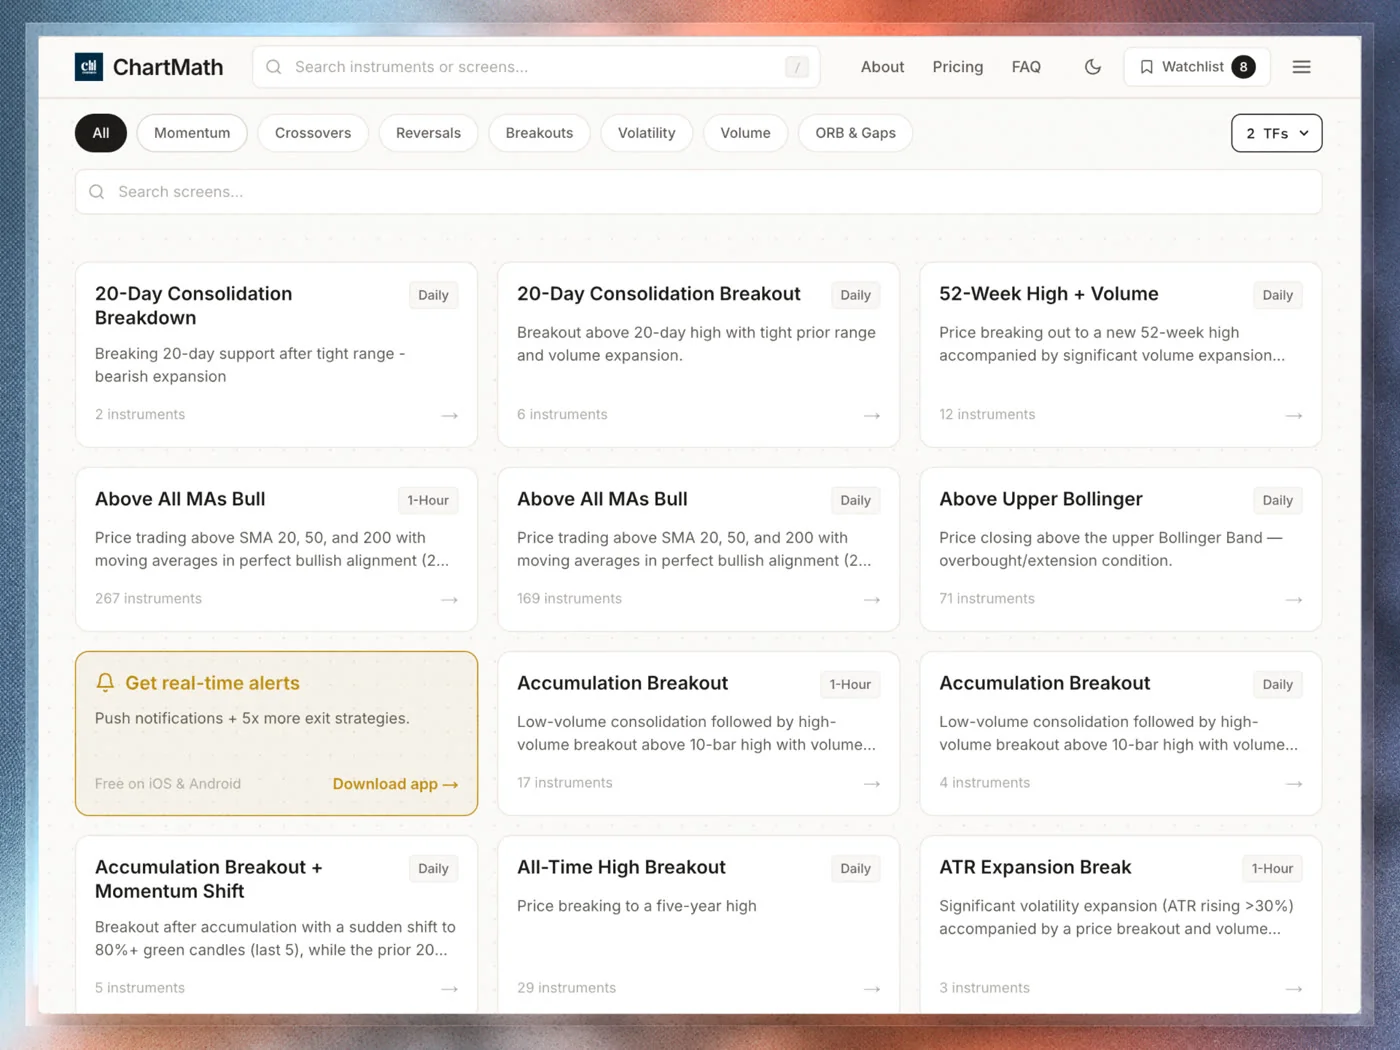
The common trap here is a screener that dumps a list of tickers with a single stat and calls it a day. A list without reasoning is barely better than scrolling Finviz manually, it just moved the guesswork from "which stocks" to "why these stocks." Finviz itself is a solid, free static screener for building filters by hand; it's simply not built to explain a match or push you an alert when one appears.
3. Alerting: Getting Told the Moment It Matters
Alerting is the job that turns a screener from a browser tab you refresh into infrastructure that works while you're in a meeting. Good alerting pushes a notification the instant a setup triggers, not an hour later in a digest email, and not never because you forgot to check.
Before you rely on any alert source, check for alert fatigue controls: de-duplication so the same ticker doesn't ping you five times for one move, throttling so you're not buried during a volatile open, and quiet hours so an overnight move doesn't wake you at 2 AM for a swing position you're holding for days. Also check delivery channel. Push notifications land in seconds; email digests can lag by hours, which matters if the setup is intraday.
Signal groups on Discord and Telegram are the most common alerting substitute traders reach for, and the common trap is treating an unvalidated call as equivalent to a backtested alert. A person calling out a ticker in a group chat isn't wrong to do it, but there's usually no attached track record, no stated sample size, and no way to check if that "setup" has worked more than once. That's a different category of information than an alert tied to a rule you can trace. For a deeper look at filtering out noise before it reaches your phone, see How to Integrate Trading Alerts with Your Charting Platform.
4. Backtesting: The Track Record You Can Recompute
Backtesting is the job that answers the question everyone skips: has this actually worked before, and how often? Good backtesting attaches a win rate and average return to a specific, statable rule, not a vague strategy name. "VWAP reclaim on the 1-hour chart, 64% win rate over the matched sample" is a claim you can check. "This works most of the time" is not.
Before you trust any backtest figure, check the sample size. A win rate built on 12 trades tells you almost nothing; one built on hundreds of matched instances tells you something real. Check whether the rule is deterministic, meaning the same conditions always produce the same signal, which is what makes it recomputable rather than a one-time observation. And check whether the backtest models something close to a real entry, bar-close pricing with no look-ahead bias is the baseline, not a bonus.
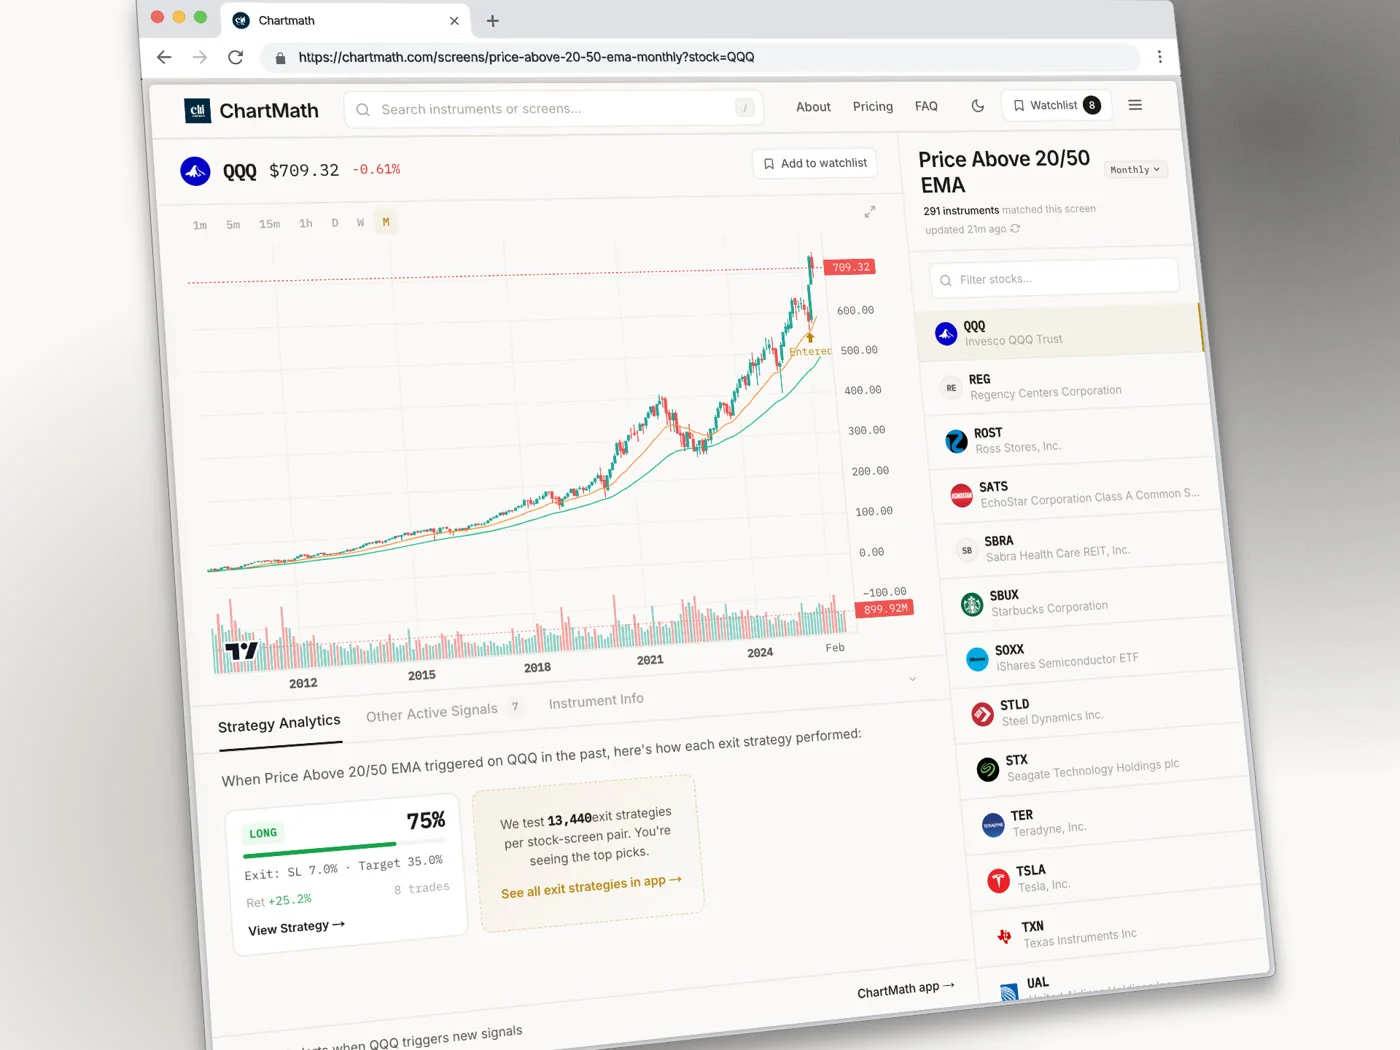
The common trap is trusting a screenshot. A win rate posted once in a group chat or on a landing page, with no way to rerun it yourself, is a claim, not evidence. The whole point of a backtest is that it's reproducible: same rule, same universe, same math, every time you look at it. Building a real backtesting habit means treating every number as something you'd want to verify, not something you take on faith. This is also where reading a trading signal before you risk money starts, understanding what's actually behind the number on the screen.
A track record you can recompute is worth more than one you have to trust. That single test eliminates most of the noise in retail trading tools.
5. Journaling and Weekly Review: Turning Trades Into Data
Journaling is the job most traders skip entirely, and it's the one that determines whether you improve or just repeat the same mistakes with different tickers. Good journaling captures the setup name, the entry reason, the exit reason, and the outcome, not just a running P&L number.
Before you settle on a journaling method, whether that's a dedicated app or a plain spreadsheet, check that it forces you to log the reasoning, not just the result. A trade that worked for the wrong reason and a trade that lost for the right reason both teach you something, but only if you wrote down the reason at the time. Check also whether it's built for a weekly review, not just daily logging. Patterns show up over weeks, not single sessions.
The common trap is journaling wins and skipping losses, or journaling everything and never actually reviewing it. A journal nobody reviews is just a longer way of forgetting. A 20-minute weekly review is enough to catch a repeated sizing mistake or a setup that keeps underperforming its backtested win rate in your hands specifically, which happens more often than traders expect.
6. Execution: Where the Decision Becomes a Trade
Execution is the job of turning a decision into an actual order, at your broker, with the right size and the right stop. Good execution tools make this fast: position sizing calculated from your account risk, not a round number you picked because it felt right, and a stop and target that are set before you click buy, not after.
Before you rely on any execution tool, check that it keeps discovery and execution as separate steps. That separation is a feature, not a limitation. A tool that finds a setup and immediately wants to place the trade for you removes the one step where your judgment matters most, deciding whether this specific instance, on this specific day, is one you actually want to take. That's the difference between a copilot and an autopilot: a copilot narrows the field and explains its reasoning, you still make the call and place the trade yourself in your own brokerage.
The common trap is a tool that blurs discovery and execution into one black box, especially anything marketed as fully automated. Retail trading tools that place trades on your behalf carry a different risk profile entirely, and most swing traders with a day job are better served by a tool that respects the line between "here's a setup worth your attention" and "here's your money going into the market."
How These Six Jobs Fit Together as a Stack
Here's how the flow actually works end to end. Charting gives you the visual context to confirm a setup once you've found one. Discovery and screening narrow a wide universe down to a shortlist worth checking. Alerting tells you the moment a candidate becomes actionable, so you're not the one running the scan manually. Backtesting gives you the confidence, or the reason to pass, based on a recomputable track record. Journaling turns each trade into data you can actually learn from. Execution is where the sized, stopped, targeted order finally goes out.
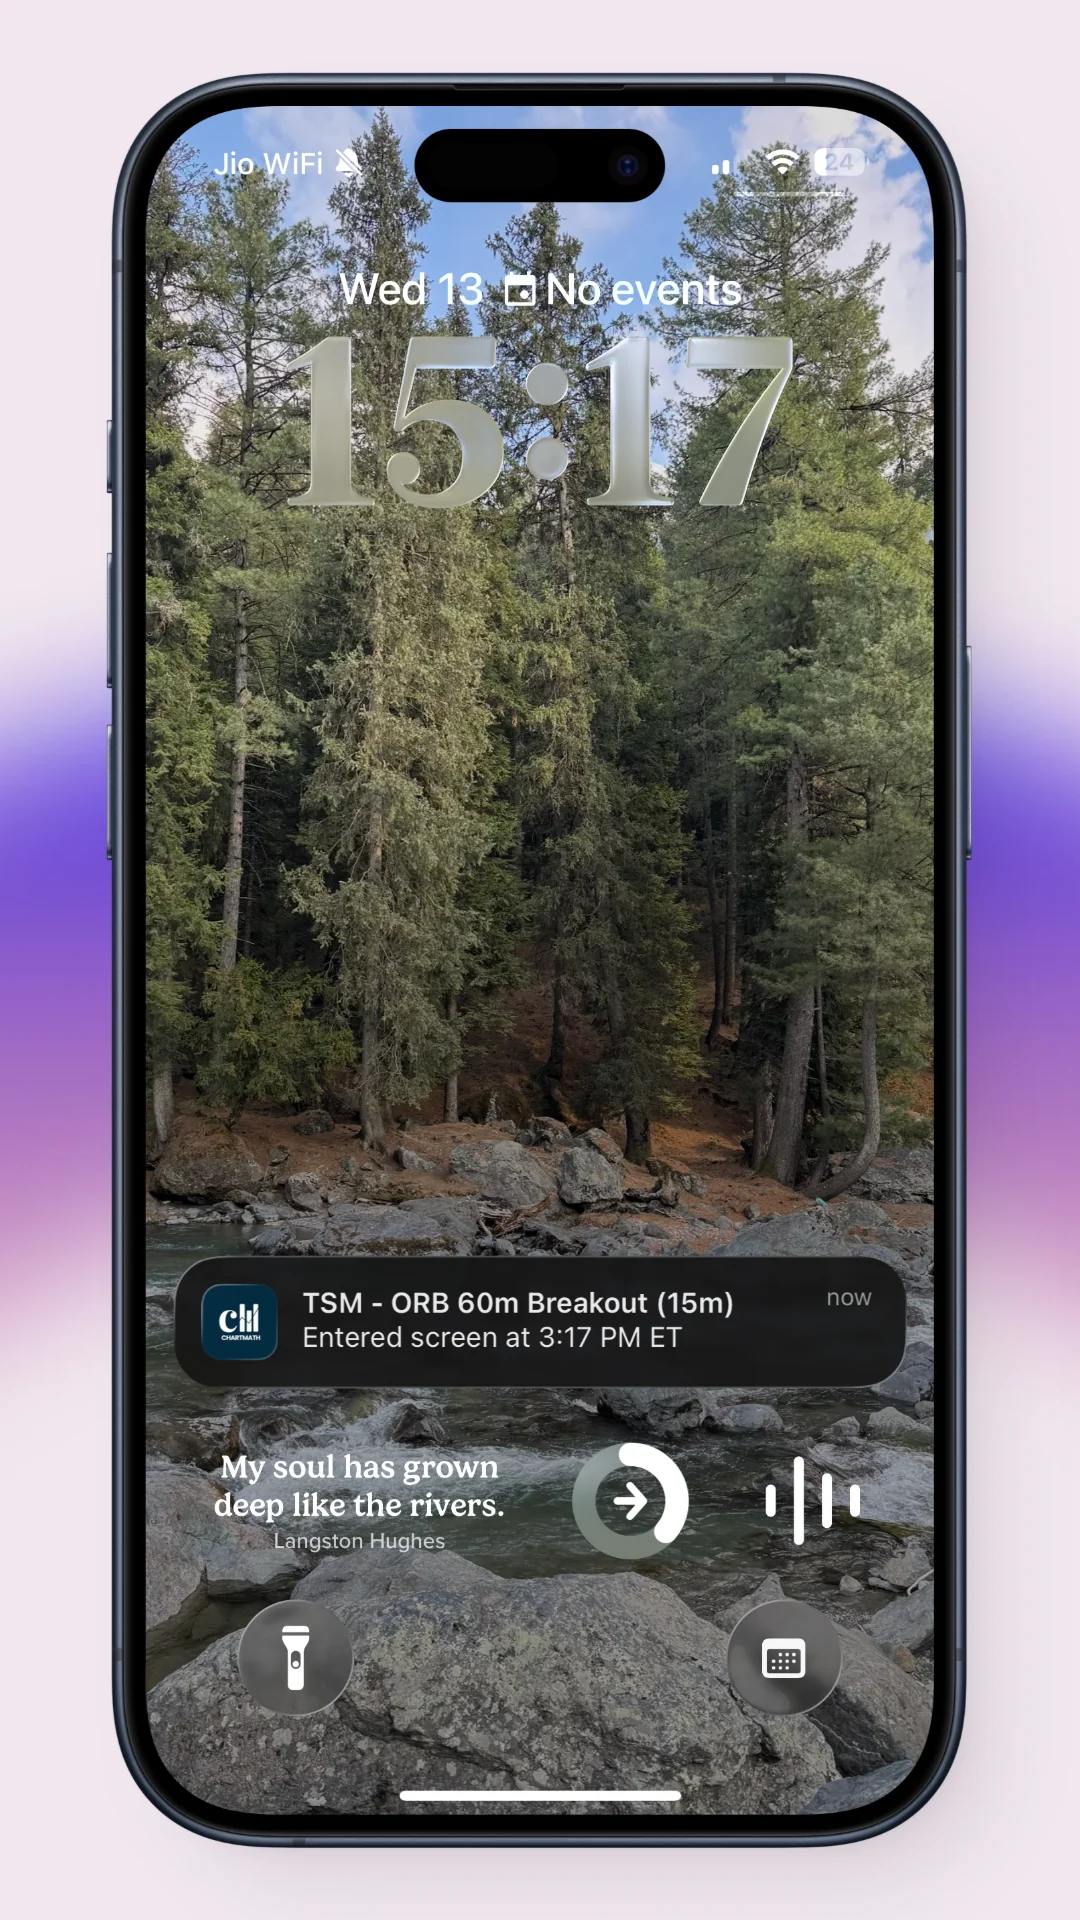
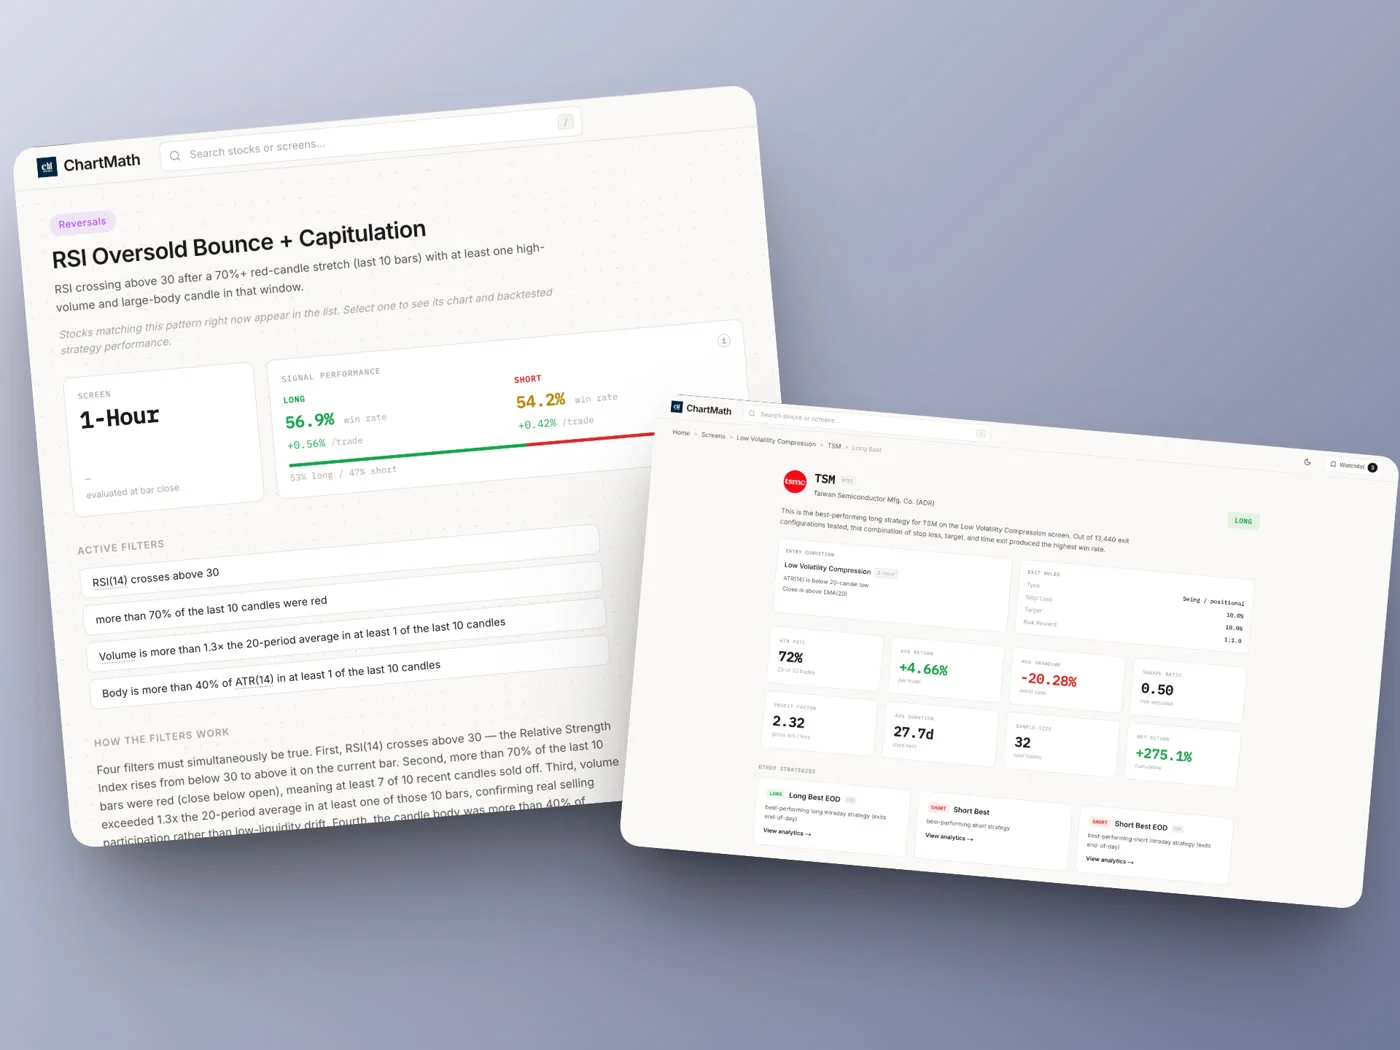
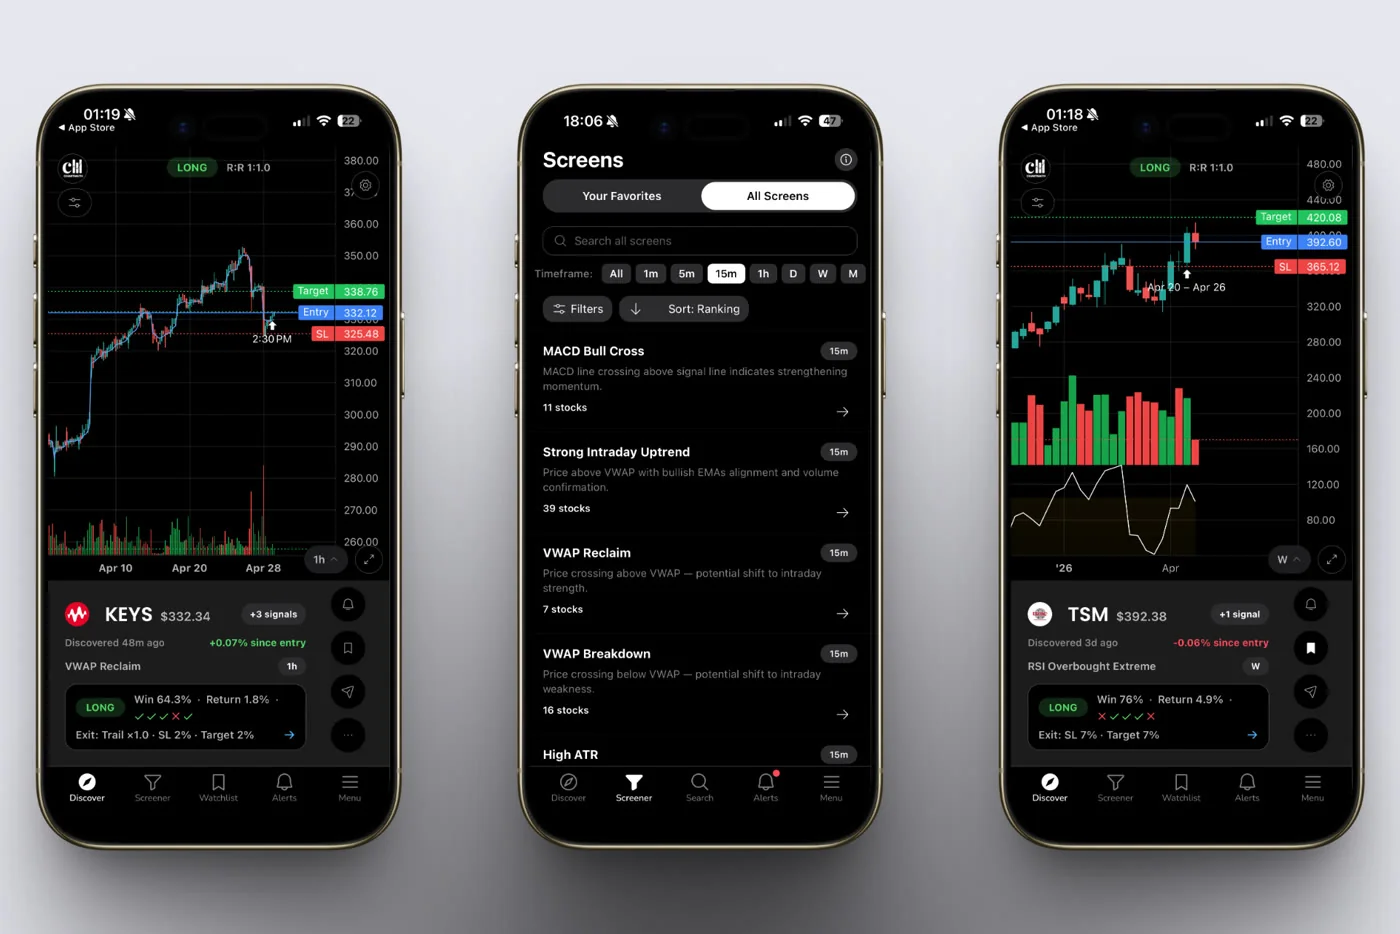
Most traders don't need six separate subscriptions to cover six jobs. Many platforms overlap. TradingView covers charting and some screening. A broker's own platform covers execution and often basic charting. The gap most retail traders actually have is in the middle: discovery paired with a backtest you can trust. That's the specific slot ChartMath occupies, honestly, as one option among several: 200+ deterministic, pre-built technical screens across a stated universe of 500+ US equities, each with a win rate and average return you can recompute against the matched historical sample, delivered as push and email alerts the moment a match happens. It's built for someone trading on days, not minutes, who wants a screener that explains itself rather than a raw ticker list.
It's worth being direct about who ChartMath is not for. If you're a full-time, desk-bound intraday trader who lives in 1-minute charts and needs a fully custom, code-your-own-filter environment with order routing built in, a tool like Trade Ideas or a dedicated desktop scanner with broker integration is the more honest answer for you. ChartMath does include paper trading, so you can place a simulated order with its stop and target pre-filled and follow it in a Portfolio tab. What it does not hand you is a build-your-own screen environment. It's a research layer first: discovery plus backtesting, mobile-first, for someone squeezing trade prep into a commute or a lunch break. Switching between the two categories is a real tradeoff worth understanding before you pay for either.
Which trading platforms have a built-in scanner rather than requiring a separate tool?
A handful of platforms bundle a scanner directly into their charting or brokerage interface, so you're not paying for and switching between separate tools. TradingView has a built-in stock screener alongside its charting, though it leans on you to build and maintain the filters yourself. Finviz combines a free screener with basic charting in one browser tab, but it's static: you refresh it, it doesn't refresh you. Some brokers, like Thinkorswim, bundle a scanner into their desktop platform, which is convenient if you already trade there but ties the tool to that one broker's ecosystem.
The tradeoff with built-in scanners is usually depth versus convenience. A bundled scanner saves you a subscription, but it often lacks a stated win rate behind each filter and won't push a mobile alert the moment a match appears. ChartMath approaches this from the other direction: it's a standalone discovery and backtesting layer that pairs with whatever charting platform or broker you already use, rather than trying to replace them. You can browse the full screen catalog through the web-based screener without installing anything, which is a reasonable way to see what a plain-English, backtested match actually looks like before deciding if it fits your stack.
5 Buying Rules Before You Pay for Any Trading Tool
- Can you state the universe out loud? If you can't describe what the tool scans in one sentence, "500+ US equities" for example, you don't know what it's missing. Vague marketing like "scans the market" is a red flag, not a feature.
- Can you see why something matched, in plain English? A ticker with no reasoning attached is a name on a list. A ticker with "reclaimed VWAP on 1h with volume 2x average" is a decision you can actually evaluate.
- Is there a track record you can recompute? A win rate tied to a stated rule and sample size holds up. A number you can't trace back to anything specific doesn't.
- Does it fit the hours you actually have? A tool built for someone staring at 1-minute charts all day will frustrate a swing trader checking positions at lunch, and vice versa. Buy for your schedule, not an aspirational one.
- Does it require you to code or maintain something? Pine Script and custom builders are genuinely powerful in the right hands. If you don't have hours to spend writing and debugging filters, a curated, pre-built screen library is the more honest fit.
Frequently Asked Questions
Do I need every category of tool, or can one platform cover several jobs?
You rarely need six separate subscriptions. Most traders end up with two or three tools that overlap: a charting platform, a broker for execution, and a discovery/backtesting layer that fills the gap in the middle. The goal is coverage of all six jobs, not six separate logins.
Is a free trading tool ever good enough, or do I need to pay?
It depends entirely on the job, not the price tag. A free tool that states its universe clearly, explains its matches, and shows a recomputable track record can beat a paid tool that doesn't do any of those three things. Cost isn't the criteria that matters, the five buying rules above are.
What's the difference between a scanner and a screener?
In practice the terms overlap. "Screener" often implies a static filter you build and rerun manually, like Finviz. "Scanner" often implies something running continuously and pushing you results, like an alert-driven tool. The label matters less than whether it explains its matches and runs without you babysitting it.
How much time does a full trading tools stack take to run each day?
If your stack is built around alerts rather than manual refreshing, most swing traders spend 15 to 30 minutes a day on it: a quick premarket check, reacting to push alerts during the day, and a short review at night. The stack should reduce screen time, not add to it.
Building Your Stack Without Overpaying
The point of this guide isn't to talk you into one tool. It's to give you a way to evaluate any trading tool against the job it's actually supposed to do, so you stop paying for features you'll never touch and start paying, if you pay at all, for the specific gap in your stack. Charting confirms. Screening discovers. Alerts tell you when. Backtesting tells you if it's worth trusting. Journaling teaches you. Execution gets it done.
ChartMath sits honestly in the discovery and backtesting slot: 200+ pre-built technical screens across 500+ US equities, each with a plain-English reason and a win rate you can recompute against its matched sample, delivered by push and email the moment a setup forms. It's free, no credit card required, and it's a copilot, not an autopilot: it narrows the field, explains itself, and lets you rehearse the setup as a paper order first. You still place every order yourself. If that's the gap in your current stack, you can download the app and see your first screen match today, or watch a quick demo first if you want to see how the alerts and reasoning actually look before installing anything. Either way, stop buying tools for the trader you wish you were, and start buying for the one who has 25 minutes at lunch and needs the reasoning done for them.

Ankush Jindal
LinkedInSee these setups live in ChartMath
200+ curated screens with backtest data. Free. No credit card required.