Pattern Recognition in Trading: How Scanners Find Setups
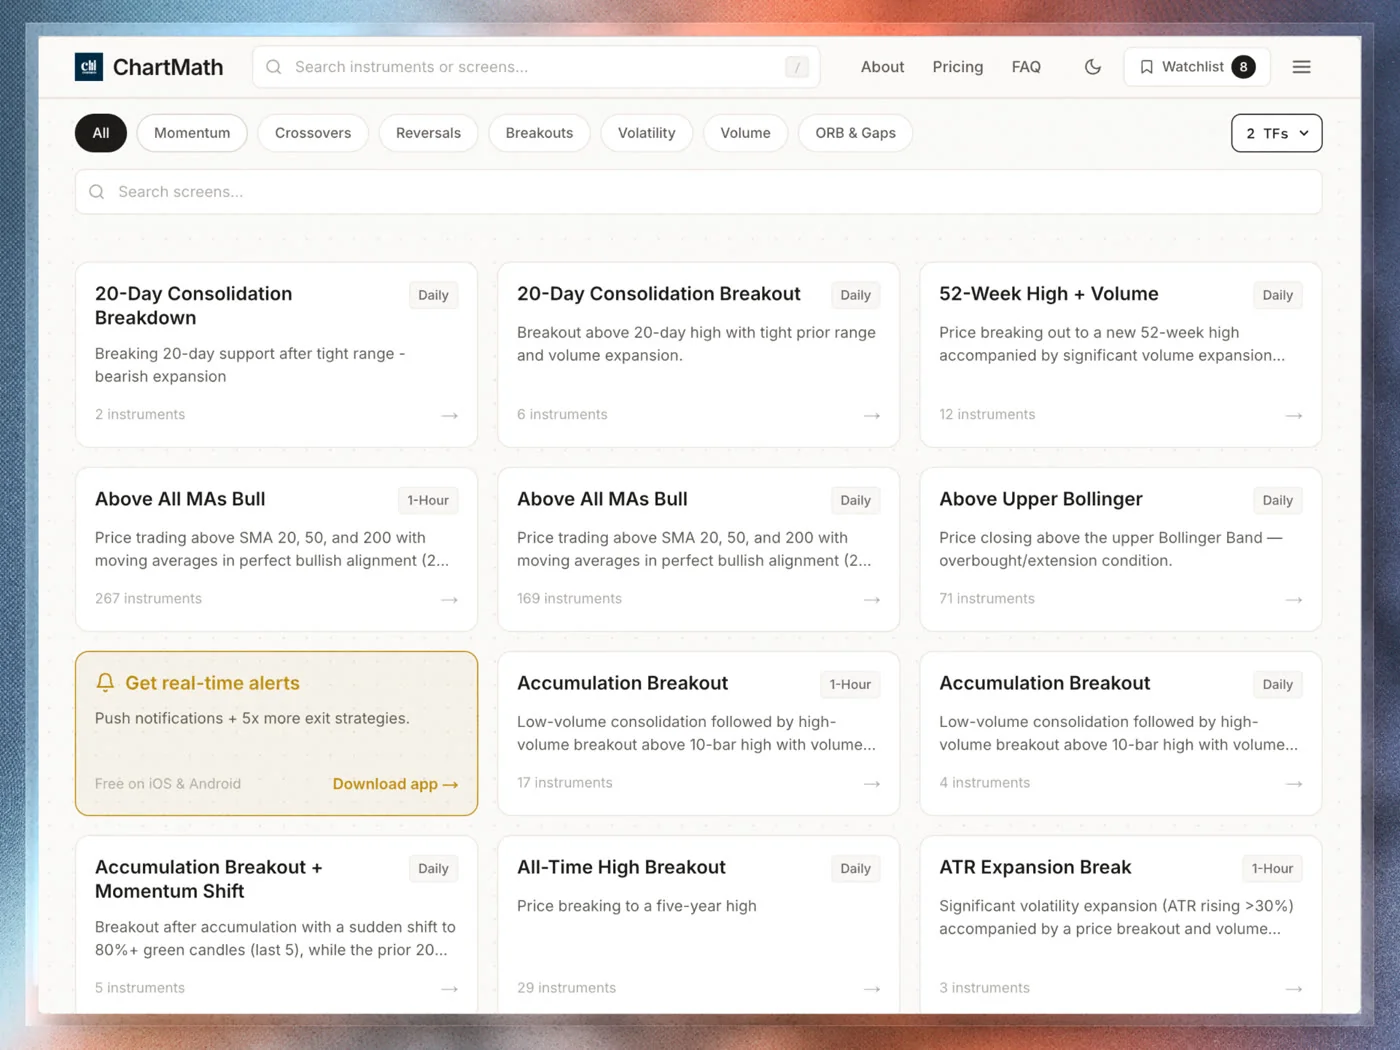
A universe of 500+ US equities across seven timeframes is a few thousand chart-timeframe combinations, and it refreshes every session. Nobody with a job opens those by hand, so setups get found by accident, three days late, or not at all. That gap between what a chart is doing and what you can actually see is exactly what pattern recognition software closes: a deterministic rule watches the universe so a human doesn't have to scan it one by one.
Key Takeaways
- Scale is the real problem: a bounded universe of 500+ US equities across 7 timeframes creates thousands of chart-timeframe combinations, far more than one person can check in a trading day.
- Deterministic beats discretionary: a fixed screen rule produces a track record that can be recomputed on demand, unlike a gut call or a Discord tip.
- Win Rate and Avg. Return, never "accuracy": those are the two metrics that matter when judging whether a pattern has held up historically, and sample size decides how much to trust them.
- Alerts close the timing gap: push and email notifications carry the ticker, the screen, and a plain-English reason, so you find out when the pattern fires, not hours later.
- Copilot, not autopilot: the screener narrows 500+ names down to a shortlist; you still read the chart and tap to place every trade.
At a Glance: Pattern Recognition Approaches Compared
| Approach | Coverage | Speed to alert | Documented edge? | Explains "why"? |
|---|---|---|---|---|
| Manual charting | 10-20 tickers realistically | Minutes to hours (if you're watching) | No, based on memory | You, but subject to bias |
| Discord/Telegram signal groups | Whatever the group posts | Variable, human-dependent | Rarely, often unverifiable | Rarely |
| Static screener (Finviz-style) | Broad, but a snapshot | Only when you refresh | No built-in backtest | No |
| Charting platform screener (TradingView-style) | Broad, needs Pine Script for custom logic | Depends on setup and coding | Not attached per signal | No, unless you build it |
| Deterministic backtested scanner (ChartMath-style) | 500+ US equities, 7 timeframes | Real time, push + email | Yes, Win Rate + Avg. Return per screen | Yes, plain-English reason on the card |
Why Manual Pattern Recognition Breaks Down at Scale
Do the arithmetic. A universe of 500+ US equities across 7 timeframes (1m, 5m, 15m, 1h, Daily, Weekly, Monthly) means thousands of chart views could theoretically be relevant on any given day. Nobody with a full-time job is opening 3,500 charts before lunch. Most traders narrow this down to a personal watchlist of 15 to 30 names and hope the setups they care about happen to line up while they're actually looking.
That's not a discipline problem. It's an attention problem. Human eyes get tired, get anchored on the last winning trade, and start seeing patterns that confirm what they already believe. A gut-driven approach works fine on a handful of names you know well, but it collapses the moment you try to widen your scope past what one person can hold in working memory during market hours.
It helps to be precise about what a "pattern" actually is here. Momentum indicators like VWAP, relative volume, and moving averages aren't noise layered on top of a chart. They're derived directly from price and volume, the same raw data a discretionary trader is already looking at, just organized into a rule a computer can check thousands of times a minute instead of once every few hours.
1. Deterministic Rules Replace Guesswork
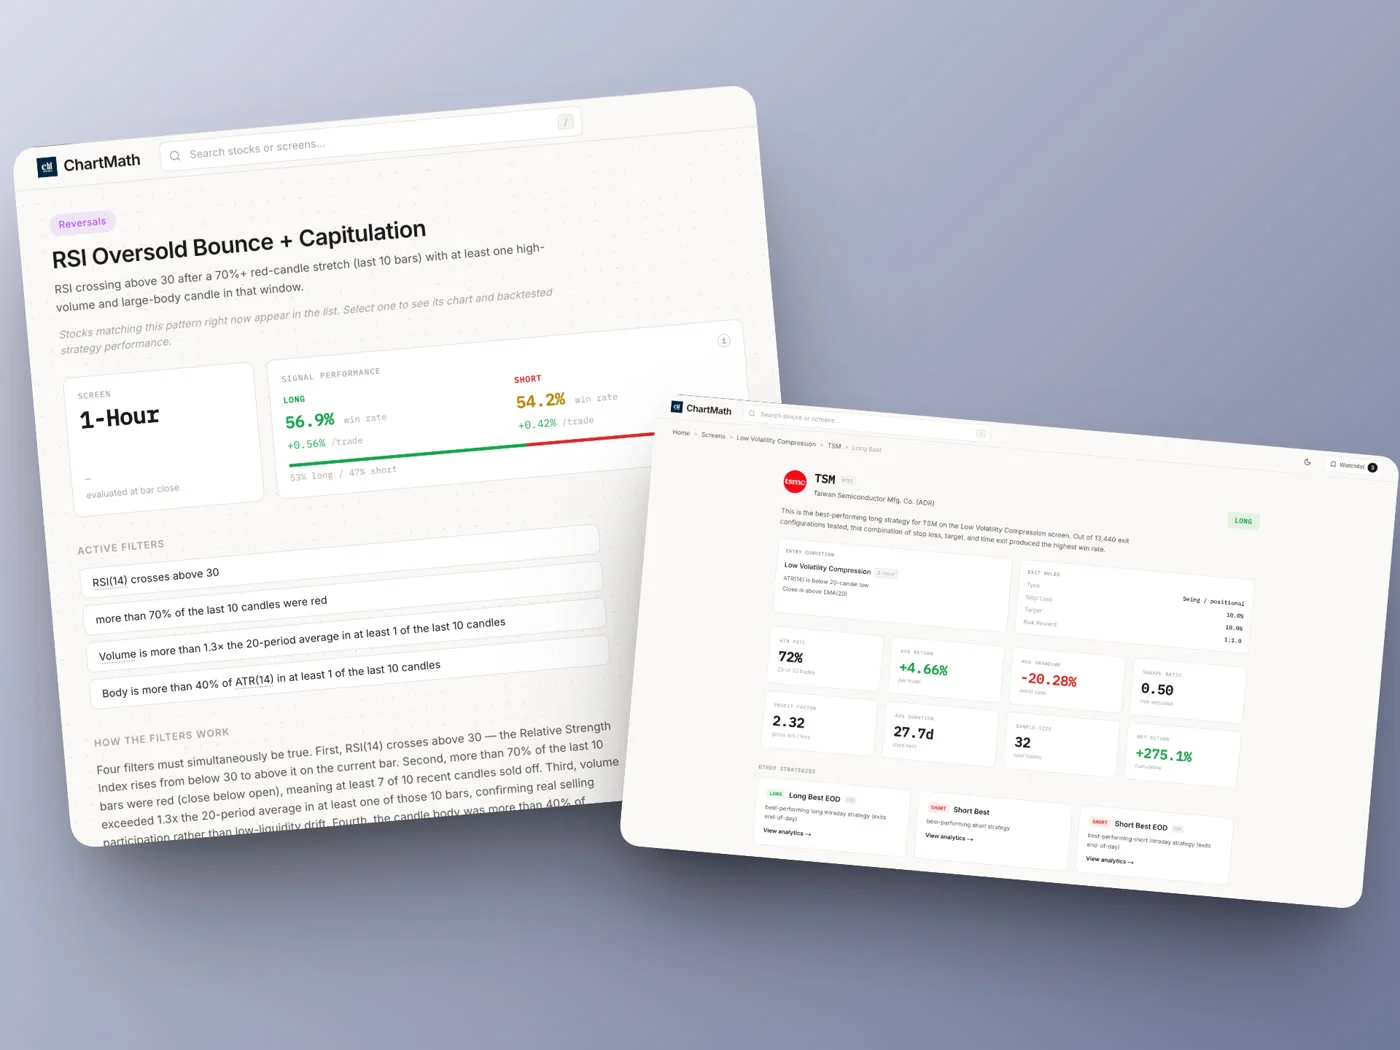
A screen is not a mysterious algorithm making a prediction. It's a fixed rule: if price closes above the 20 and 50 EMA with rising relative volume, flag it. Because the rule never changes, its historical performance can be recomputed against past data at any time. That's a meaningfully different claim than "trust me, this pattern works," which is what most signal groups and gut-feel setups are really asking you to accept.
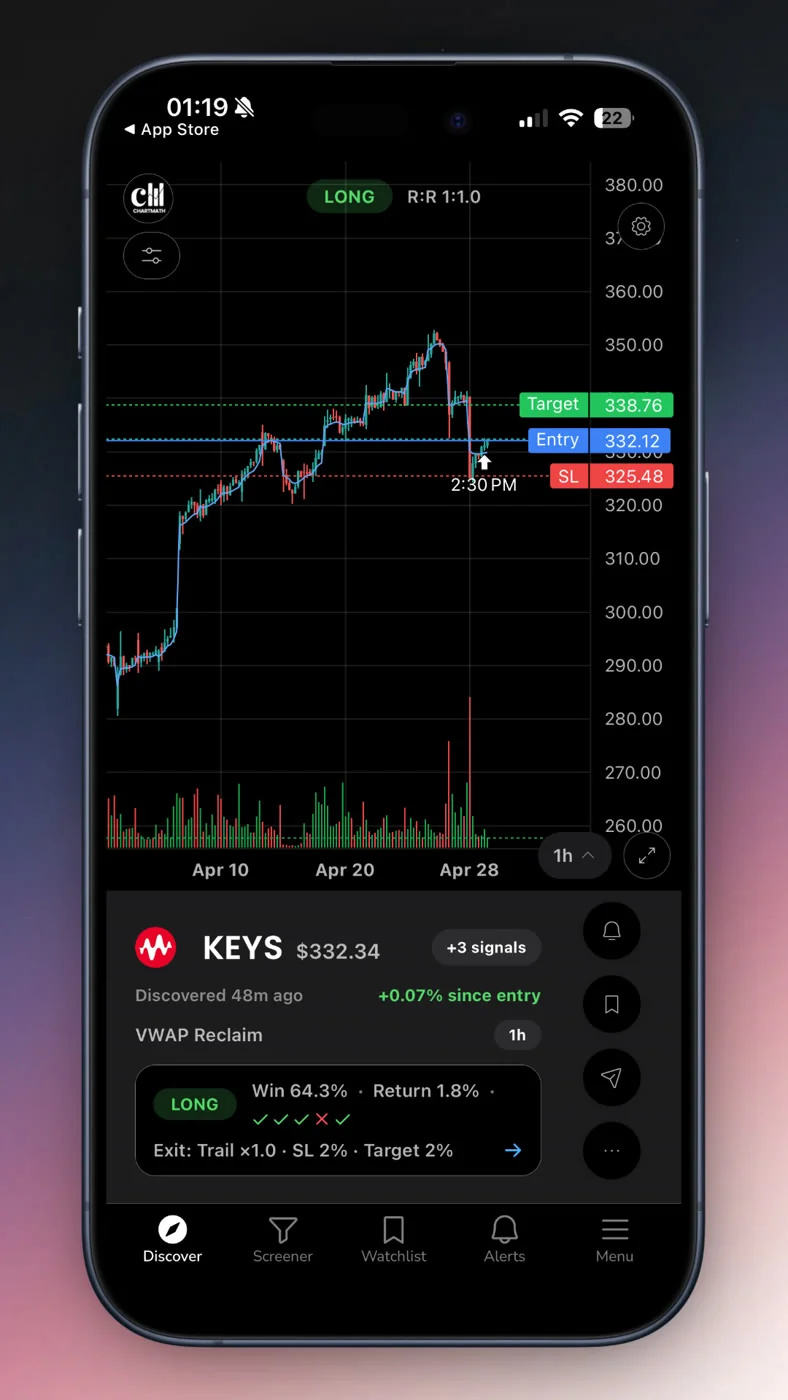
Take the Consistent Uptrend screen as an example. It's a fixed definition of trend persistence. Run it against NVDA's price history and you get a specific matched sample with a specific win rate and average return over that sample, numbers anyone can check by re-running the same rule. Compare that to a screen like VWAP Reclaim, built around price recovering above the volume-weighted average price on an hourly timeframe. Same principle: fixed logic, recomputable history, no black box.
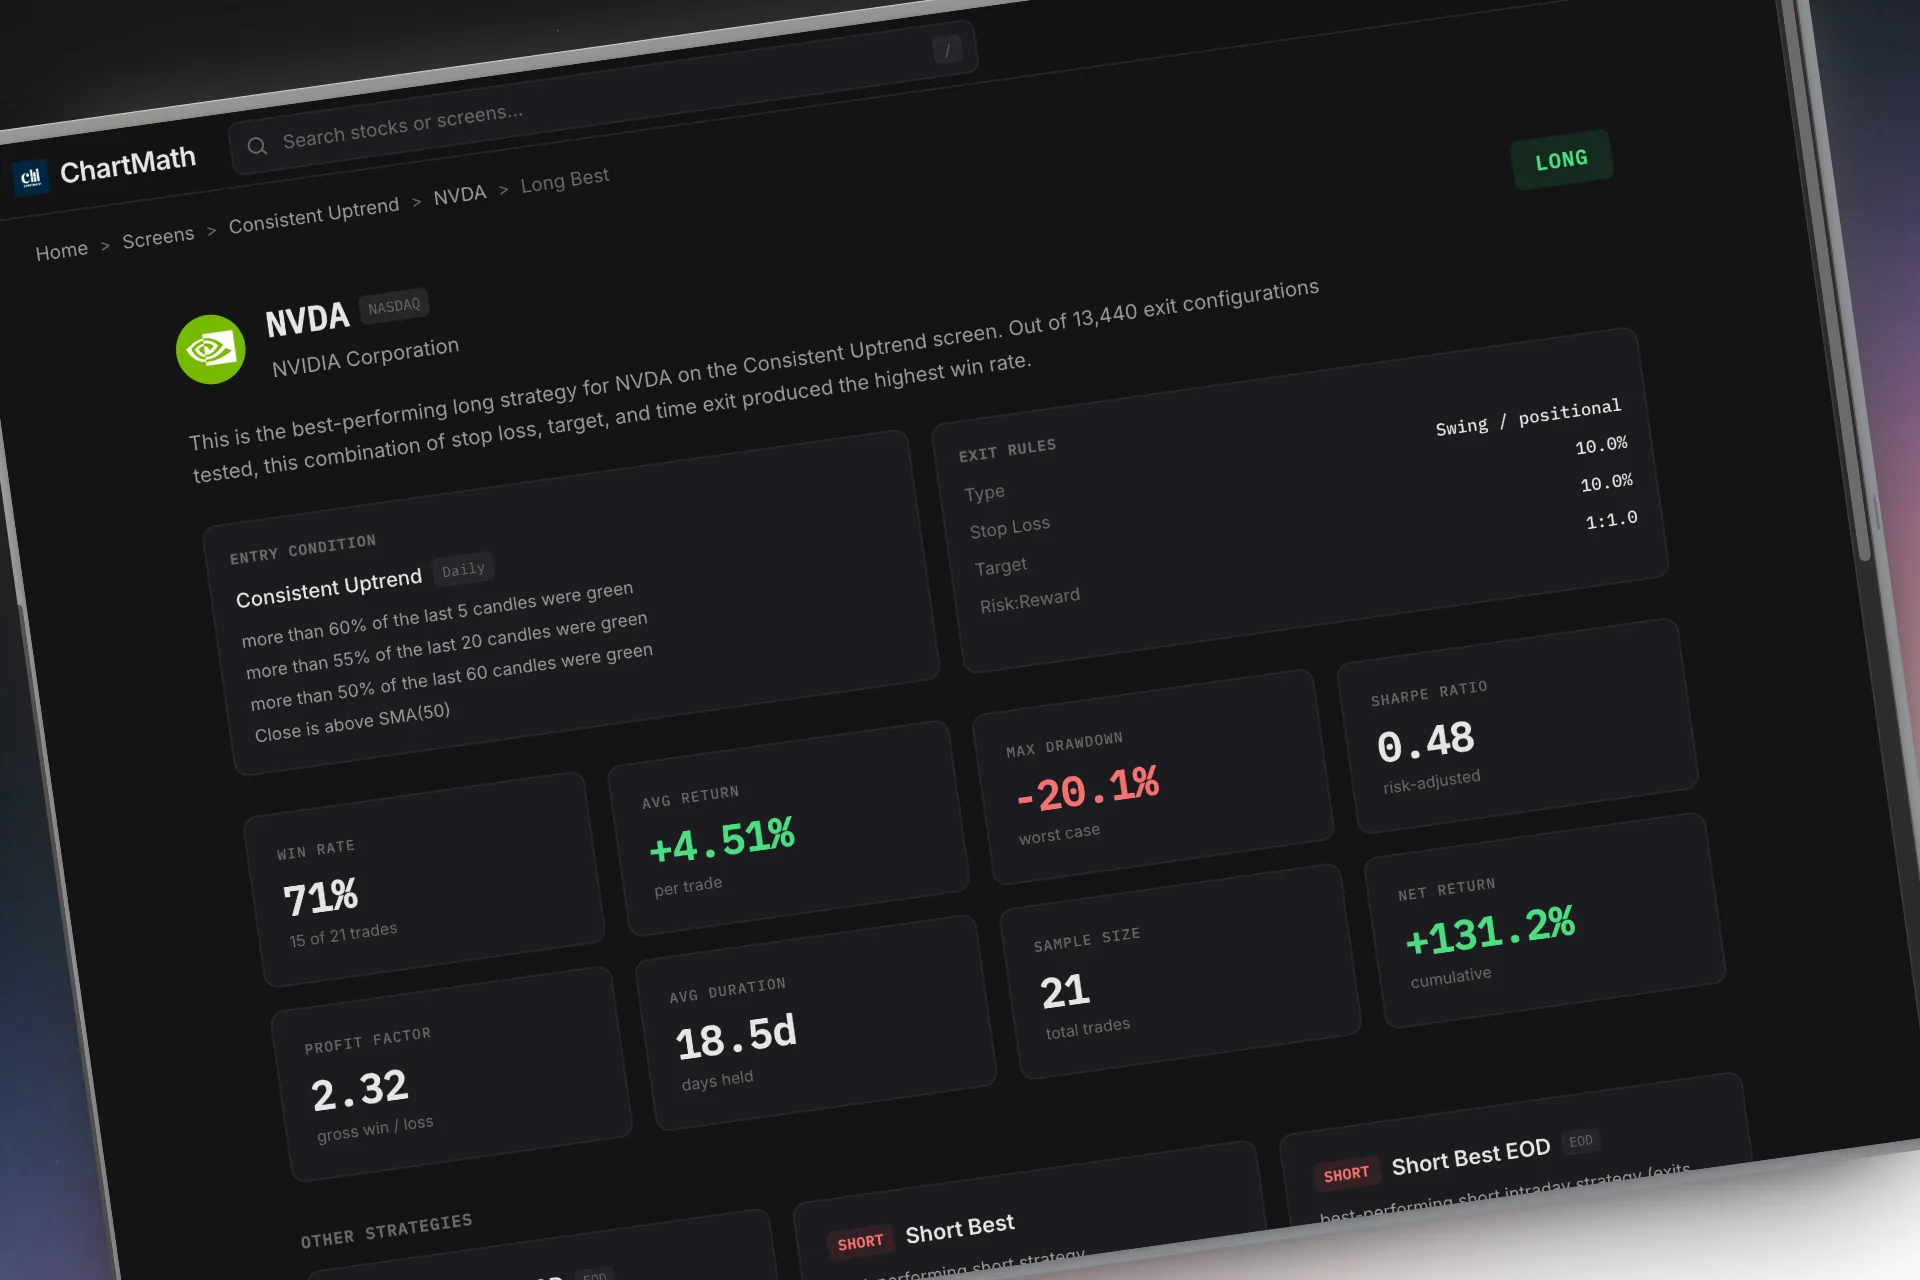
This is the core difference between a research-grade screener and a static filter. A stock scanner that just lists tickers matching a filter tells you what's happening now. A deterministic, backtested screen tells you what's happened historically every time that exact condition occurred, which is a very different kind of information to trade on.
2. The Chart Patterns Momentum Traders Lean On in 2026
Not every pattern deserves equal attention. Four families keep showing up in swing traders' actual playbooks this year:
- Opening range breakouts (ORB): price clears the high or low of the first 30 to 60 minutes of the session, often on the 15-minute or 1-hour timeframe, signaling early directional conviction.
- 52-week high breakouts: a stock clearing a full year of resistance tends to attract fresh momentum buyers, particularly when volume confirms the move.
- RSI oversold bounces: a pullback into oversold territory followed by a recovery, useful for entries against short-term exhaustion rather than a falling knife.
- Trend continuation via EMA stacking and VWAP reclaim: price holding above the 20/50 EMA or reclaiming VWAP after a dip, both signs the existing trend is intact rather than reversing.
Each of these has an underlying logic rooted in how buyers and sellers actually behave, not superstition. The 52-week high breakout works because institutional buyers often wait for confirmation before adding size. The RSI oversold bounce works because short-term selling pressure tends to exhaust itself faster than the underlying trend reverses. None of that guarantees a specific outcome on a specific trade, which is why the backtest, not the story, is what should decide whether a pattern earns a spot on your watchlist.
3. How Backtest Data Separates Real Edge From Noise
Here's where a lot of retail tools stop short. A chart can show you that a pattern occurred. It can't tell you, on its own, whether that pattern has historically led anywhere useful. That's the job of a backtest, and it's why the metrics attached to a screen matter more than the pattern's name.
Two numbers do the real work: Win Rate, the percentage of historical matches that closed favorably under the exit rule, and Avg. Return, the average outcome across that same sample. Neither number is "accuracy," a term that implies a forecast. A backtest describes what happened across a fixed historical sample, not a promise about what happens next. You can read a full breakdown of how to interpret this in what backtest win rate actually measures.
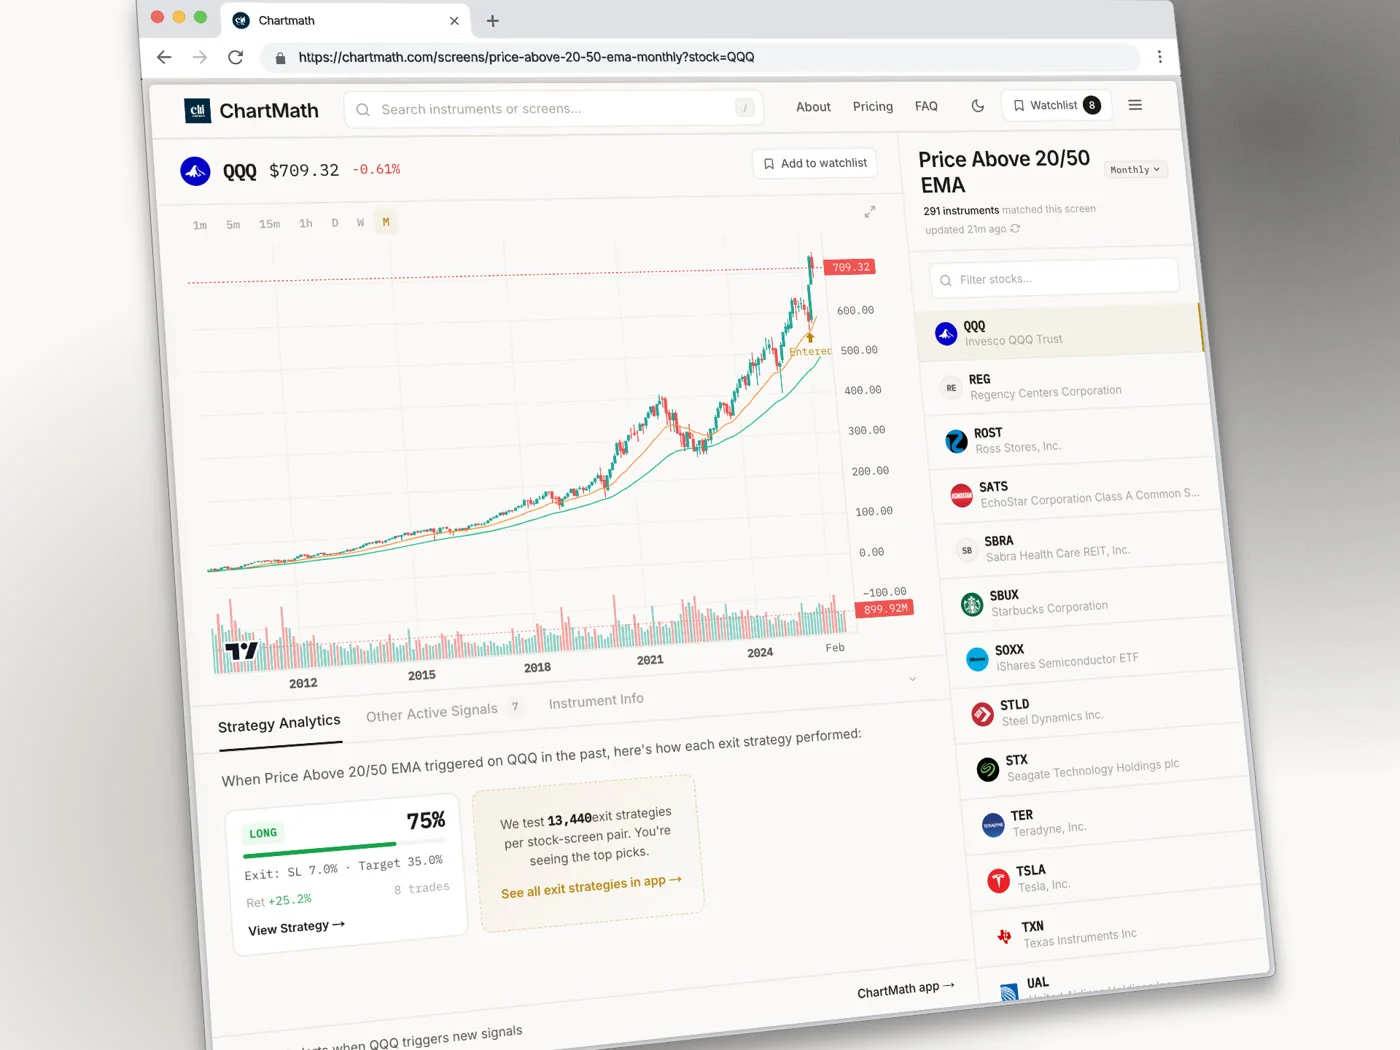
Sample size matters just as much as the headline number. A screen that matched 5 times in two years tells you almost nothing. A screen that matched 200+ times across a multi-year window, like the QQQ example on the Price Above 20/50 EMA screen with 231 matched instruments, gives you something closer to a real statistical base. Before trusting any pattern, ask three questions: how many times has this rule fired, over what time window, and does the exit rule match how you'd actually manage the trade.
4. From Pattern Match to Alert: Closing the Speed Gap
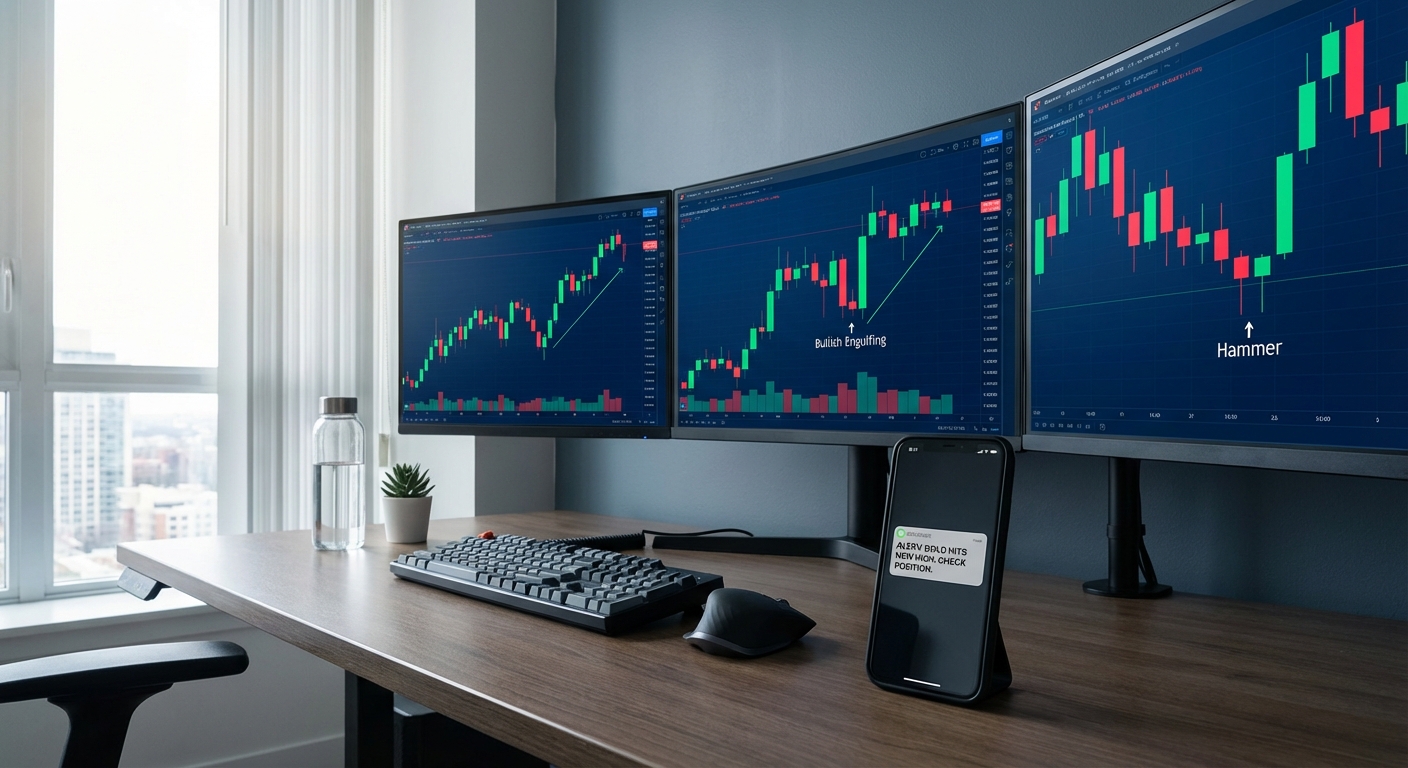
Recognizing a pattern after the fact doesn't help you. The value is in finding out the moment it forms, ideally with enough context to act on it without pulling up five other tabs first. That's the job an alert does that a static screener can't.
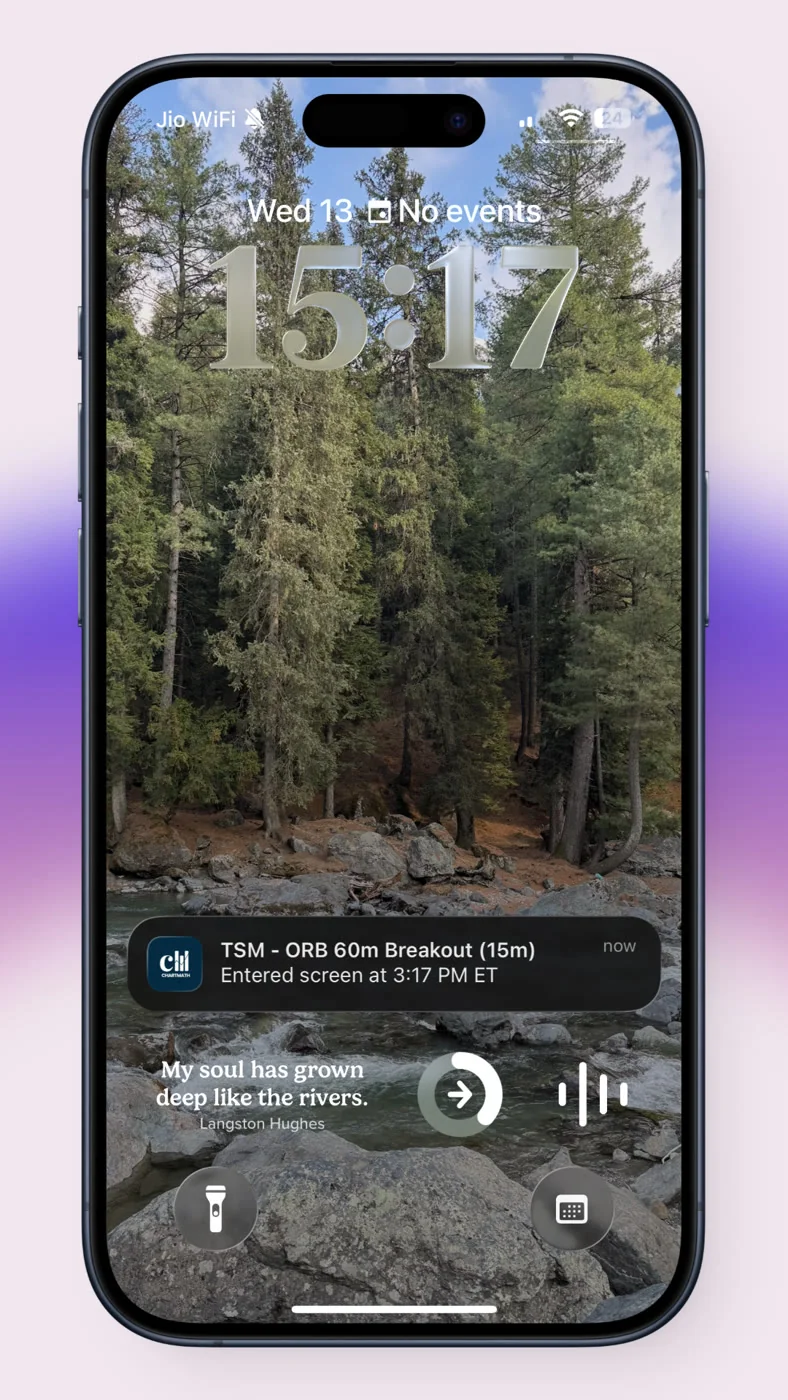
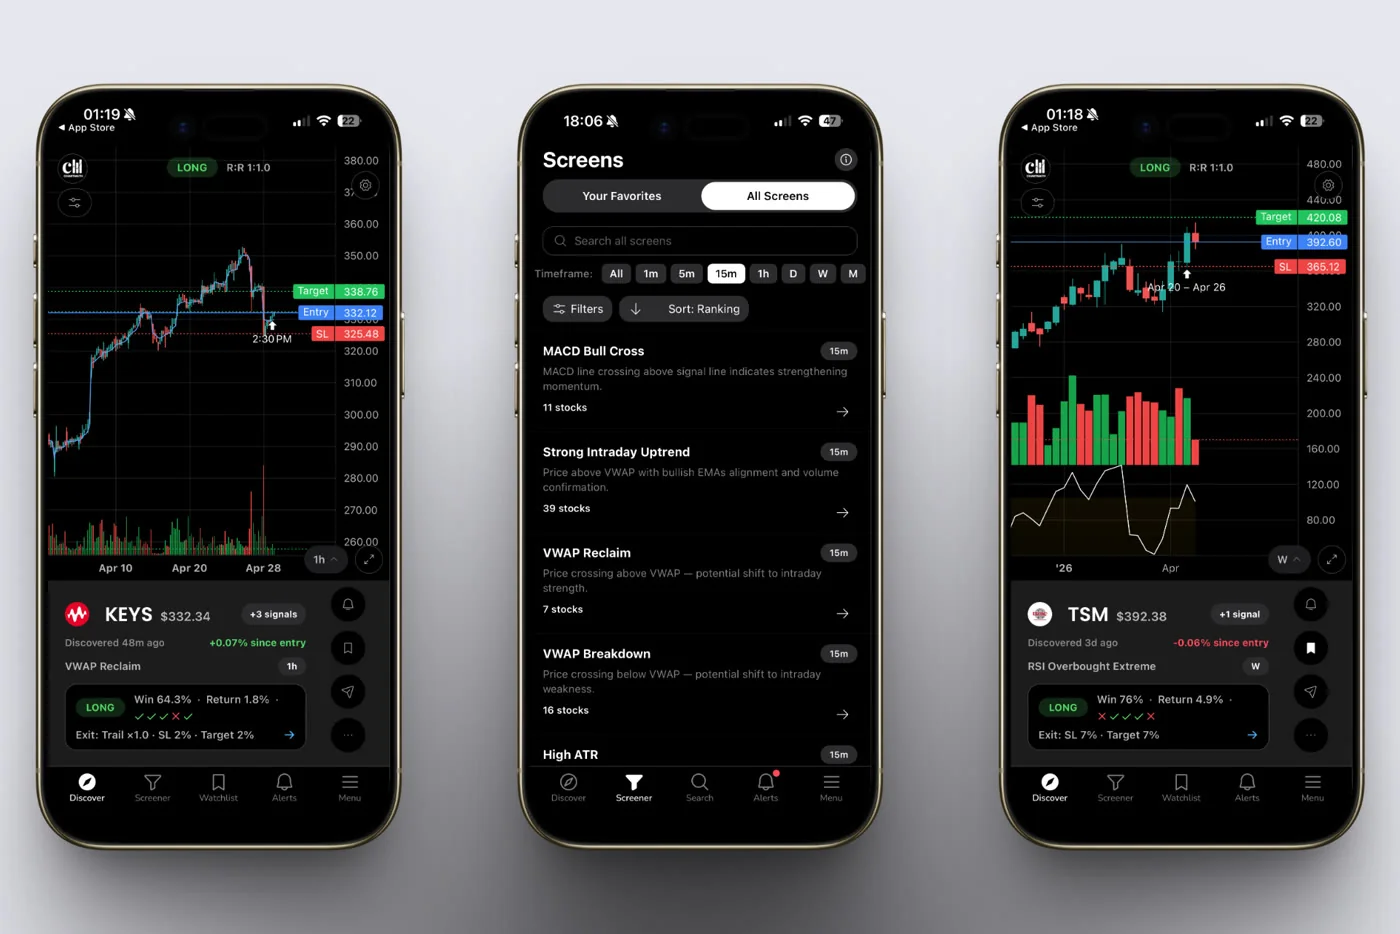
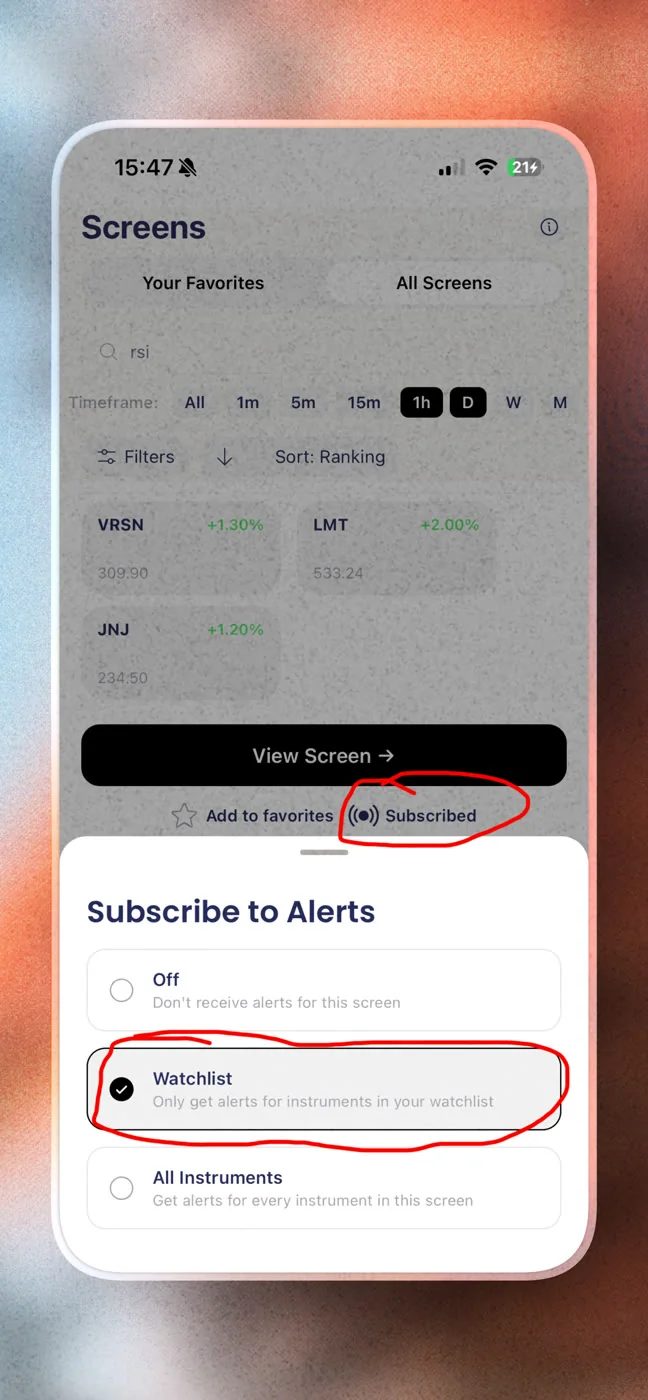
A well-built alert carries the ticker, the screen name, the timeframe, and a plain-English reason it fired, delivered by push notification or email the instant the condition is met. Compare that to a raw price alert, which just tells you a number was crossed with none of the context behind it. If you've felt stock alerts pile up into noise you eventually learn to ignore, that's usually a filtering problem, not an alerting problem. Narrowing alerts to a specific watchlist setup instead of the full universe cuts volume down to the handful of names you actually trade, which is the single biggest fix for alert fatigue.
5. Copilot, Not Autopilot: Where the Machine Stops and You Start
None of this replaces judgment. A deterministic screen narrows 500+ names down to a short list of candidates that match a specific, historically documented condition. It does not decide whether today's broader market context, earnings calendar, or sector rotation makes that setup worth taking right now. That call stays with you.
Think of it as a copilot: it does the scanning work no human has time to do manually, and hands you a shortlist with the reasoning attached. You still read the chart, check the broader context, size the position, and tap to place the order. Nothing places a trade automatically, and nothing should. Paper trading exists specifically to let you rehearse that decision loop, with entry, stop, and target pre-filled and share count computed, tracked in a Portfolio tab, before a single dollar is at risk.
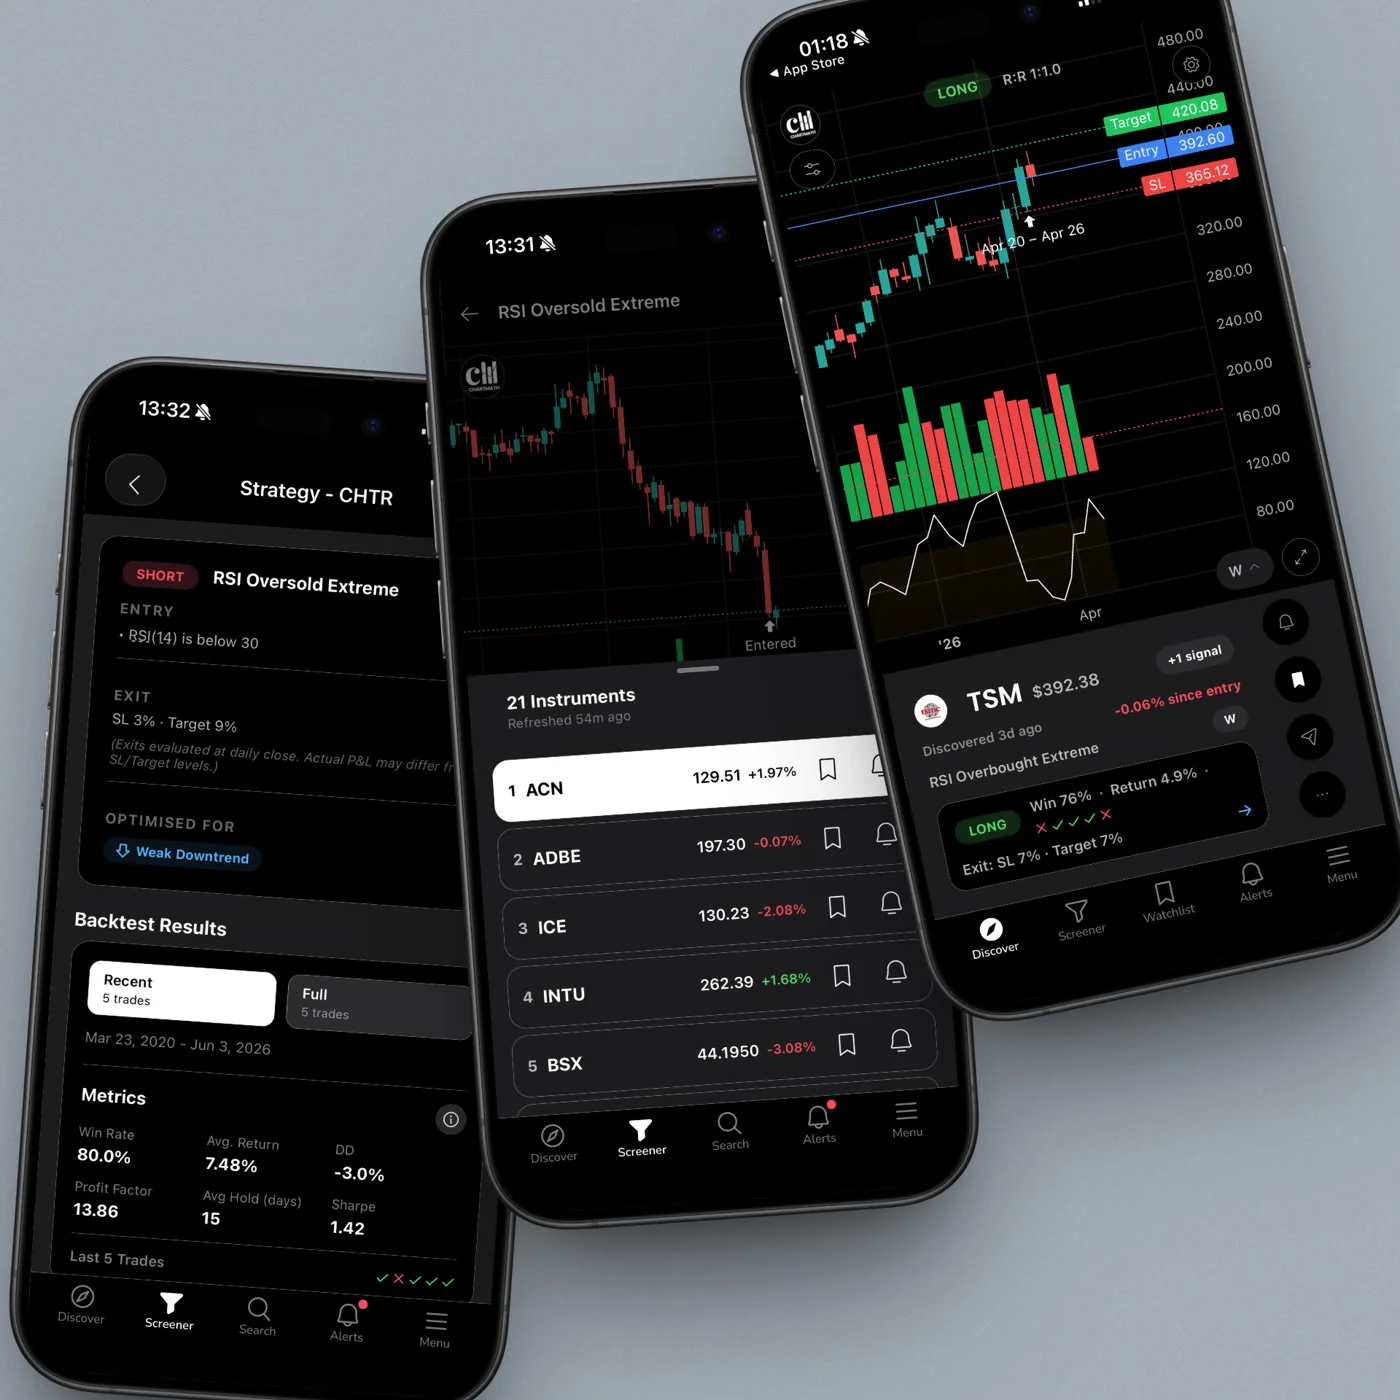
This distinction matters more than it sounds. A tool that claims to trade for you is making a promise it probably can't keep responsibly. A tool that claims to narrow the field so your judgment goes further is making a much smaller, much more honest claim, and it's the one worth trusting.
6. Building Your Own Pattern Recognition Routine
You don't need to rebuild your entire process to use this well. A simple weekly structure works:
- Pick 3 to 5 screens that match your style. A day-job trader holding positions for days probably leans on daily and weekly trend and breakout screens over 1-minute scalping setups.
- Build a focused watchlist. Start with 15 to 25 tickers you already know, not the entire universe. This is the single biggest lever for cutting alert fatigue.
- Set your alert cadence. Decide whether you want alerts on every screen match or only on favorited screens, and choose push versus email based on how your workday is structured.
- Check the backtest before you act. Every alert should carry a Win Rate, Avg. Return, and sample size. If a pattern's sample is thin, treat the signal as informational, not actionable.
- Review weekly, not daily. Look at which screens actually produced trades worth taking versus noise, and prune your watchlist and screen list accordingly.
This routine fits comfortably around a full-time job. It's the same structure covered in more depth in swing trading with a full-time job and entry timing for conviction stocks you own, both worth reading if you're still figuring out where scanning fits into a workday that doesn't leave room for staring at charts.
Recap: What Changes When Pattern Recognition Is Automated
The pattern itself, a breakout, a bounce, a trend continuation, hasn't changed. What's changed is who's doing the watching. A deterministic screen checks a fixed rule against 500+ tickers continuously instead of you checking 15 tickers occasionally. It attaches a recomputable Win Rate and Avg. Return instead of a story about why it should work. And it delivers the match as a push alert with a plain-English reason instead of leaving you to notice it hours later, if at all. The judgment call, whether today's setup is worth taking, stays exactly where it's always been: with you.
FAQ
Is pattern recognition software accurate?
"Accurate" isn't quite the right frame. A backtested screen reports a Win Rate and Avg. Return over its historical matched sample, a description of the past, not a forecast of the future. The larger the sample size, the more weight that history deserves, but no screen guarantees a specific outcome on the next trade.
Does automated pattern recognition replace technical analysis skill?
No. It narrows a large universe down to a shortlist of candidates matching a specific rule. Reading the broader chart context, deciding position size, and choosing whether to actually take the trade all still require the trader's own technical analysis judgment.
What timeframes work best for pattern recognition scanning?
It depends on your schedule, not a universal best answer. Traders holding positions for days often lean on daily and weekly screens for the primary trend and hourly screens for entry timing, while intraday traders lean on 5-minute and 15-minute setups like opening range breakouts.
If you've been manually scrolling through the same 20 charts every lunch break hoping something lines up, it's worth seeing what happens when a rule does that scanning for you instead. You can see how a screen match turns into an alert, browse the full web-based screener to see the 200+ backtested rules behind the alerts, or go straight to the ChartMath app and run these screens against your own watchlist today. The pattern still needs your judgment. Let the scanning be the part you stop doing by hand.

See these setups live in ChartMath
200+ curated screens with backtest data. Free. No credit card required.