Watchlist Alerts for Swing Trades That Fire at the Right Time

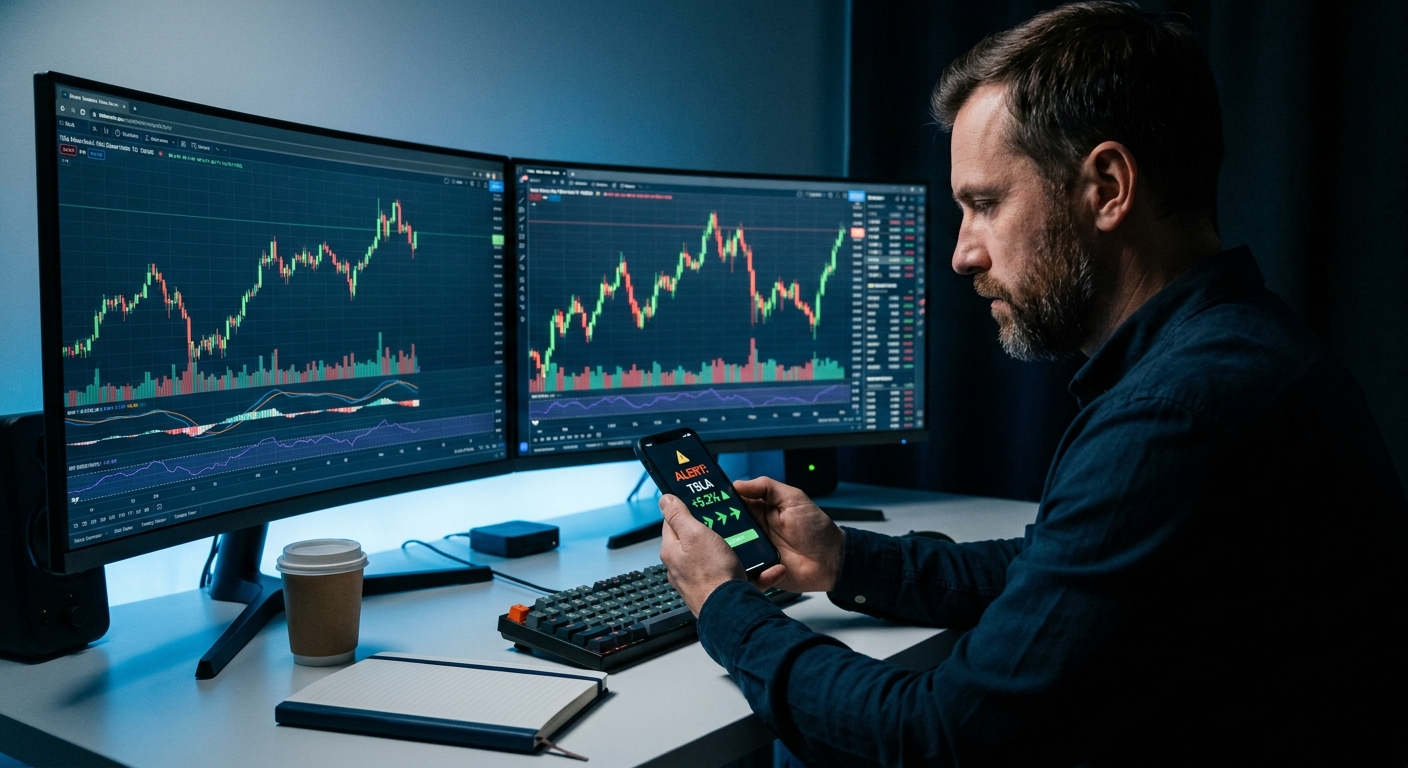
Most traders set up a watchlist the same way: add the tickers, maybe drop in a price alert at a key level, and hope the stock cooperates with their schedule. Then Tuesday at 10:47 AM, a stock they've been tracking for three weeks breaks out on 3x volume — and they're in a budget meeting with their phone face-down on the table.
The watchlist didn't fail. The alert system did. A price alert at $52.00 doesn't know whether volume confirmed the move, whether the stock reclaimed VWAP, or whether the breakout happened on a daily chart versus a 1-minute spike. It just fires — or it doesn't. And when you're away from your desk, "just fires" isn't good enough.
This guide walks through how to build a setup-based watchlist alert system — one that monitors your tickers across multiple technical conditions simultaneously and only notifies you when a stock actually meets the criteria you'd trade. No Pine Script. No alert spam. Just signals that matter, delivered to your phone while you're at work.
Why Most Watchlist Alerts Fail Working Traders
There's a fundamental mismatch between how most alert systems work and how working traders actually trade. Standard price alerts are binary: the stock hits a number, you get a ping. That's it. No context about whether volume confirmed the move, whether the broader market was in a risk-off session, or whether the breakout held for more than 90 seconds.
For a trader who's at their desk all day, that's fine, they can glance at the chart and make a judgment call in seconds. But for a swing trader with a day job, a decontextualized alert is almost worse than no alert. You get the ping, you can't act immediately, and by the time you check, the move is either over or you have no idea if it was even worth taking.
The second failure mode is volume. Most watchlist tools let you set alerts on price, maybe RSI, maybe moving average crossovers. Very few let you combine conditions, and almost none tell you why the alert fired in plain English. So you end up with a phone full of notifications that require a full chart review before you can evaluate them. That's not an alert system. That's just a delayed version of manual scanning.
A setup-based alert is different. It fires only when a stock meets a specific combination of technical conditions, the kind of multi-factor alignment you'd look for if you were sitting at your desk reviewing charts. Think: a stock breaking above a 6-week consolidation range and showing relative volume above 2x and holding above VWAP on the daily. That's a setup. A price crossing $52.00 is just a number.
The goal of this guide is to show you how to build that kind of system, and how to use ChartMath's screen subscription feature to make it work without writing a single line of code.
1. Know the Two Types of Alerts Before You Build Anything
Before configuring anything, it helps to understand the two fundamentally different alert types available to technical traders, because they serve very different purposes.
Price Alerts: Fast, Simple, Context-Free
A price alert fires when a stock crosses a specific dollar level. They're easy to set, available on every platform, and useful for one thing: knowing when a stock enters a price zone you care about. What they can't tell you is whether the move is real. A stock can cross $52.00 on 0.3x normal volume during a low-liquidity afternoon session and trigger the same alert as a clean breakout on 4x volume at the open. Same alert, completely different trade quality.
Setup-Based (Pattern) Alerts: Multi-Condition, Actionable
A setup-based alert fires only when a stock satisfies a defined combination of technical conditions at the same time. These are the alerts worth having when you can't watch the screen. Examples of what a real setup-based alert looks like:
- VWAP Reclaim + RVOL Spike: Stock crosses back above VWAP on the 1-hour chart with relative volume above 1.5x, a classic momentum re-entry signal. (See our full breakdown of VWAP trading and how to use it.)
- 52-Week High Breakout on Volume: Stock clears its 52-week high with above-average volume on the daily chart, a breakout continuation setup favored by swing traders.
- Opening Range Breakout (ORB): Stock breaks above the high of the first 15-minute candle with RVOL confirmation, a high-probability intraday setup.
- Momentum Surge: Stock shows a significant rate-of-change spike on the 1-hour chart alongside a volume surge, signaling a potential trend acceleration.
The difference matters enormously for working traders. A setup-based alert means that by the time your phone buzzes, the stock has already passed a multi-factor technical filter. You're not evaluating whether to look at it, you're evaluating whether to trade it. That's a much faster decision, and one you can make in 60 seconds at lunch.
For a deeper look at which technical indicators combine best for these setups, the VWAP vs RVOL vs ORB comparison is worth reading before you configure your first screen.
2. Build Your Watchlist Around Setups, Not Just Tickers
Most traders build watchlists backwards. They pick stocks they like, maybe a few names from earnings season, a sector they follow, some tickers from a Discord channel, and then try to figure out what alert to set on each one. The result is a sprawling list of 60+ tickers with inconsistent alert logic and no clear trading plan behind any of them.
A better approach: start with the setup you trade, then populate the watchlist with stocks that are in position to trigger it.
Organize by Setup Type, Not by Sector
Instead of one giant watchlist, think in terms of setup buckets:
- Breakout candidates: Stocks consolidating near a key resistance level, waiting for a volume-confirmed break
- Momentum plays: Stocks showing relative strength and above-average volume, candidates for continuation
- VWAP reclaim setups: Stocks that have pulled back to VWAP on the daily or 1-hour and are showing signs of reclaiming it
- 52-week high runners: Stocks approaching or just clearing multi-month highs with expanding volume
When your watchlist is organized this way, the alert logic becomes obvious. Each bucket maps directly to a screen, and each screen has a defined set of conditions that tell you when a stock in that bucket is actually triggering.
How Many Tickers Is Too Many?
For a swing trader with a day job, 20 to 40 tickers is a practical ceiling for a manually-managed watchlist. Beyond that, the cognitive load of reviewing alerts becomes its own problem. The good news: if you're using a scanner that covers the entire market, your watchlist doesn't need to be exhaustive. It just needs to contain the stocks you've already done the work on, the ones where you know the setup, the key levels, and the risk parameters. The scanner handles discovery for everything else.
3. Choose the Right Timeframe for Your Schedule
Timeframe selection is one of the most overlooked parts of alert configuration. An alert that fires on a 1-minute chart is useless to someone who checks their phone twice during the trading day. An alert that only fires on the weekly chart might not give you enough lead time to plan an entry.
Here's a practical framework based on how much screen time you actually have:
For Swing Traders With Day Jobs: 1-Hour and Daily
The 1-hour timeframe is the sweet spot for part-time traders. It's granular enough to catch intraday momentum shifts and VWAP reclaims, but slow enough that a midday or after-hours check won't miss the entire move. A breakout that triggers on the 1-hour chart typically gives you a window of several hours to evaluate and act, not 90 seconds.
The daily timeframe is ideal for swing trade setups you're planning to hold for days to weeks. Daily chart breakouts, 52-week high clears, and moving average reclaims on the daily give you overnight prep time and clean entry levels for the next morning's open.
For Active Intraday Traders: 1-Minute to 15-Minute
If you're running momentum plays or ORB setups, the 1-minute, 5-minute, and 15-minute screens are where the action is. These require more active monitoring, but the alert logic is the same, you're still subscribing to a screen and letting the system tell you when a stock qualifies, rather than watching every chart manually.
For Position Traders: Weekly and Monthly
Weekly and monthly screens are useful for identifying macro-level breakouts and long-term trend changes. These fire less frequently but tend to signal higher-conviction moves. A stock clearing a 3-year resistance level on the weekly chart is a different kind of opportunity than a 15-minute ORB.
ChartMath covers timeframes from 1-minute to 1-month across all 200+ screens, so whether you're a swing trader checking alerts twice a day or an intraday trader who needs real-time 5-minute signals, the same subscription workflow applies. You just choose the timeframe that matches your schedule.
4. Subscribe to Screens, Not Just Tickers
This is the part most traders haven't seen before, and it's the core of how a setup-based alert system actually works in practice.
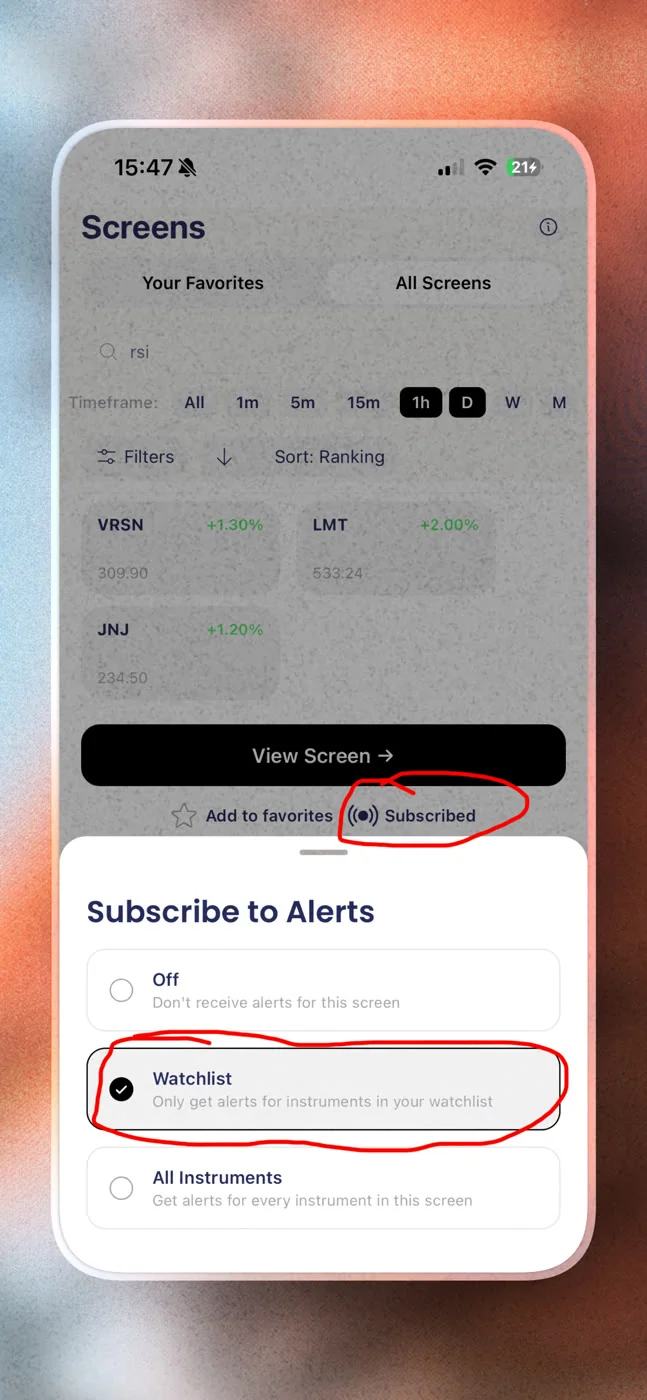
Instead of setting a price alert on each individual ticker, you subscribe to a screen, a pre-built technical filter that continuously scans the market for stocks meeting a specific set of conditions. When a stock enters that screen in real time, you get a push notification. The alert tells you which stock triggered, which screen it entered, and why, in plain English.
Two Subscription Modes: Watchlist vs. Market-Wide
ChartMath gives you two ways to subscribe to any screen:
- Watchlist mode: You only get alerted when a stock from your personal watchlist enters the screen. This is the right choice for stocks you've already researched and have a plan for. The alert means "one of your stocks just triggered your setup."
- Market-wide mode: You get alerted when any stock in the market enters the screen. This is the discovery mode, it surfaces setups you weren't already watching. Useful for finding new momentum plays or breakouts you'd have missed entirely.
Most working traders use both. Watchlist mode for their core holdings and researched candidates. Market-wide mode for one or two high-conviction screens where they want to see everything that qualifies, like a 52-week high breakout on volume or a VWAP reclaim with RVOL confirmation.
What the Screen Library Looks Like
ChartMath's screen library at chartmath.com/screens gives you a sense of the range. You'll find screens organized across categories like:
- Breakout screens: 52-week highs, consolidation breakouts, resistance clears with volume confirmation
- VWAP screens: VWAP reclaims, VWAP breakdowns, price-to-VWAP distance signals across multiple timeframes
- RVOL screens: Relative volume spikes, unusual volume alerts, volume surge with price confirmation
- Momentum screens: Rate-of-change surges, RSI momentum signals, trend acceleration setups
- Opening Range screens: ORB breakouts on 5-minute, 15-minute, and 30-minute timeframes
- Moving average screens: Golden cross, death cross, MA reclaims, and price-to-MA distance alerts
Each screen is pre-built, backtested, and available across multiple timeframes. You don't write a single condition, you browse, subscribe, and let the system do the scanning. For traders who've been frustrated by the Pine Script requirement on TradingView, this is the practical alternative. (More on that in our guide to integrating trading alerts with your charting platform.)
For a broader look at how these screens compare to other scanning tools, the stock screeners for day trading guide covers the landscape well.
5. Configure Notifications That Only Fire When It Matters
Subscribing to the right screens is step one. Step two is making sure the notifications you receive are actually actionable, not a flood of low-quality pings that train you to ignore your phone.
Match Alert Delivery to Your Schedule
Push notifications to mobile are the right delivery method for working traders. Email alerts are fine for end-of-day summaries, but if you're trying to catch a 1-hour breakout during a lunch break, you need the alert on your phone the moment it fires, not in an inbox you check at 6 PM.
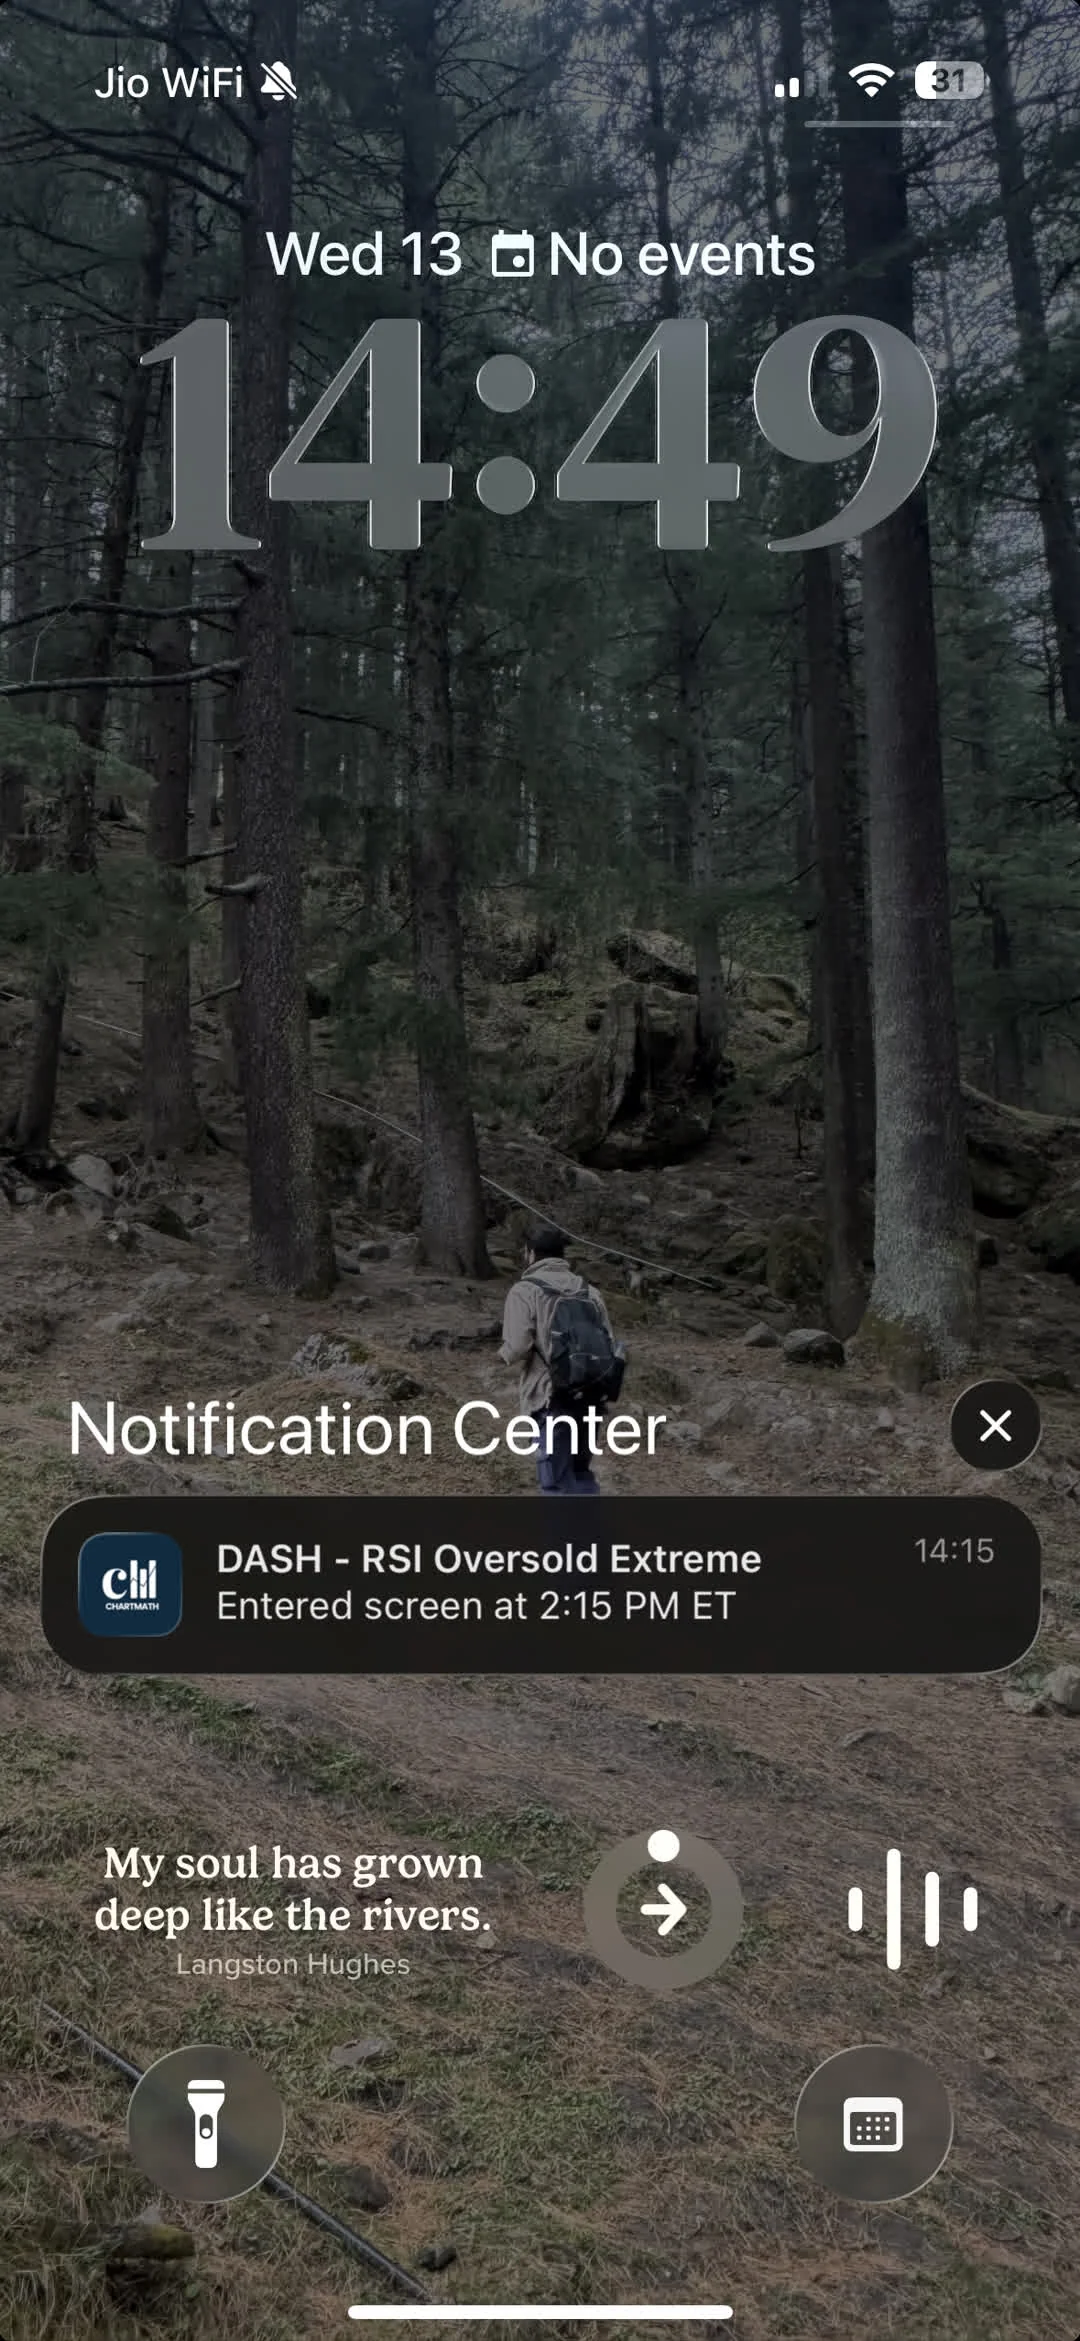
ChartMath is built mobile-first for exactly this reason. Alerts arrive as push notifications with a plain-English explanation of what triggered: not just "AAPL alert" but "AAPL entered the VWAP Reclaim screen on the 1-hour chart, price crossed back above VWAP with RVOL at 1.8x." That's enough context to make a quick decision without pulling up a full chart review.
Stack Conditions to Reduce Noise
The more conditions a screen requires, the fewer stocks will trigger it, and the higher the quality of each alert. A screen that requires price above VWAP and RVOL above 1.5x and a bullish candle close on the 1-hour chart will fire far less often than a simple price crossover. That's a feature, not a limitation.
For working traders, alert fatigue is a real risk. If your phone buzzes 40 times a day with trading notifications, you'll start ignoring all of them, including the good ones. The goal is 3 to 8 high-quality alerts per day that each represent a genuine setup worth evaluating. That's achievable with the right screen selection and timeframe filtering.
Our guide on catching breakout opportunities in real time goes deeper on the specific conditions that separate high-probability breakouts from false starts.
Why Explainable Alerts Change the Game
Most alert systems tell you that something happened. ChartMath tells you why it matters. Every alert includes the specific conditions that triggered the screen, the timeframe, and the historical context, so you're not starting from zero when you evaluate it. This is especially valuable when you have 5 minutes at lunch and three alerts to triage. You can read the explanation, check the chart quickly, and make a decision, rather than spending 10 minutes reconstructing what happened.
6. Review Alerts at Lunch or After Hours, Not in Real Time
One of the biggest mindset shifts for swing traders with day jobs is accepting that you don't need to act on every alert the moment it fires. The whole point of setup-based alerts on the 1-hour and daily timeframes is that the setup doesn't evaporate in 90 seconds. You have time.
The Working Trader's Review Rhythm
A practical daily routine looks something like this:
- Premarket (5, 10 minutes): Check overnight alerts from daily and weekly screens. Note any stocks that triggered a setup and are gapping in the direction of the trade. Set mental levels for the open.
- Midday / Lunch (5 minutes): Triage any 1-hour alerts that fired during the morning session. For each one, read the alert explanation, pull up the chart, and decide: act now, watch for confirmation, or pass.
- After hours (15, 20 minutes): Full review of the day's alerts. Evaluate daily chart setups for next-day entries. Update your watchlist. Check backtest data on any new screens you're considering subscribing to.
This rhythm is sustainable alongside a full-time job. It doesn't require you to be glued to a screen, it requires you to be organized and to trust the system to surface the setups while you're unavailable. For a more detailed version of this workflow, the 30-minute daily guide for busy swing traders is a good companion read.
Using the Swipe Interface to Triage Quickly
ChartMath's mobile interface is built for exactly this kind of quick triage. The TikTok-style swipe format lets you move through alerts one at a time, each one showing the setup explanation, the chart, and the backtest data for that screen. You swipe to save or dismiss. A 5-minute lunch review can cover 10 to 15 alerts without feeling rushed.
7. Validate Every Alert With Backtest Data Before You Trade
An alert without historical context is just noise with better timing. Before you act on any setup, you should know whether that specific combination of conditions has a positive edge over a meaningful sample of trades.
What to Look For in Backtest Data
When evaluating a screen's historical performance, three numbers matter most:
- Win rate: What percentage of trades triggered by this screen were profitable? A win rate above 55% on a large sample is meaningful. Below 50% requires a very favorable risk/reward ratio to justify trading.
- Average return per trade: What's the typical gain on winning trades versus the typical loss on losers? A screen with a 52% win rate but a 3:1 reward-to-risk ratio is a strong edge.
- Maximum drawdown: What's the worst-case scenario for a string of losses? This tells you how much capital you need to weather a losing streak without blowing up your account.
ChartMath shows these stats for every screen in the library, not as black-box AI scores, but as transparent historical data you can evaluate yourself. You're not trusting an algorithm's confidence rating. You're looking at actual trade outcomes and deciding whether the edge is real. For a deeper dive into how to interpret these numbers, the complete guide to backtesting strategies covers the methodology in detail.
The System Surfaces. You Decide.
This is worth saying clearly: ChartMath is a discovery and alert tool, not an auto-trading system. Every alert is a candidate for your review, not a trade instruction. The system does the scanning, the filtering, and the explaining. You make the final call. That's the right division of labor for a self-directed trader who knows their setups and wants the system to handle the parts that don't require human judgment.
Putting It All Together: A Sample Alert Setup for a Swing Trader With a Day Job
Here's what a complete setup-based watchlist alert system looks like in practice, using ChartMath as the infrastructure.
Step 1: Build Your Watchlist (One Time, 20, 30 Minutes)
Add 20 to 40 stocks you've researched and have a trading plan for. Organize them mentally by setup type: breakout candidates, momentum plays, VWAP setups. You don't need to be exhaustive, the market-wide screen subscriptions will surface new names you haven't thought of.
Step 2: Subscribe to Your Core Screens (One Time, 10 Minutes)
Go to chartmath.com/screens and browse the screen library. For a swing trader with a day job, a practical starting set might include:
- 52-Week High Breakout (Daily): Subscribe in watchlist mode, alerts you when a stock you're tracking clears a major resistance level
- VWAP Reclaim (1-Hour): Subscribe in watchlist mode, catches momentum re-entries on stocks you're already watching
- High RVOL Breakout (1-Hour): Subscribe in market-wide mode, surfaces new momentum plays you weren't tracking
- Consolidation Breakout (Daily): Subscribe in watchlist mode, fires when a stock you've been watching finally breaks out of a tight base
That's four screen subscriptions. On a typical trading day, this might generate 4 to 10 alerts, all of them representing genuine technical setups, not random price movements.
Step 3: Enable Push Notifications on Mobile
Make sure ChartMath push notifications are enabled on your phone. This is the delivery mechanism that makes the whole system work while you're at work. When an alert fires, you get a notification with the stock, the screen it triggered, and a plain-English explanation, all without opening the app.
Step 4: Triage at Lunch (5 Minutes)
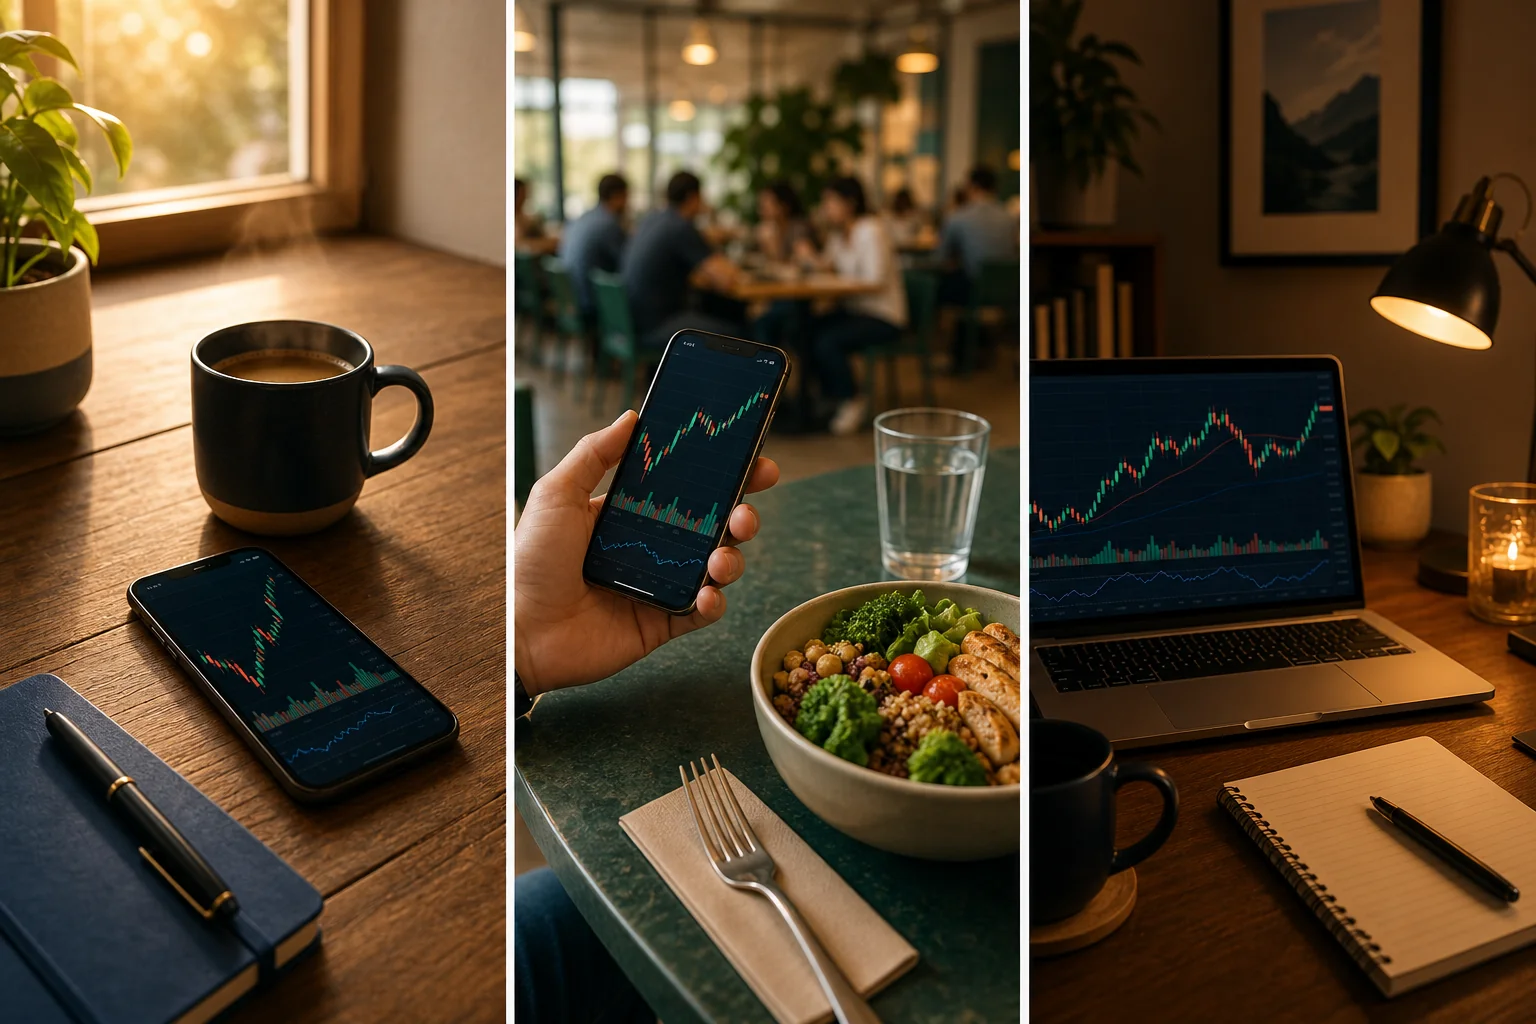
Open the app at lunch. Swipe through the morning's alerts. For each one, read the explanation, check the chart, and note the backtest stats for that screen. Decide: act now (if you can), watch for a specific confirmation, or pass. Most alerts will be passes, and that's fine. You're looking for the 1 or 2 that meet your full criteria.
Step 5: Review and Prep After Hours (15, 20 Minutes)
After market close, do a full review. Check daily chart alerts for next-day swing trade entries. Update your watchlist based on what you saw during the day. Adjust your screen subscriptions if you're getting too many or too few alerts. This is also when you use the backtest data to validate any new setups you're considering adding to your rotation.
The whole system, from screen subscription to push notification to trade decision, runs without you manually scanning a single chart during market hours. That's the point. For more on building this kind of structured workflow, see our guide to building an efficient trading workflow in 2026.
Frequently Asked Questions
Do I need to code anything to set up alerts in ChartMath?
No. Every screen in ChartMath is pre-built and ready to subscribe to. There's no Pine Script, no custom filter syntax, and no configuration required beyond choosing which screens to subscribe to and whether you want watchlist-only or market-wide alerts. The stock screener guide covers how this compares to platforms that require coding.
Can I get alerts for stocks not on my watchlist?
Yes. When you subscribe to a screen in market-wide mode, you'll receive alerts for any stock in the market that enters that screen, not just the ones you're already tracking. This is how ChartMath functions as a discovery layer, surfacing setups you'd never find through manual scanning.
What timeframes work best for swing trading alerts?
The 1-hour and daily timeframes are the most practical for swing traders with day jobs. The 1-hour gives you enough granularity to catch intraday momentum shifts without requiring real-time monitoring. The daily is ideal for multi-day swing setups you're planning to hold for several days to weeks. ChartMath supports timeframes from 1-minute to 1-month, so you can mix and match based on your schedule.
How is this different from TradingView alerts?
TradingView alerts require you to write Pine Script conditions or manually configure each alert on a stock-by-stock basis. ChartMath's screen subscriptions apply a pre-built, backtested multi-condition filter across your entire watchlist (or the whole market) automatically. You also get a plain-English explanation with each alert, TradingView just tells you the alert fired. For traders who want discovery without coding, the difference is significant. See our guide to integrating alerts with your charting platform for a full comparison.
Will I get too many alerts?
Alert volume depends on which screens you subscribe to and whether you use watchlist or market-wide mode. A focused setup, 3 to 5 screens, watchlist mode for most of them, market-wide for one or two high-conviction screens, typically generates 4 to 12 alerts per trading day. That's manageable in a 5-minute lunch review. If you're getting more than that, narrow your screen selection or switch more subscriptions to watchlist-only mode.
Stop Scanning. Start Getting Notified.
The traders who never miss a breakout while at work aren't watching more charts, they've built a system that watches for them. A setup-based watchlist alert system does the scanning, applies the filters, and delivers the signal to your phone the moment a stock qualifies. You stay focused on your job. The system stays focused on the market.
ChartMath is built specifically for this workflow: 200+ pre-built, backtested screens, a subscribe button that works for your watchlist or the whole market, push alerts with plain-English explanations, and a mobile-first interface designed for 5-minute triage sessions. No Pine Script. No alert spam. No staring at screens.
See how the screen subscription system works in practice, watch the ChartMath demo to get a feel for the alert workflow from screen to notification to trade decision. Or if you're ready to set up your first screen subscriptions today, download the ChartMath app and start with the screens that match your setups. Your watchlist has been waiting long enough.

See these setups live in ChartMath
200+ curated screens with backtest data. Free. No credit card required.