What Is Backtest Win Rate in Trading Setups — and Does It Actually Matter?
Pick up any trading book written in the last twenty years and somewhere in the first three chapters you'll find a table. Two columns: "Win Rate" and "Profitability." The author's point is always the same — a high win rate does not guarantee a profitable strategy. Traders nod along, close the book, and then spend the next six months chasing setups with the highest win rate they can find. The lesson doesn't stick because the math never gets made concrete.
This guide makes it concrete. You'll learn exactly what a backtest win rate is, how it's calculated for technical trading setups, and — more importantly — why it's only one of three numbers you need before you trust a setup with real capital. By the end, you'll know how to read backtest stats the way a systematic trader does: as evidence of historical edge, not as a promise about tomorrow.
Win Rate Sounds Simple. It Isn't.
At its most basic, win rate is the percentage of trades a setup produced a positive return. If a screen fired 100 times historically and 60 of those trades closed in profit, the win rate is 60%. That's the whole formula.
The confusion starts when traders conflate two very different things: a win rate on their own live trades, and a backtested win rate on historical data. Your personal win rate is a record of your execution, your entries, your exits, your discipline. A backtested win rate is a statistical property of the setup itself, measured across every historical instance the pattern appeared in the data. They are related, but they are not the same number.
Traders fixate on win rate for a simple psychological reason: winning feels good. A 70% win rate means you're "right" seven times out of ten. That feels like competence. It feels like an edge. The problem is that win rate says nothing about the size of the wins versus the size of the losses. A setup that wins 70% of the time but loses three times as much on each loser as it gains on each winner will drain your account steadily and quietly. The math on that is brutal, and we'll show it below.
The core thesis of this guide: win rate is one data point, not the whole story. It only becomes useful when you pair it with average return and sample size.
How Backtest Win Rate Is Actually Calculated
A backtest works by replaying history. The system scans every bar in the historical data for a given instrument and timeframe. When the conditions for a screen are met, say, a stock closes above a key moving average on elevated volume, the backtest records a hypothetical entry at the close of that bar. It then tracks the trade forward to a defined exit condition and records the outcome.
Exit Types Matter
The exit rule has a significant effect on the win rate you see. Common exit types include:
- EOD (End of Day): the trade closes at the end of the trading session.
- N-bar: the trade closes after a fixed number of bars (e.g., 5 candles on a 15-minute chart).
- Stop Loss: the trade closes when price hits a defined loss threshold.
- Take Profit: the trade closes when price hits a defined gain target.
- Trailing Stop Loss: the stop moves up as the trade moves in your favor, locking in gains.
Change the exit type and you change the win rate. A setup with a tight stop loss and a wide take profit will have a lower win rate than the same setup with a wide stop and a tight target. Neither is inherently better, what matters is the combination of win rate and average return together.
Bar-Close Entries and No Look-Ahead Bias
A well-constructed backtest uses bar-close entries: the hypothetical trade enters at the closing price of the bar that triggered the signal, not at some intrabar price that would only be visible in hindsight. This eliminates look-ahead bias, the subtle error where a backtest "knows" information that wasn't available at the time of the signal. ChartMath's backtests use bar-close entries with no look-ahead, which is the correct approach for measuring a setup's historical edge honestly.
What Backtests Do Not Model
Here's the honest part that most tools skip: backtests do not model commissions, slippage, or bid-ask spread. The gap between the theoretical bar-close price and the price you actually fill at in a live market can be meaningful, especially on lower-liquidity names or fast-moving intraday setups. Keep that in mind when you read any backtest figure. The number is a clean-data baseline, not a net-of-costs projection.
Why Sample Size Is the First Number to Check
A 70% win rate on 8 historical trades is statistically meaningless. Eight trades is not enough data to distinguish a real edge from random noise. Before you trust any win rate, check the sample size (N). As a rough guide, fewer than 30 occurrences should be treated with serious skepticism. More than 100 gives you something worth analyzing. The win rate number is only as reliable as the sample it came from.
The Three Numbers You Actually Need
Win rate alone is a one-legged stool. Here are the three numbers that give you a complete picture of a setup's historical edge.
1. Win Rate
Win Rate is the percentage of historical instances that closed with a positive return. It tells you how often the setup worked. It does not tell you how much it made when it worked or how much it lost when it didn't.
2. Average Return
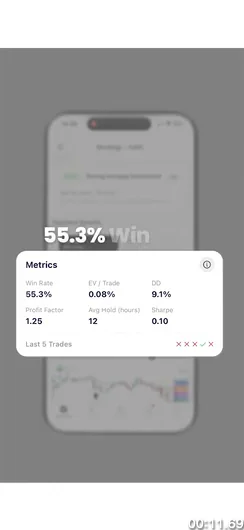
Average Return is the mean gain or loss per trade across all historical instances. This is the number win rate ignores. A setup with a 55% win rate and an average return of +2.1% per trade is more valuable than a setup with a 72% win rate and an average return of +0.4% per trade, assuming similar sample sizes and timeframes.
3. Sample Size (N)
Sample size is the number of historical instances the statistics are drawn from. It's the confidence weight on the other two numbers. A win rate of 60% on 200 occurrences is a meaningful signal. The same win rate on 12 occurrences is a coincidence.
Putting It Together: Expected Value
The synthesis of these three numbers is Expected Value (EV). The formula is straightforward:
EV = (Win Rate × Average Win) − ((1 − Win Rate) × Average Loss)
A positive EV means the setup has historically produced more than it lost, on average, per trade. A negative EV means the opposite, no matter how high the win rate looks.
Here's a concrete example. Setup A has a 72% win rate with an average gain of +0.8% and an average loss of −2.5%. Its EV is roughly (0.72 × 0.8) − (0.28 × 2.5) = 0.576 − 0.700 = −0.12% per trade. Negative. Setup B has a 45% win rate with an average gain of +3.2% and an average loss of −1.4%. Its EV is (0.45 × 3.2) − (0.55 × 1.4) = 1.44 − 0.77 = +0.67% per trade. Positive. Setup B wins less often and compounds faster. That's the math that doesn't fit on a motivational trading poster.
For a deeper look at how backtesting strategies are constructed from the ground up, the guide on building winning backtesting strategies covers the full methodology.
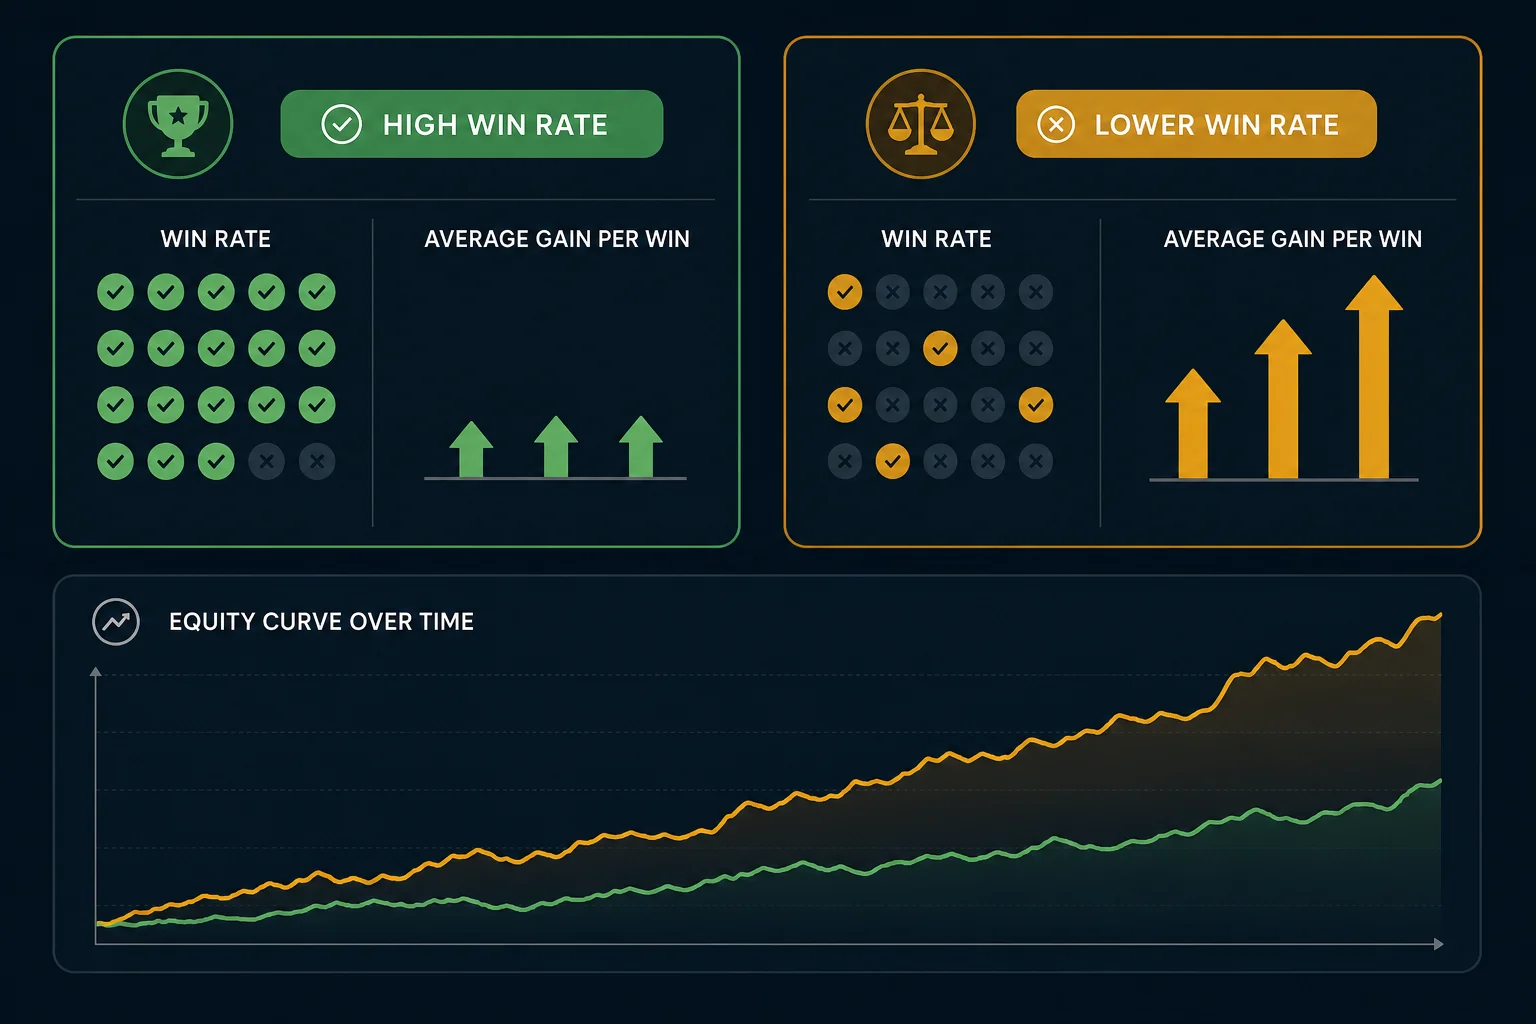
The High Win Rate Trap (and How Traders Fall Into It)
The psychological appeal of a high win rate is real. Winning more often than you lose feels like skill. It feels like you've figured something out. That feeling is exactly what makes the high win rate trap so effective at draining accounts slowly.
The math is unforgiving. A setup that wins 75% of the time but produces an average gain of +0.5% on winners and an average loss of −2.0% on losers has an EV of (0.75 × 0.5) − (0.25 × 2.0) = 0.375 − 0.500 = −0.125% per trade. Run that 200 times and you've lost roughly 25% of your capital on a setup that "worked" three-quarters of the time. The account statement looks like a slow leak because it is one.
This trap is especially common in signal groups and Discord trading communities. A caller posts a setup, it works, they post the win. The losses get quieter treatment. Over time, followers see a curated record of wins with no statistical context, no sample size, no average return, no EV. They're making decisions based on a highlight reel, not a backtest.
Systematic traders solve this by demanding the full picture before they risk capital. Win rate is the headline. Average return and sample size are the fine print that actually determines whether the headline is worth anything.
The post on validating a swing trade setup before risking capital covers the broader pre-trade checklist that surrounds this kind of statistical review.
What a Backtest Is, and What It Isn't
A backtest is evidence of historical edge. It tells you how a defined set of rules performed on past data. That's genuinely useful. It's the difference between trading a setup because it "looks good" and trading it because it has a documented track record across hundreds of historical instances.
What a backtest is not: a guarantee. Markets change. A setup that worked consistently during a trending bull market may behave differently in a choppy, range-bound environment. A screen tuned tightly to one specific market period may not generalize to the next. This is called overfitting, and it's the reason a large, diverse sample size matters so much.
Look-Ahead Bias: The Silent Killer of Backtest Credibility
Look-ahead bias occurs when a backtest uses information that wasn't available at the time of the signal. A common example: entering a trade at the low of a bar rather than the close, because the backtest "knows" where the low was. In live trading, you don't know where the low will be until the bar closes. Bar-close entries eliminate this problem by anchoring every hypothetical entry to a price that was actually observable at the moment the signal fired.
The Honest Framing
Think of a backtest as a conviction-builder, not a crystal ball. It answers the question: "Has this pattern historically produced a positive edge?" If the answer is yes, across a meaningful sample, you have a rational basis for taking the trade. You still manage risk. You still size positions appropriately. You still accept that any individual trade can lose. The backtest shifts the odds in your favor over a large number of trades, it does not eliminate the possibility of loss on any single one.
Hypothetical performance disclaimer: Backtest results are based on historical data and do not guarantee future results. They do not account for commissions, slippage, or spread. Past performance of a technical setup is not indicative of future returns.
For a practical look at how to build a complete trading workflow around this kind of evidence-based approach, see the guide on building an efficient trading workflow.
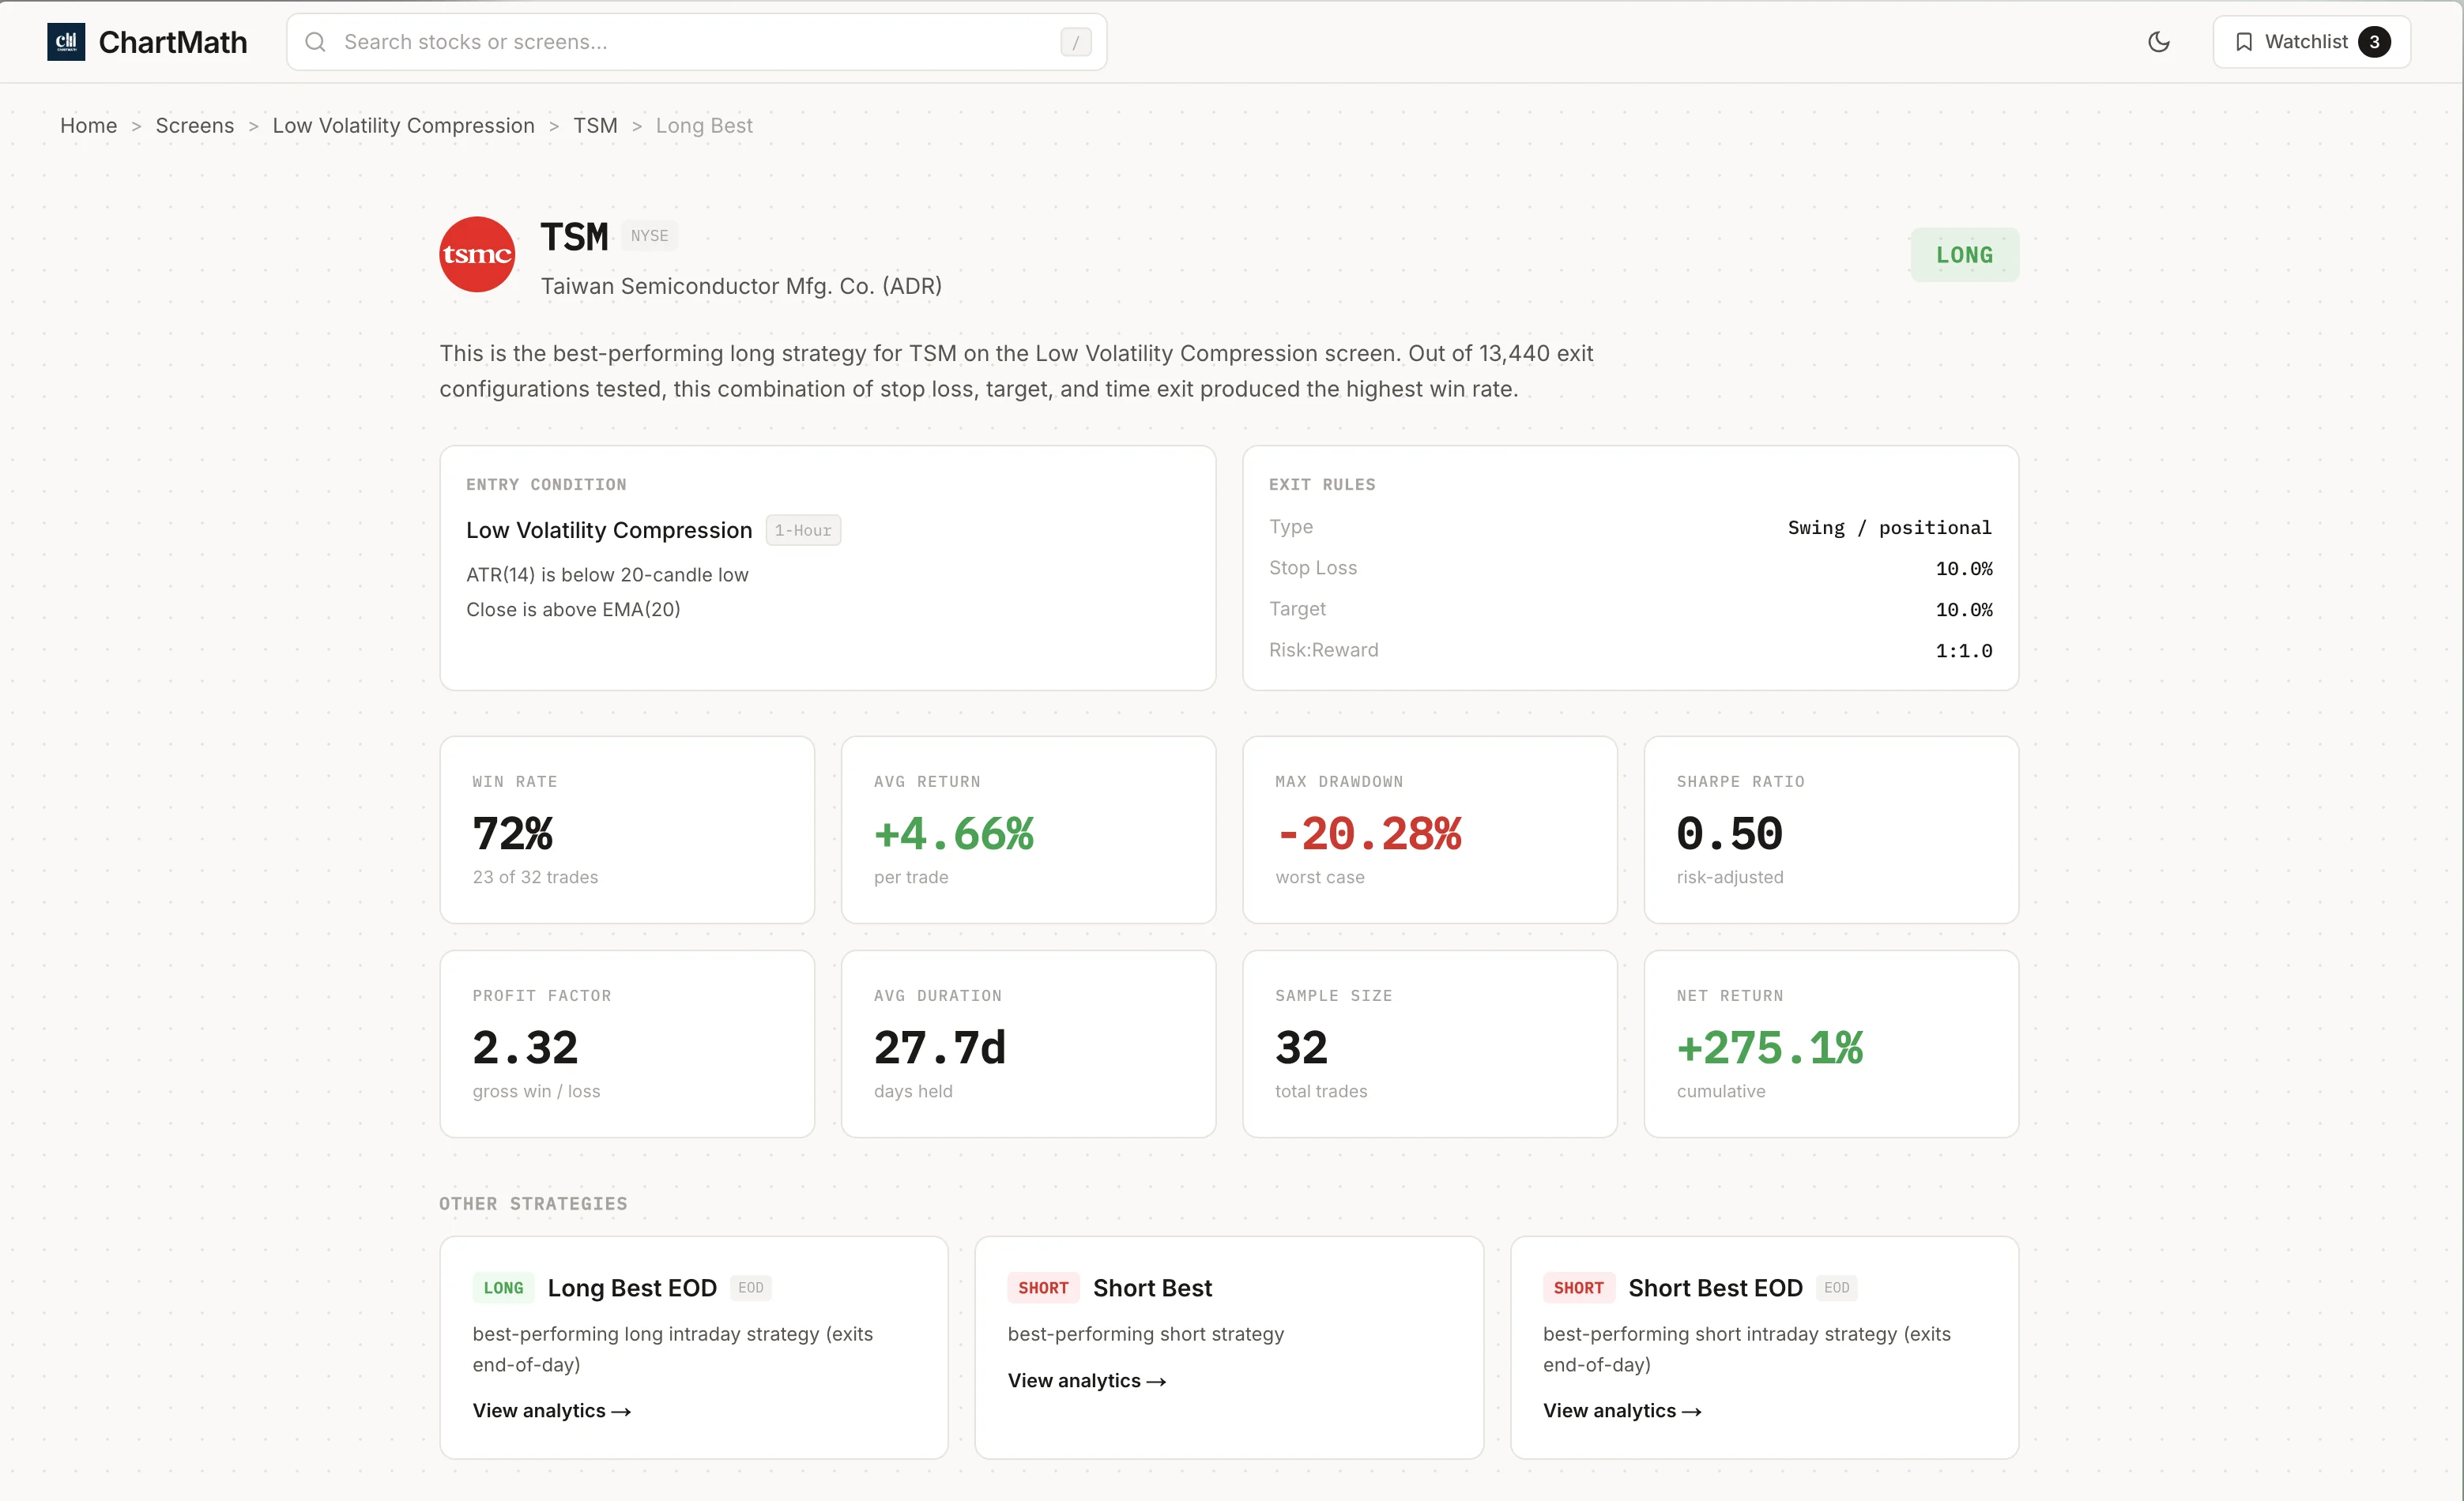
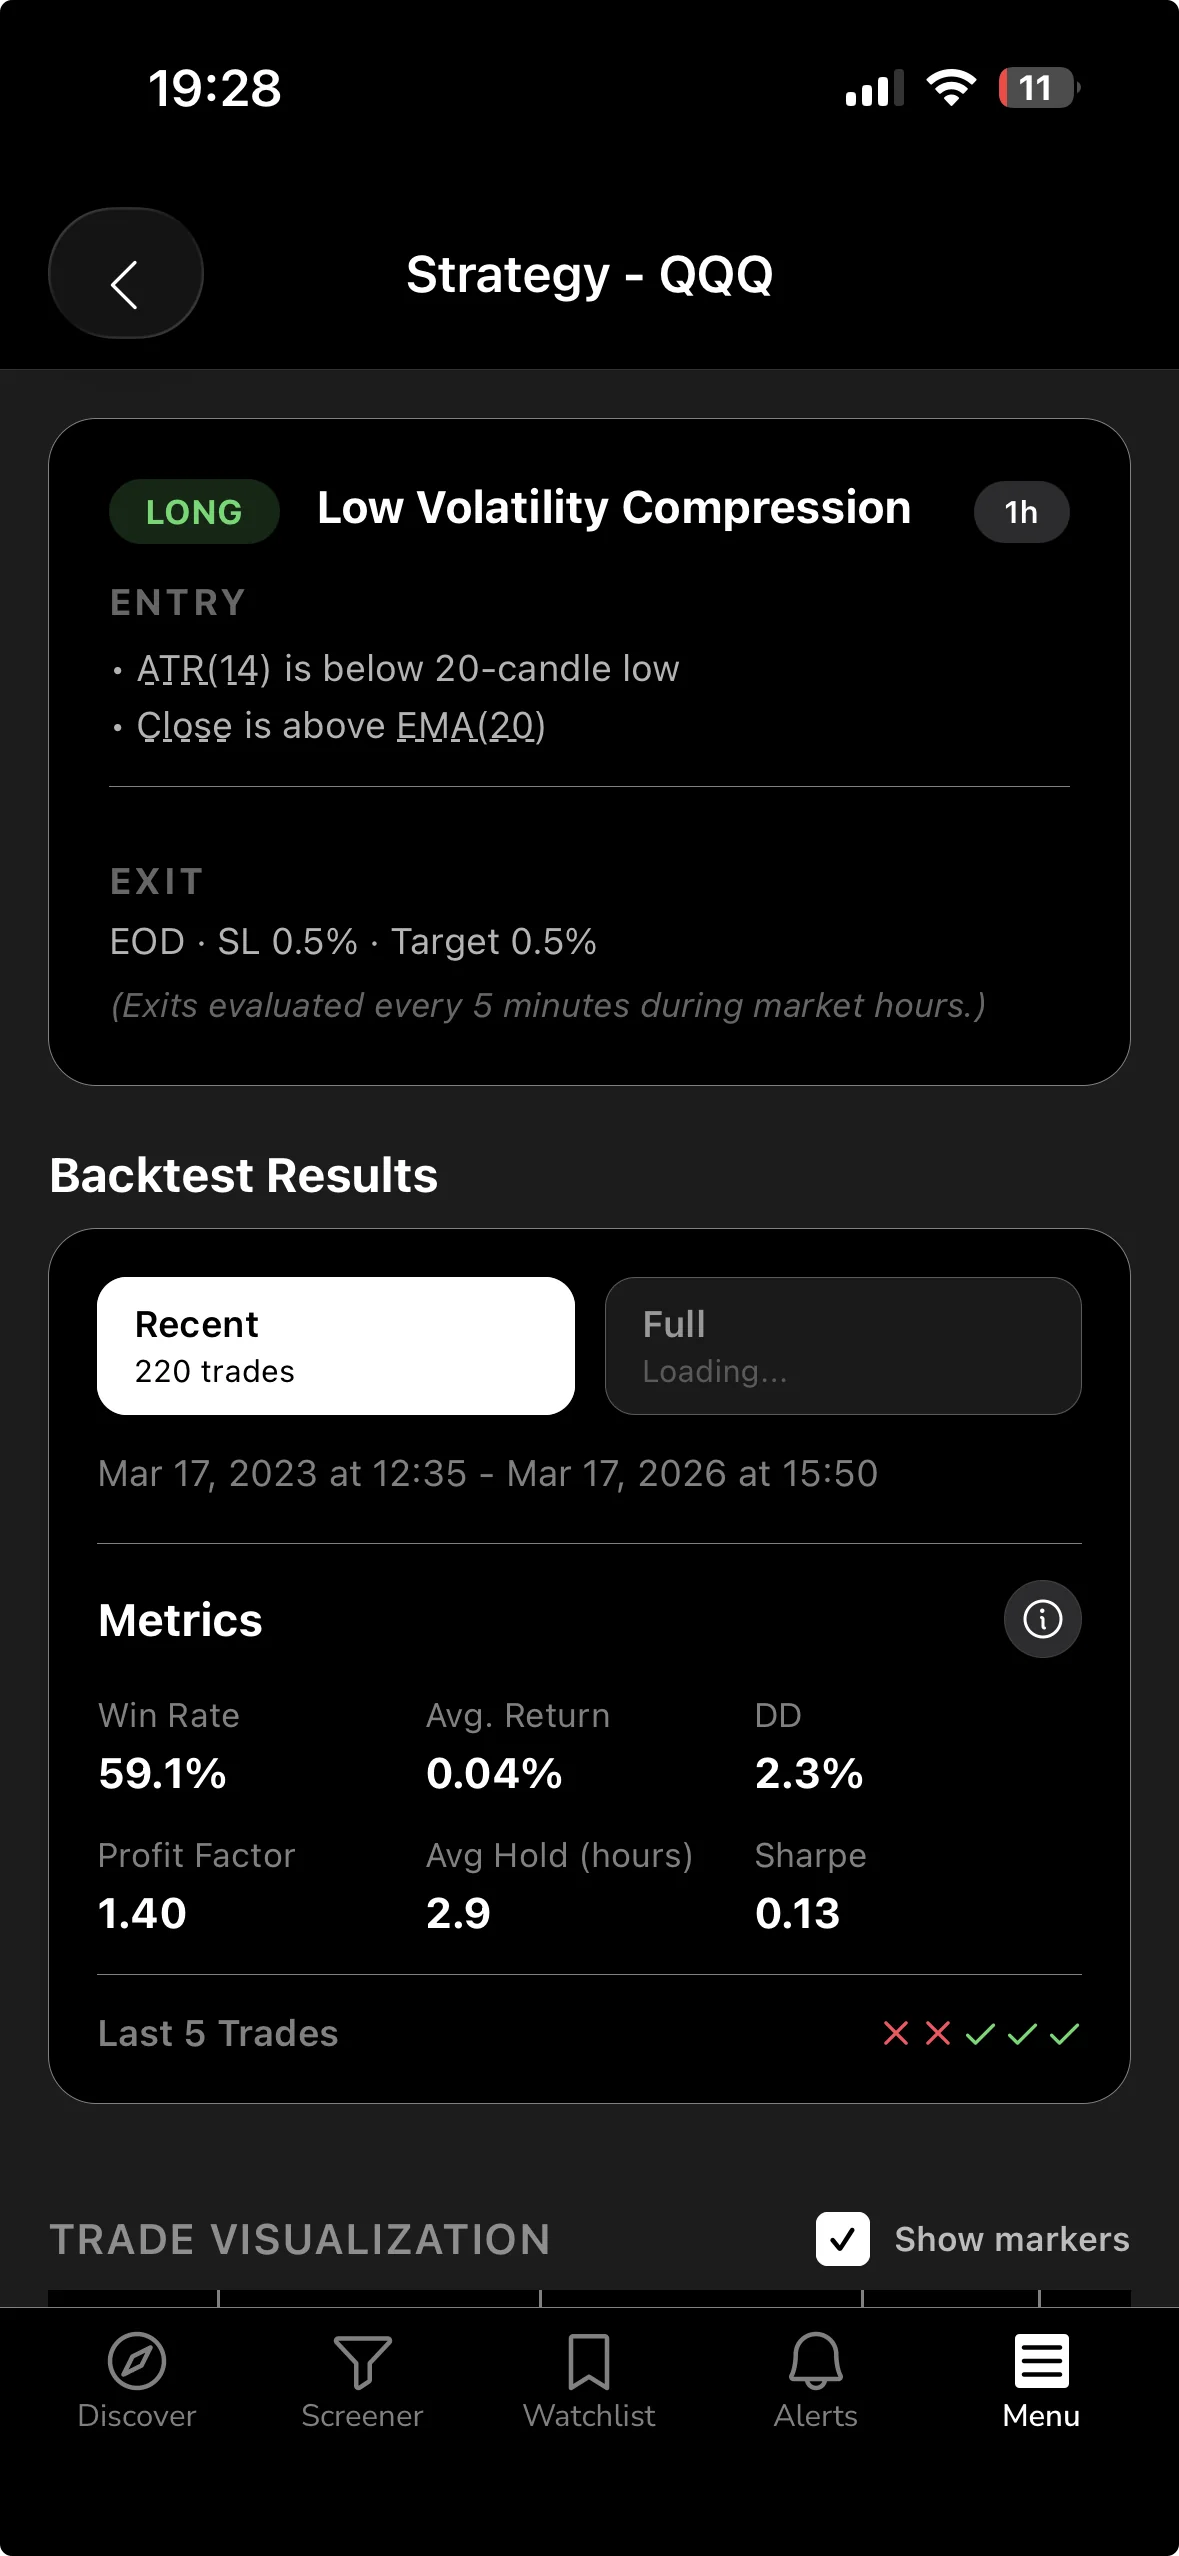
How ChartMath Shows Backtest Stats on Every Screen
Most retail screeners show you a list of tickers that match a filter. They don't tell you whether the filter has historically worked. ChartMath is built differently: every one of its 200+ curated technical screens ships with its backtested Win Rate and Average Return already calculated and displayed on the card.
The universe covers 500+ US equities, 100 crypto pairs, and 11 US futures, across 7 timeframes: 1-minute, 5-minute, 15-minute, 1-hour, Daily, Weekly, and Monthly. Every screen is read-only and curated, there's no screen builder, no Pine Script, no coding required. The screens are AI-proposed and backtester-validated: only setups with a verified win rate make it into the app.
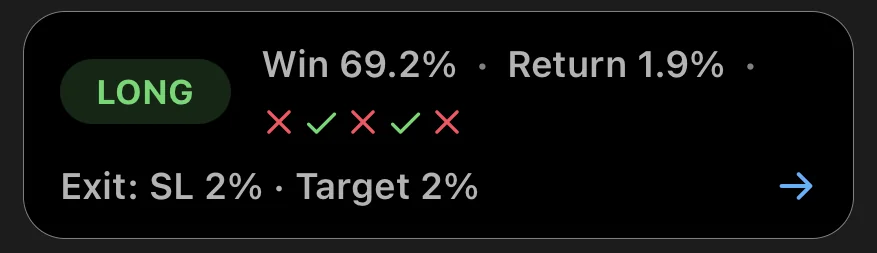
The Discover Feed
The primary surface in ChartMath is the Discover feed: a swipe-first list of explainable entry cards. Each card shows you a symbol, the screen it matched, and a plain-English explanation of why the signal fired right now. The backtest stats, Win Rate, Average Return, sample size, and EV, are right there on the card. You're not hunting for the data. It's the first thing you see.
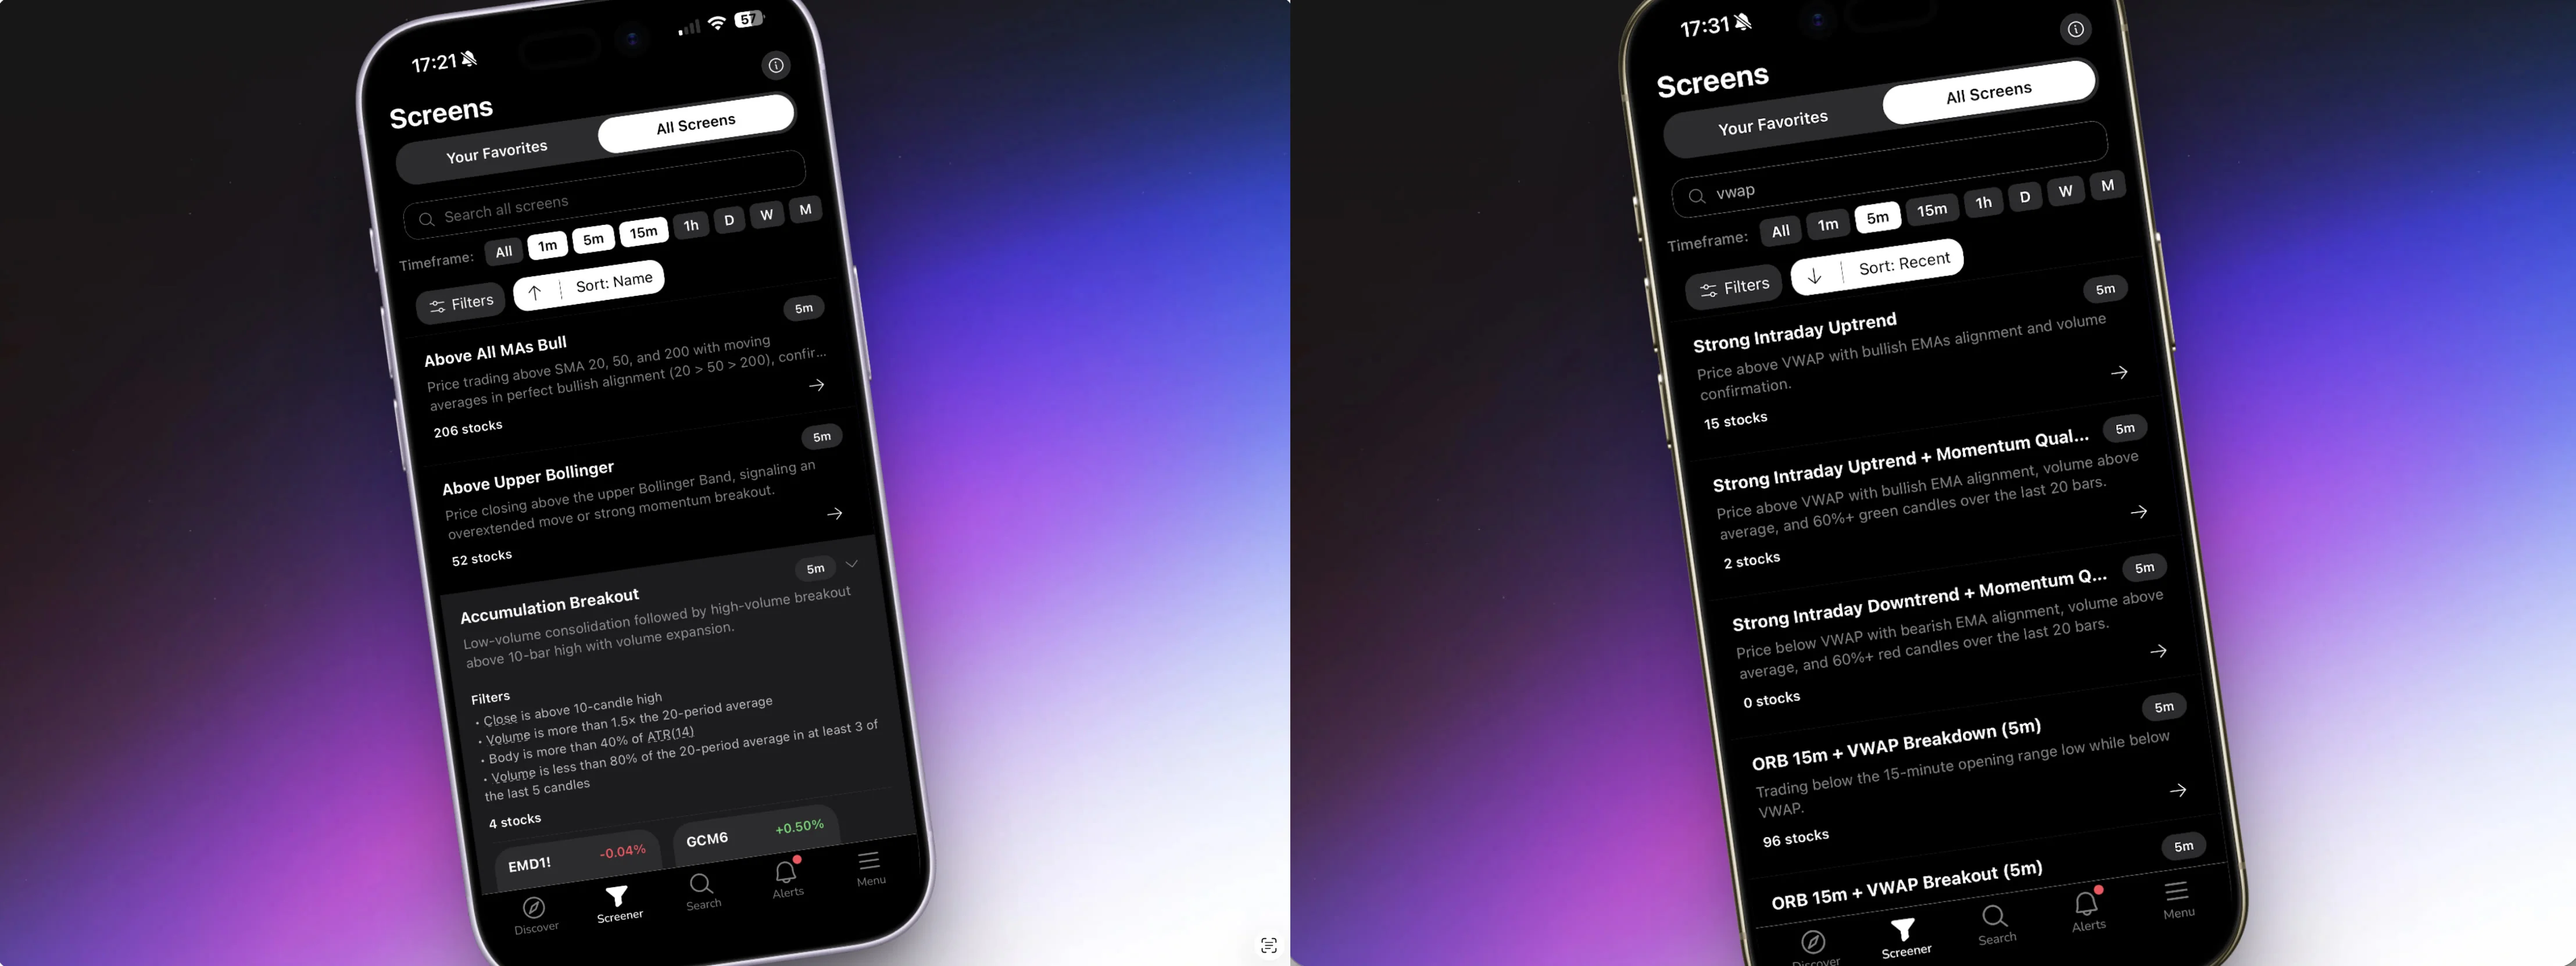
The Screener Tab
The Screener tab lets you browse all 200+ screens directly. Open any screen and you see every instrument currently matching it, along with the screen's historical stats. This is useful for research: you can compare the win rate and average return across different screen types before you decide which setups to follow.
Alerts fire via push and email the moment a ticker enters a screen you've favorited. The alert payload carries the ticker, timeframe, screen name, a plain-English reason it fired, a timestamp, and a deep link back into the app. No SMS, no noise from unvalidated sources, just a documented setup with its historical stats attached.
ChartMath is available on iOS and Android, with a read-only web browse layer at chartmath.com/screens where you can explore the screen library without signing in. It starts with a 14-day free trial: every screen, every backtest, every alert, no card to start. After the trial, founding pricing is $24.99/mo (locked for your first 12 months) or $149/yr.
If you're coming from a tool like TradingView and want to understand how ChartMath fits alongside it, the post on using a stock scanner without Pine Script covers the workflow in detail.
How to Use Win Rate Data to Make Better Entry Decisions
Reading backtest stats is a skill. Here's a practical five-step process for a swing trader with a day job who wants to use win rate data as a conviction filter rather than a buy signal.
Step 1: Check the Sample Size First
Before you look at the win rate number, look at N. If the screen has fewer than 30 historical instances on the instrument and timeframe you're considering, treat the stats as preliminary. They may be directionally interesting, but they're not statistically reliable. A screen with 150+ occurrences gives you a much more stable estimate of the true edge.
Step 2: Read Win Rate and Average Return Together
Never read win rate in isolation. Pull up the average return alongside it and do a rough EV check in your head. A 60% win rate with a +1.8% average return is a very different proposition from a 60% win rate with a +0.3% average return. The first has meaningful positive EV. The second barely covers the friction of trading it.
Step 3: Match the Timeframe to Your Schedule
A daily-chart win rate and a 15-minute win rate are not interchangeable. The daily chart setup may take 5 to 15 trading days to resolve. The 15-minute setup may resolve in a single session. If you have a day job and can't monitor intraday charts, a high win rate on a 5-minute screen is largely irrelevant to you. Focus on the timeframes you can actually trade: Daily and Weekly screens for swing setups, with end-of-day review.
The post on swing trading with a full-time job covers how to build a realistic schedule around the timeframes that fit your life.
Step 4: Use the Backtest as a Conviction Filter, Not a Buy Signal
A screen firing is not a trade. It's a candidate. The backtest stats tell you the setup has historically produced a positive edge. Your job is to confirm the setup makes sense in the current context: Is the broader market trend supportive? Is there a clear risk level? Does the position size fit your account? The backtest answers "has this worked historically?" You answer "does it make sense right now?"
Step 5: Execute in Your Own Broker
ChartMath is a copilot, not an autopilot. It surfaces the setup, explains why it fired, and shows you the historical stats. You make the decision and place the trade in your own brokerage account. There is no broker connection, no in-app order placement, no automated execution. That separation is intentional: the tool does the scanning and the research, you keep the call.
For traders who want to understand how to connect a discovery tool like ChartMath to their existing charting setup, the guide on integrating trading alerts with your charting platform walks through the workflow.
Frequently Asked Questions
What is a good win rate for a trading setup?
There's no universal answer, because win rate only makes sense in the context of average return. A 40% win rate can be excellent if the average gain on winners is significantly larger than the average loss on losers. A 75% win rate can be terrible if the losses are much larger than the gains. Focus on positive EV, not a win rate target in isolation.
Can a 50% win rate be profitable?
Yes, easily. If your average gain on winning trades is larger than your average loss on losing trades, a 50% win rate produces positive EV. Many professional systematic strategies operate near or below 50% win rates with strong long-term results. The ratio of average win to average loss is what drives profitability, not the win rate alone.
How many trades does a backtest need to be reliable?
As a practical minimum, aim for 30 or more historical instances before treating a win rate as meaningful. More is better: 100+ occurrences gives you a much more stable estimate. Be especially cautious with setups that have high win rates on small samples, the win rate will tend to regress toward the mean as more data accumulates.
Does ChartMath's backtest include commissions and slippage?
No. ChartMath's backtests use bar-close entries with no look-ahead bias, but they do not model commissions, slippage, or bid-ask spread. The Win Rate and Average Return figures you see are clean-data baselines. Factor in your own trading costs when evaluating whether a setup's edge is large enough to be worth trading after friction.
What is the difference between win rate and expected value?
Win rate tells you how often a setup produced a positive return. Expected value (EV) tells you how much you can expect to make or lose per trade on average, accounting for both the frequency of wins and the size of wins versus losses. EV is the more complete measure of a setup's edge. A positive EV setup is worth trading systematically. A negative EV setup loses money over time regardless of how high the win rate looks.
What is the difference between a backtest win rate and live trading win rate?
A backtested win rate is a statistical property of the setup, measured on historical data under defined entry and exit rules. Your live trading win rate reflects your actual execution: the prices you filled at, the exits you took, the trades you skipped. The two numbers will differ. Backtests give you a baseline expectation; live results reflect how well you execute against that baseline.
Backtest win rate is a starting point, not a finish line. The traders who use it well treat it as one input in a three-part check: win rate, average return, and sample size. Together, those three numbers tell you whether a setup has a documented historical edge worth acting on. Separately, any one of them can mislead you.
ChartMath puts all three numbers on every screen card, across 200+ curated setups on 500+ US equities, 100 crypto pairs, and 11 US futures. You don't have to build the screens, run the backtests, or write a line of code. The research is done. You bring the judgment.
If you want to see what that looks like in practice, browse the full screen library on the web for free, or download the ChartMath app on iOS or Android to get push alerts the moment a backtested setup fires on a stock you're watching. It starts with a 14-day free trial, no card required.

Ankush Jindal
LinkedInSee these setups live in ChartMath
200+ curated screens with backtest data. 14-day free trial.