How to Stop Trading on Gut and Start Using Data
Three trades in a row go your way. You start to feel it. The fourth trade, you size up a little. It loses. You size up again on the fifth because you "know" the setup is due. That one loses too. By the sixth trade, you're not following any rules. You're chasing a feeling.
That sequence plays out in retail trading accounts every single week. Not because the traders are bad at reading charts. Because they are making decisions based on confidence built from recent outcomes rather than evidence built from historical data. That is the gut-instinct trap, and getting out of it is the single most important upgrade a retail trader can make.
This guide walks through what systematic trading actually means, how to evaluate a setup using real data before you risk a dollar, and how tools like ChartMath's 200+ backtested screens give you a structured alternative to "this stock looks good."
Why Gut Instinct Feels Right (and Costs You Money)
Intuition is not random. It is pattern recognition built from experience. The problem is that trading experience is noisy. Markets are non-stationary, sample sizes are small, and outcomes are partly random. Your brain is not equipped to separate skill from luck in real time, and it does not try very hard to do so.
Two cognitive biases do most of the damage here. Recency bias makes your last three trades feel like a reliable signal about your edge. Outcome bias makes you judge the quality of a decision by whether it made money, rather than by whether the process was sound. A bad trade that happened to win teaches you the wrong lesson. A good trade that happened to lose teaches you the wrong lesson in the other direction.
The result is a feedback loop that feels like learning but is mostly noise. You adjust your process based on recent P&L rather than based on whether your decision-making was actually correct. Over hundreds of trades, that loop quietly erodes an account.
The fix is not to stop trusting yourself. It is to build a process that does not depend on how you feel on a given Tuesday morning.
What Systematic Trading Actually Means
Systematic trading gets misunderstood. It does not mean algorithmic. It does not mean automated. It does not mean you hand your account to a bot and walk away. Systematic trading means that the rules for entering and exiting a trade exist before the trade, not during it.
A systematic trade has three components defined in advance:
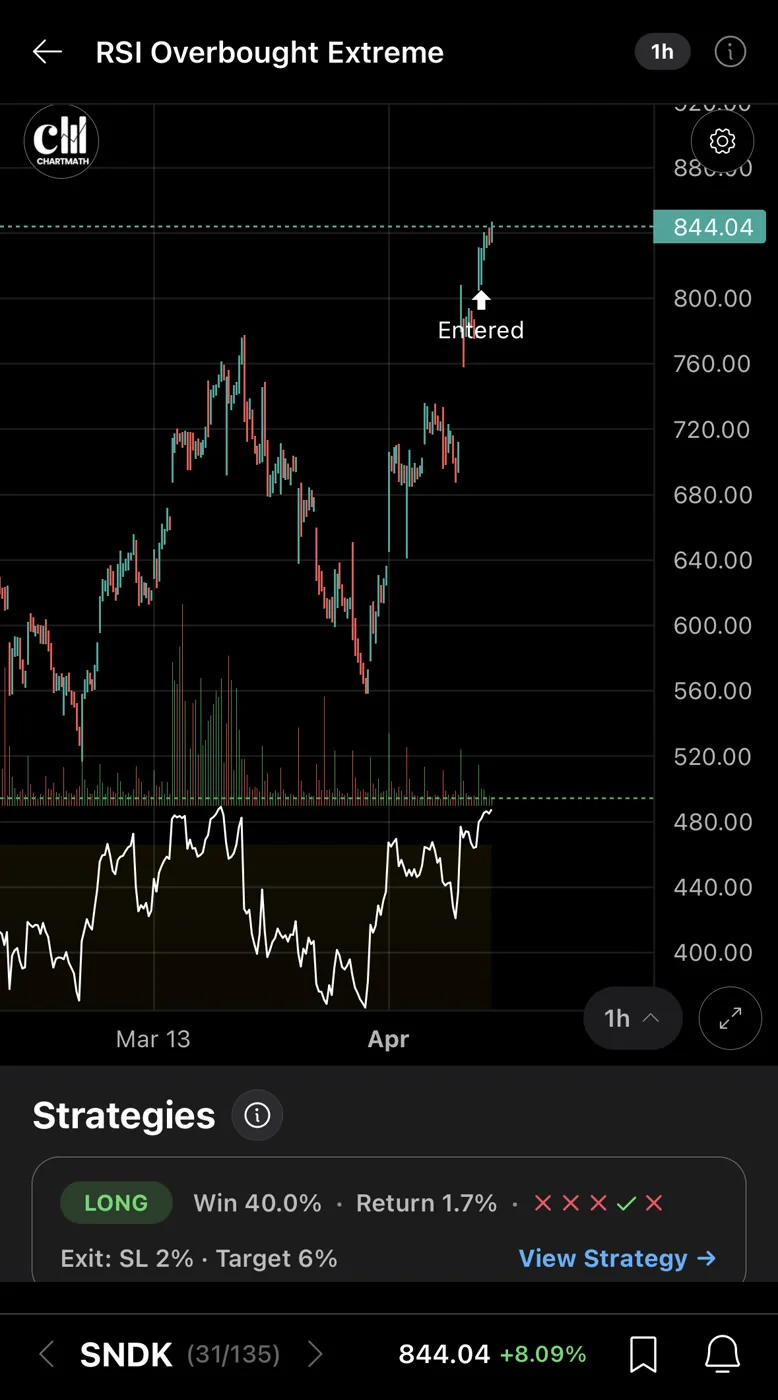
- A defined setup: a specific set of conditions that must be true before you consider entering. Not "the chart looks constructive." Something concrete: a VWAP reclaim on elevated relative volume, a 52-week high breakout on a daily close, a low-volatility compression pattern on the weekly.
- A pre-decided stop: the price level at which you are wrong, decided before you enter, not after the trade starts moving against you.
- A position size: the number of shares or contracts that limits your dollar risk to a fixed percentage of your account, regardless of how confident you feel.
That is the whole framework. Three things, decided before you click buy. Everything else, including whether the trade wins or loses, is outside your control. What you can control is whether you followed the process.
This is also the copilot model. You are still making every decision. A tool can surface the setup and show you the historical data behind it. But you decide whether to take it, how to size it, and when to exit. No tool places the trade for you. That is the point.
The First Rung: Replacing "This Looks Good" With a Backtested Setup
The phrase "this looks good" is the most expensive sentence in retail trading. It means something triggered a feeling, but you cannot name the rules that produced it, you do not know how often that pattern has worked historically, and you have no defined exit.
A backtested setup replaces that feeling with a track record. Here is what that means in practice.
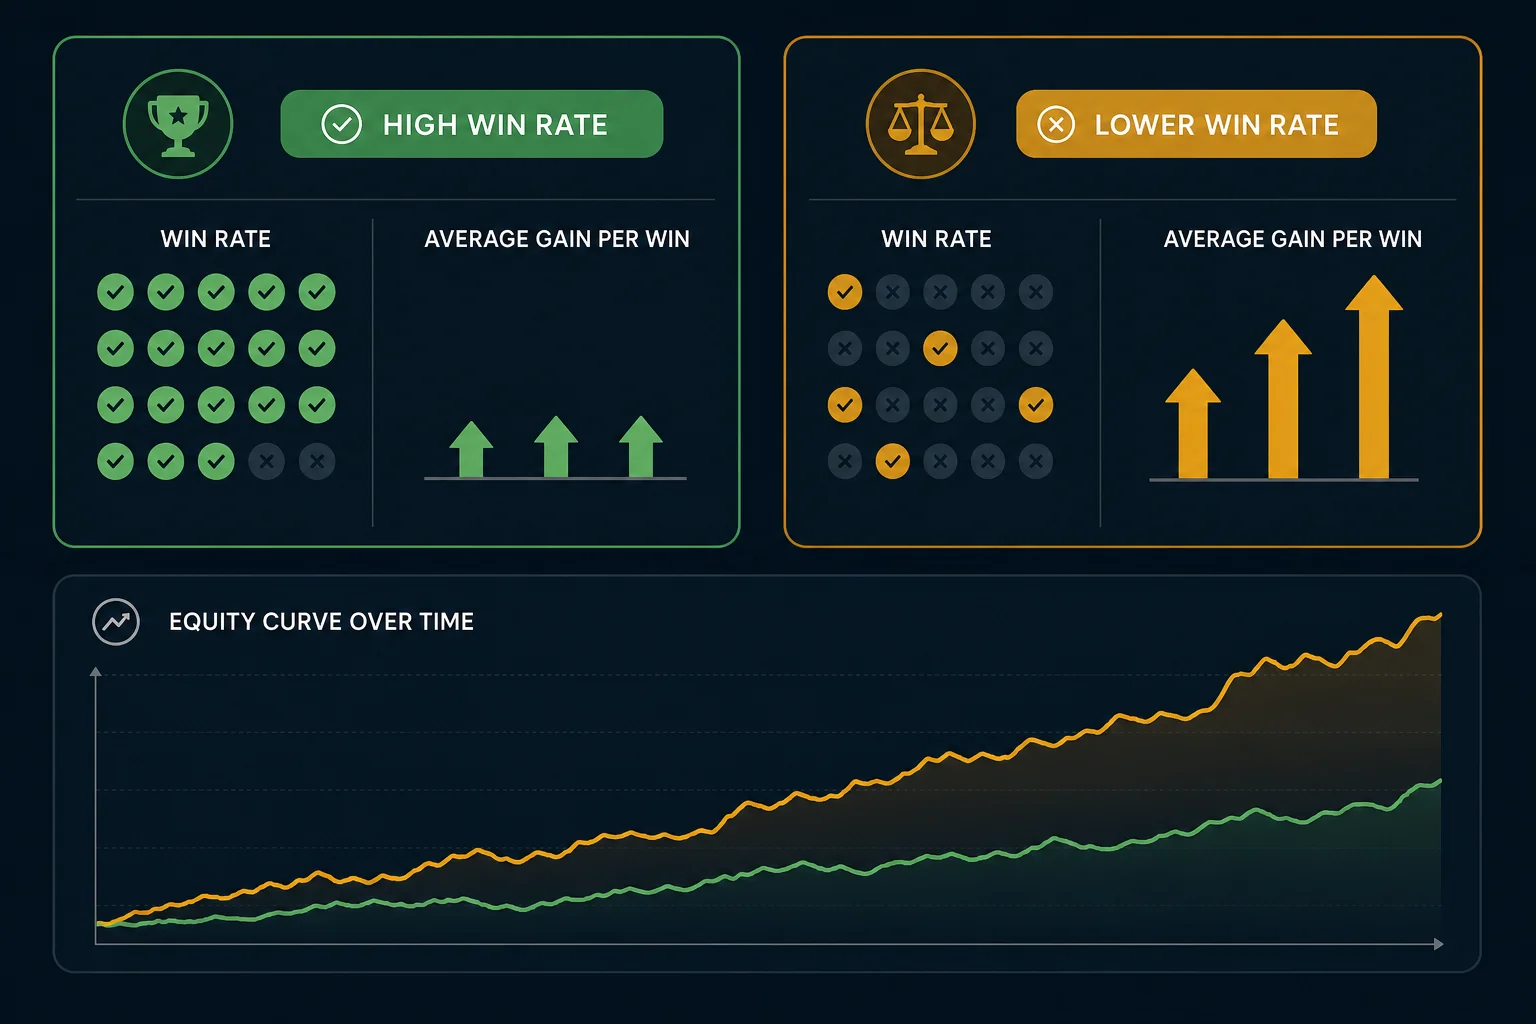
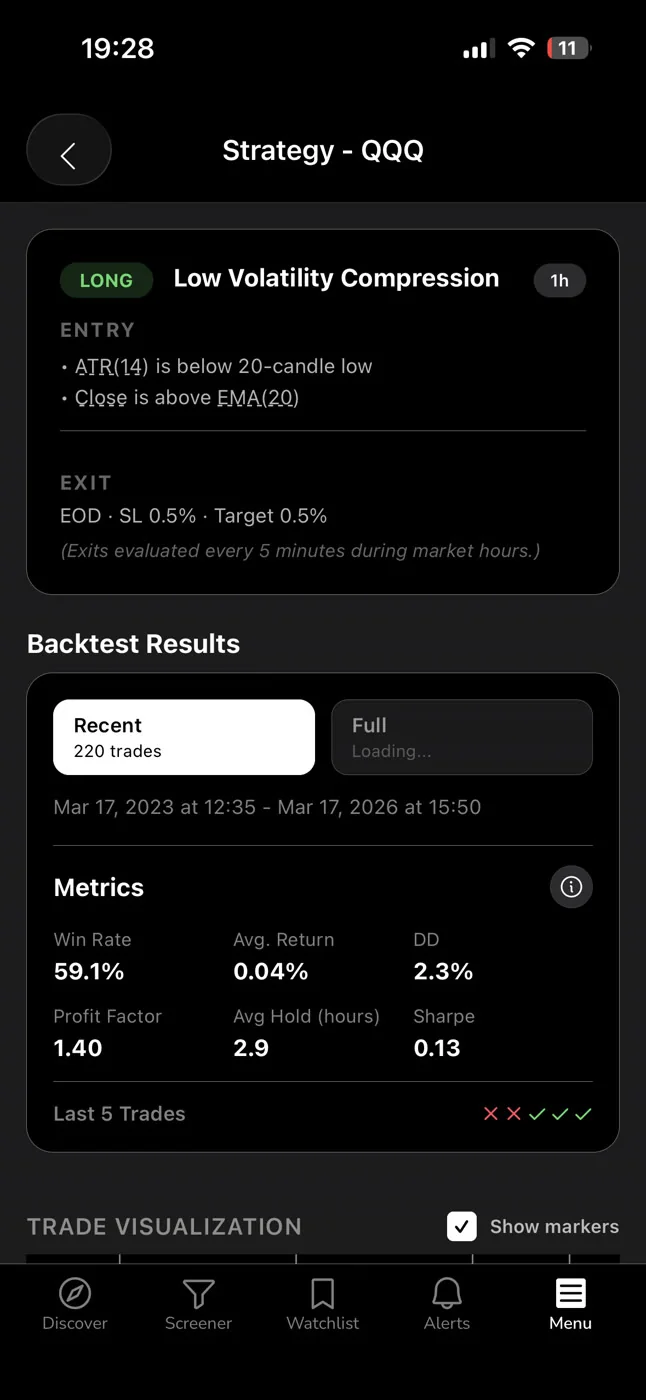
A screen is a defined set of filter rules applied to historical price data. For example: "price closes above the 20-day moving average after being below it for at least five consecutive bars, with relative volume above 1.5x the 20-day average." Every time those conditions were true in the historical data, the backtest records what happened over the next N bars. From that history, you get three numbers that matter:
- Win Rate: the percentage of historical occurrences where the trade reached the target before the stop.
- Average Return: the mean return across all historical occurrences, wins and losses combined.
- Sample size: how many historical occurrences the above numbers are based on.
Those three numbers together tell you whether a setup has a historical edge. Win Rate alone tells you almost nothing. A 70% win rate with an average return of -0.2% is a losing setup. A 45% win rate with an average return of +3.1% can be a strong one. You need both numbers, and you need a sample size large enough to trust them.
One important caveat: backtests are historical. They do not model commissions, slippage, or spread. They are a base rate, not a guarantee. A screen with a strong historical track record is a reason to pay attention, not a reason to skip your stop.
For a deeper look at how backtesting works and what makes a strategy statistically meaningful, the complete guide to building winning backtesting strategies covers the methodology in detail.
How to Evaluate a Setup Before You Risk Capital
Here is a five-step process you can run on any setup before you enter. It takes about three minutes. It replaces the gut check entirely.
Step 1: Read the Screen Rules
Before you look at the numbers, read what the screen actually requires. Do you understand the conditions that triggered this alert? If you cannot explain the setup in one sentence, you do not have enough context to trade it. A screen's filter rules tell you what the market is doing right now. That is the "why" behind the signal.
Step 2: Look at Win Rate and Average Return Together
Check both numbers. A high Win Rate with a low Average Return means the setup wins often but does not pay much when it does. A lower Win Rate with a strong Average Return means the setup needs good risk management to be profitable. Neither profile is automatically better. What matters is that you understand the trade-off before you enter.
Step 3: Check the Sample Size
A Win Rate based on 12 historical occurrences is not meaningful. A Win Rate based on 200+ occurrences is. Small samples lie. Before you trust a number, check how many trades it is based on. If the sample is thin, treat the setup as unproven and size accordingly, or skip it entirely.
Step 4: Pre-Decide Your Stop and Position Size
This step happens before you open your brokerage app. Where is the setup wrong? That is your stop. How much of your account are you willing to lose if the stop hits? That is your risk per trade. Divide risk by the distance to your stop to get your share count. Swing traders with a full-time job who skip this step are the ones who get hurt by a single bad week.
Step 5: Judge the Decision, Not the Outcome
After the trade closes, ask one question: did you follow the process? If you followed the rules and the trade lost, that is a good trade. If you broke the rules and the trade won, that is a bad trade. Grading outcomes instead of decisions is how gut instinct creeps back in. The goal is to build a process you can repeat 100 times, not to win any single trade.
How ChartMath's 200+ Backtested Screens Replace Gut-Feel Decisions
The practical problem with the framework above is that building and backtesting your own screens takes significant time and technical skill. Most retail traders do not have either. That is the gap ChartMath fills.
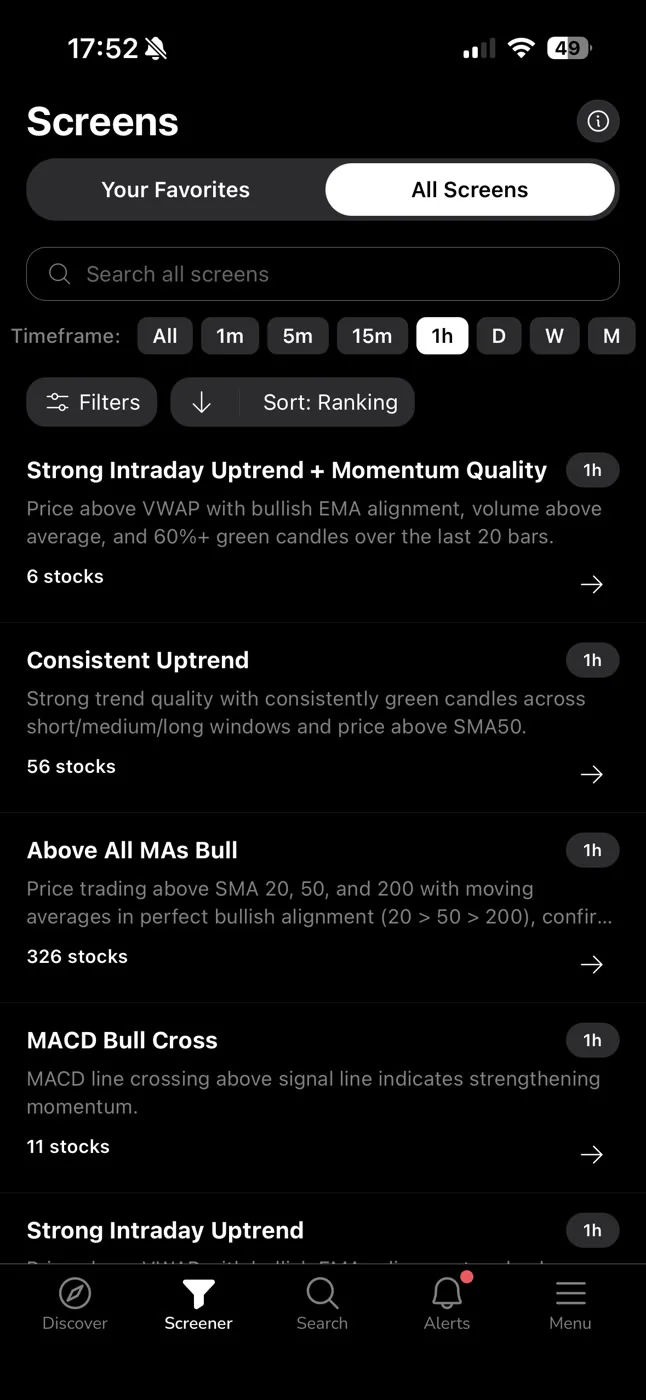
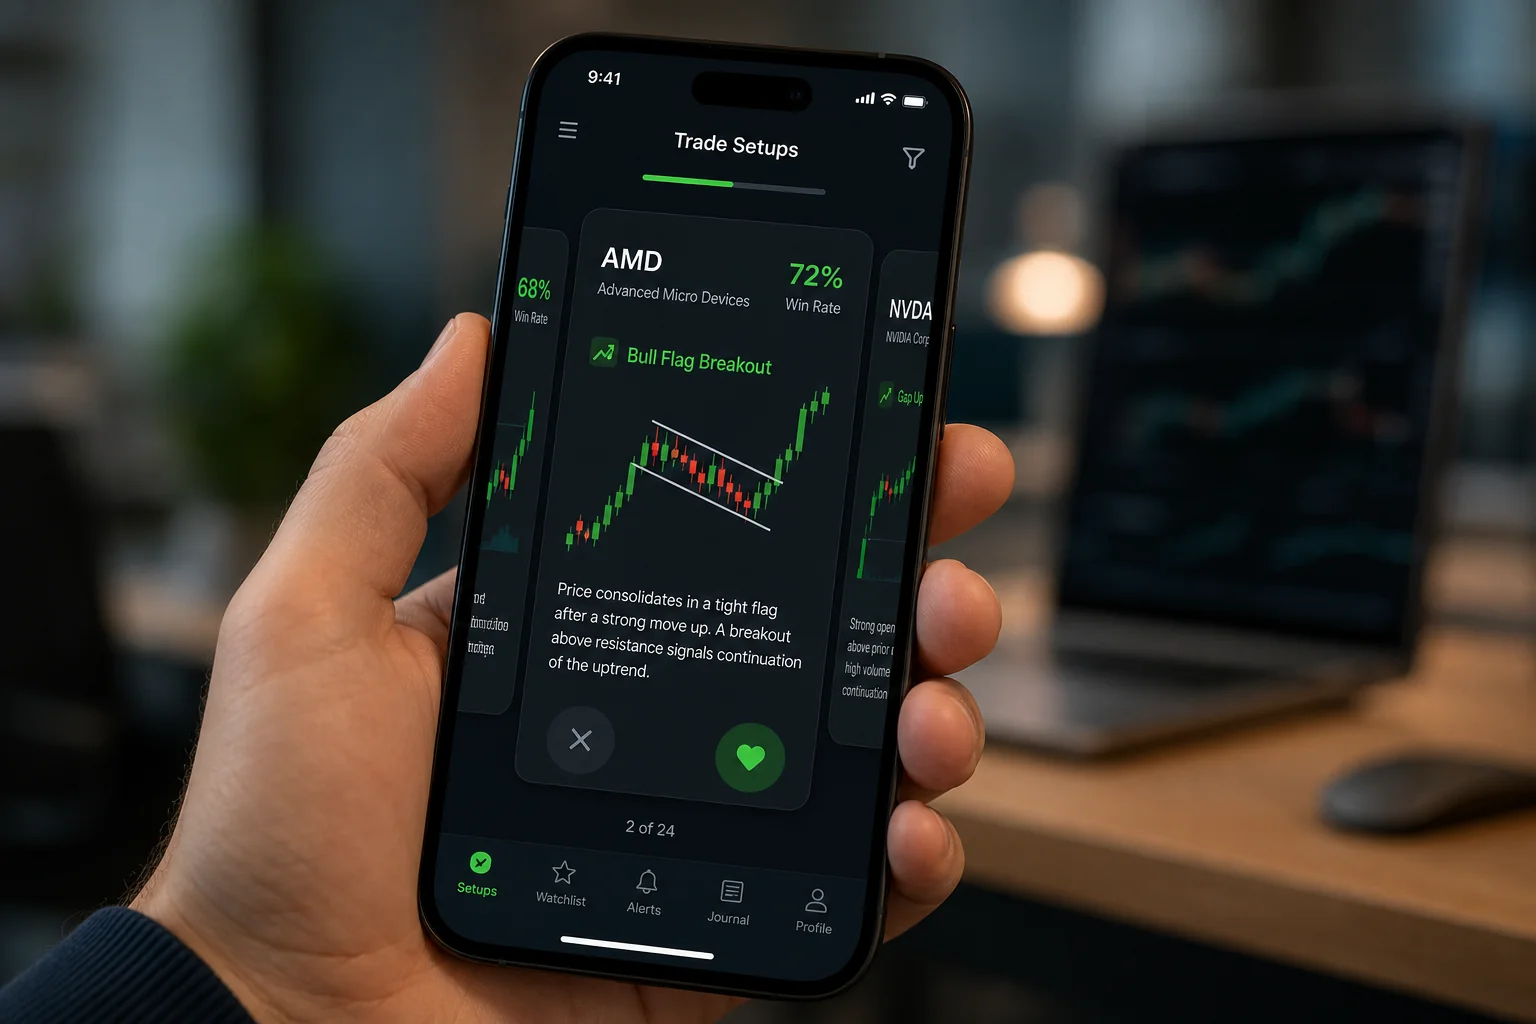
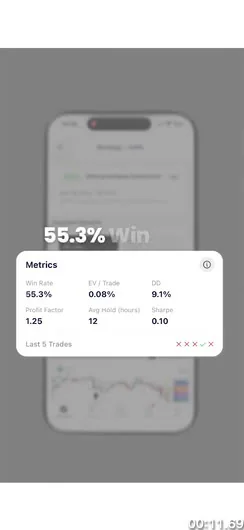
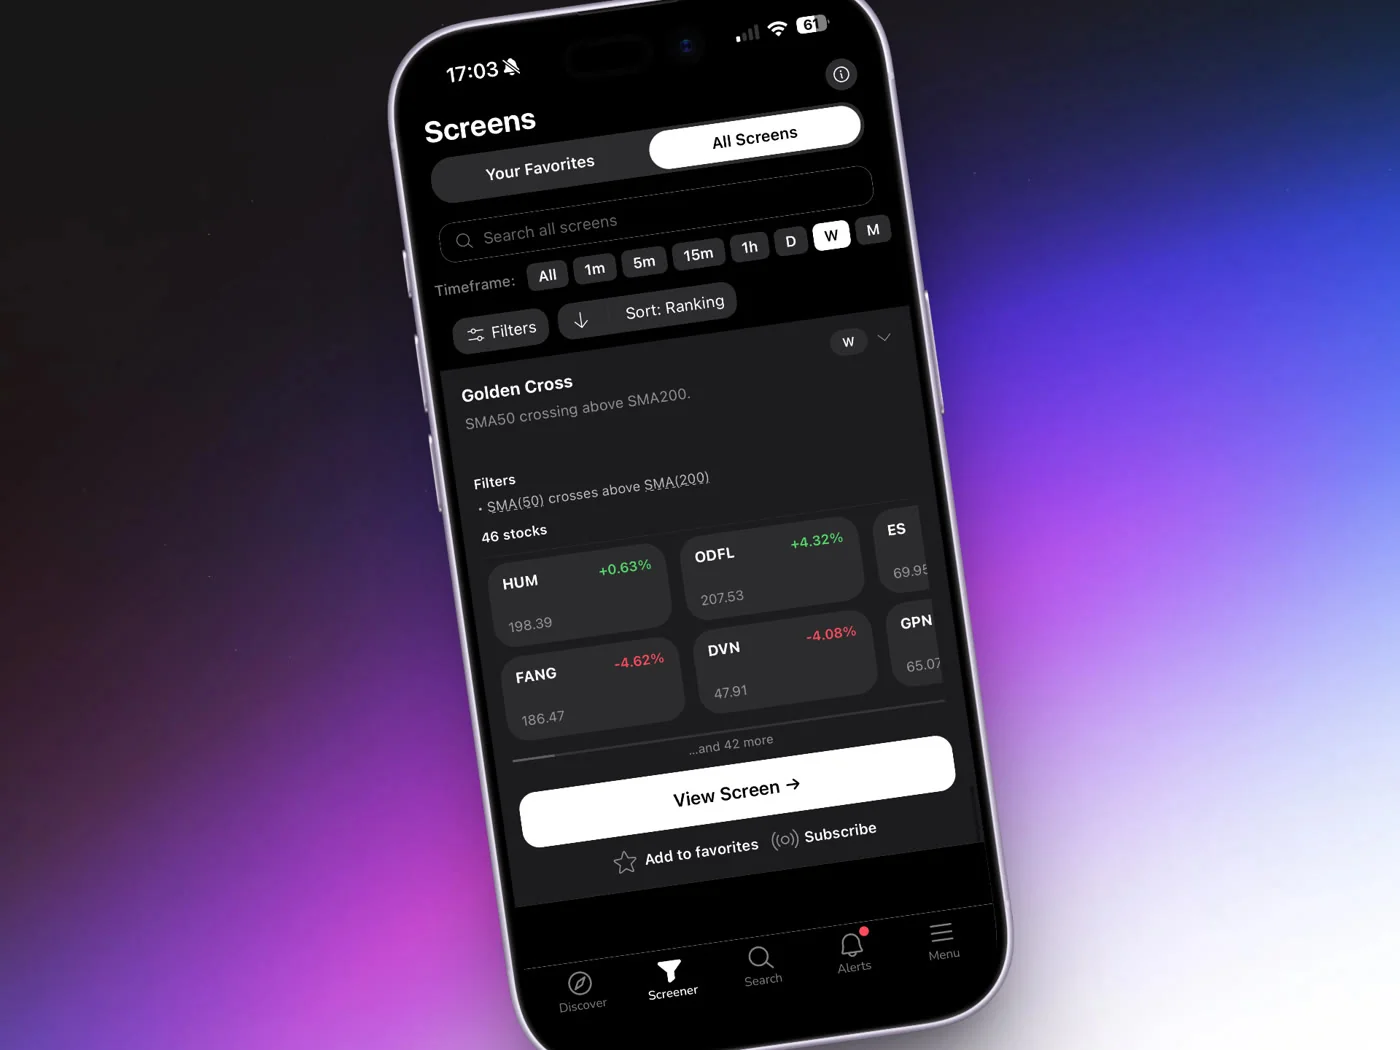
ChartMath is a mobile-first trade-discovery app built for swing traders with a day job. It scans a curated universe of 500+ US equities, 100 crypto pairs, and 11 US futures across 200+ curated, read-only, backtested screens and 7 timeframes (1m, 5m, 15m, 1h, Daily, Weekly, Monthly). Every screen in the app has already been backtested. Every one shows its Win Rate, Average Return, EV, and sample size. You do not build screens. You do not write Pine Script. You do not code anything. You pick from screens that already have a verified track record.
Here is how the app maps to the systematic framework above:
- Defined setup: each screen's filter rules are written in plain English inside the app. You can read exactly what conditions triggered the alert before you decide whether to act.
- Historical edge: Win Rate, Average Return, EV, and sample size are shown on every screen card. The data is there before you risk a dollar.
- No gut required: the Discover feed surfaces setups ranked by backtested reliability and recency. You swipe through explainable setup cards instead of scrolling through charts hoping something catches your eye.
- Alerts without chart-watching: push alerts fire the moment a ticker enters a screen you follow. You get the notification on your phone, check the screen rules and metrics, and decide. No need to watch charts during the workday. For traders who need to stay away from screens during market hours, the guide to trading without watching screens all day covers the full workflow.
ChartMath is a copilot, not an autopilot. It has no broker connection and places no orders. You execute in your own brokerage. The app's job is to surface setups with a documented track record so your decision is based on evidence, not on how the chart "feels."
You can browse all 200+ screens right now at chartmath.com/screens without signing in. The web layer is free and read-only. The full Discover feed, alerts, and watchlist are in the iOS and Android apps at chartmath.com/app.
ChartMath starts with a 14-day free trial — no card to start. After the trial it's $24.99/month founding pricing (locked for 12 months) or $149/year.
For traders who are also evaluating other tools, the comparison of stock scanners without Pine Script covers what you gain by skipping the coding requirement entirely.
Building the Habit: A Simple Systematic Checklist
Knowing the framework is not the same as using it. The gap between understanding systematic trading and actually trading systematically is a habit gap. Here is a minimal checklist that closes it.
Before Every Trade
- Name the setup. Which screen triggered this? What are the filter rules?
- Check Win Rate and Average Return. Are both acceptable to you?
- Check sample size. Is the track record meaningful?
- Write down your stop level before you open your brokerage app.
- Calculate your position size based on your risk per trade, not on how confident you feel.
After Every Trade
- Did you follow the checklist? Yes or no.
- If no, what broke down? Write it down.
- Do not grade the trade on P&L alone.
Weekly
- Review your checklist compliance rate, not your win rate.
- If you followed the process on 8 out of 10 trades, that is a good week regardless of P&L.
- Identify the one thing that caused you to break the rules and address it specifically.
This checklist takes less than five minutes per trade. It is the difference between trading systematically and trading with a systematic-sounding story you tell yourself after the fact.
For a broader look at how to structure your trading time efficiently, the guide to building an efficient trading workflow covers the full daily and weekly routine.
Common Mistakes When Switching From Gut to Data
Most traders who try to go systematic make the same handful of mistakes in the first few weeks. Knowing them in advance saves you from learning them the expensive way.
Cherry-Picking High Win Rates Without Checking Sample Size
A screen with a 78% Win Rate based on 11 historical occurrences is not a strong setup. It is a small sample that happened to go well. Always check sample size alongside Win Rate. A 58% Win Rate based on 300+ occurrences is a far more reliable number than a 78% Win Rate based on 11.
Abandoning the System After One Losing Trade
A setup with a 60% historical Win Rate will lose 40% of the time. That is not a flaw. That is the base rate. If you abandon the system after the first loss, you are not trading systematically. You are trading gut instinct with extra steps. Give any process at least 20 to 30 trades before drawing conclusions about whether it works.
Treating Win Rate as a Guarantee
Backtested Win Rate is a historical base rate. It tells you what happened in the past under those conditions. It does not guarantee the next trade wins. Markets change. Conditions shift. The Win Rate is a reason to pay attention, not a reason to skip your stop or oversize your position.
Ignoring Position Sizing
A great setup in the wrong size is still a bad trade. One oversized loss can undo two weeks of disciplined, process-driven trading. Position sizing is not optional. It is the mechanism that keeps a losing streak from becoming a catastrophic drawdown. Risk a fixed percentage of your account per trade, every time, regardless of conviction level.
Confusing a Busy Alert Feed With a Systematic Process
Getting 40 alerts a day is not systematic trading. It is alert noise. A systematic process means you have defined which screens you follow, why you follow them, and what you will do when they fire. More alerts without a decision framework just adds stress. A structured workflow keeps the signal-to-noise ratio high.
Frequently Asked Questions
Do I need to know how to code to use backtested screens?
No. ChartMath's 200+ screens are pre-built and read-only. There is no Pine Script, no coding, and no screen builder. You browse the screens, check the metrics, and decide which ones to follow. The technical work is already done.
What is the difference between Win Rate and Accuracy?
They sound similar but mean different things in this context. Win Rate is the percentage of historical occurrences where the trade reached the target before the stop, based on a defined exit rule. "Accuracy" is a vague term that different tools define differently and that often ignores the size of wins versus losses. ChartMath uses Win Rate and Average Return together, because both numbers are needed to assess whether a setup has a real edge.
How many screens should I follow at once?
Start with three to five screens that match your trading style and timeframe. Following 40 screens at once produces alert volume that is hard to act on systematically. Narrow your focus, learn the behavior of a small number of setups, and expand from there once you have a feel for how each one performs in different market conditions.
Does a high Win Rate mean I will be profitable?
Not on its own. Profitability depends on Win Rate, Average Return, and position sizing working together. A high Win Rate with a poor Average Return, or a good setup traded in inconsistent sizes, can still produce a losing account. The guide to backtesting strategies covers how to read these numbers together.
Is ChartMath free to use?
ChartMath is a paid product with a 14-day free trial — no card to start. After the trial it's $24.99/month founding pricing (locked for 12 months) or $149/year. You can browse the screen library at chartmath.com/screens right now without signing in, or download the app at chartmath.com/app to get the full Discover feed and push alerts.
The move from gut-feel trading to data-driven trading is not a personality change. It is a process change. You replace "this looks good" with a screen that has a documented track record. You replace confidence-based sizing with a fixed risk percentage. You replace outcome-based grading with process-based grading. Each of those swaps is small. Together, they produce a trading practice that compounds over time instead of one that oscillates with your mood.
If you want to see what a backtested setup actually looks like before you commit to anything, browse the full screen library at chartmath.com/screens. Every screen shows its filter rules, Win Rate, Average Return, and sample size. No sign-in required. When you are ready to get alerts the moment a setup fires, download the app at chartmath.com/app and start building a process that does not depend on how you feel.

Ankush Jindal
LinkedInSee these setups live in ChartMath
200+ curated screens with backtest data. 14-day free trial.