Best Free Stock Screener for Active Traders: What You Get (and What You're Missing)
The best free stock screener for active traders is really three or four different tools stitched together, because no single free tier covers real-time delivery, a backtested win rate, and push alerts to your phone at once. Finviz, TradingView's free plan, Yahoo Finance, and Zacks each solve one piece of the puzzle. Once you're hand-scanning dozens of tickers around a day job, the gaps between those pieces are where trades get missed.
Key Takeaways
- Free tools cover real ground: Finviz's fundamental filters, TradingView's charting, Yahoo's quotes, and Zacks' rank system each do their job well. None were built to alert you the moment a technical setup fires.
- Data freshness is the first wall: most free screeners run on end-of-day or delayed data, which means the list you're scanning reflects yesterday's close, not the current bar.
- Alert caps are the second wall: free plans typically limit alert count or only fire while a browser tab is open, so you're back to refreshing at your desk.
- A screen without a win rate is a hunch: a filter that returns tickers isn't the same as a rule that's been tested against historical bars and has a sample size you can inspect.
- Check five things before you pay for anything: phone delivery, visible win rate and sample size, real-time vs. delayed data, a bounded universe instead of manual scanning, and a plain-English reason for every alert.
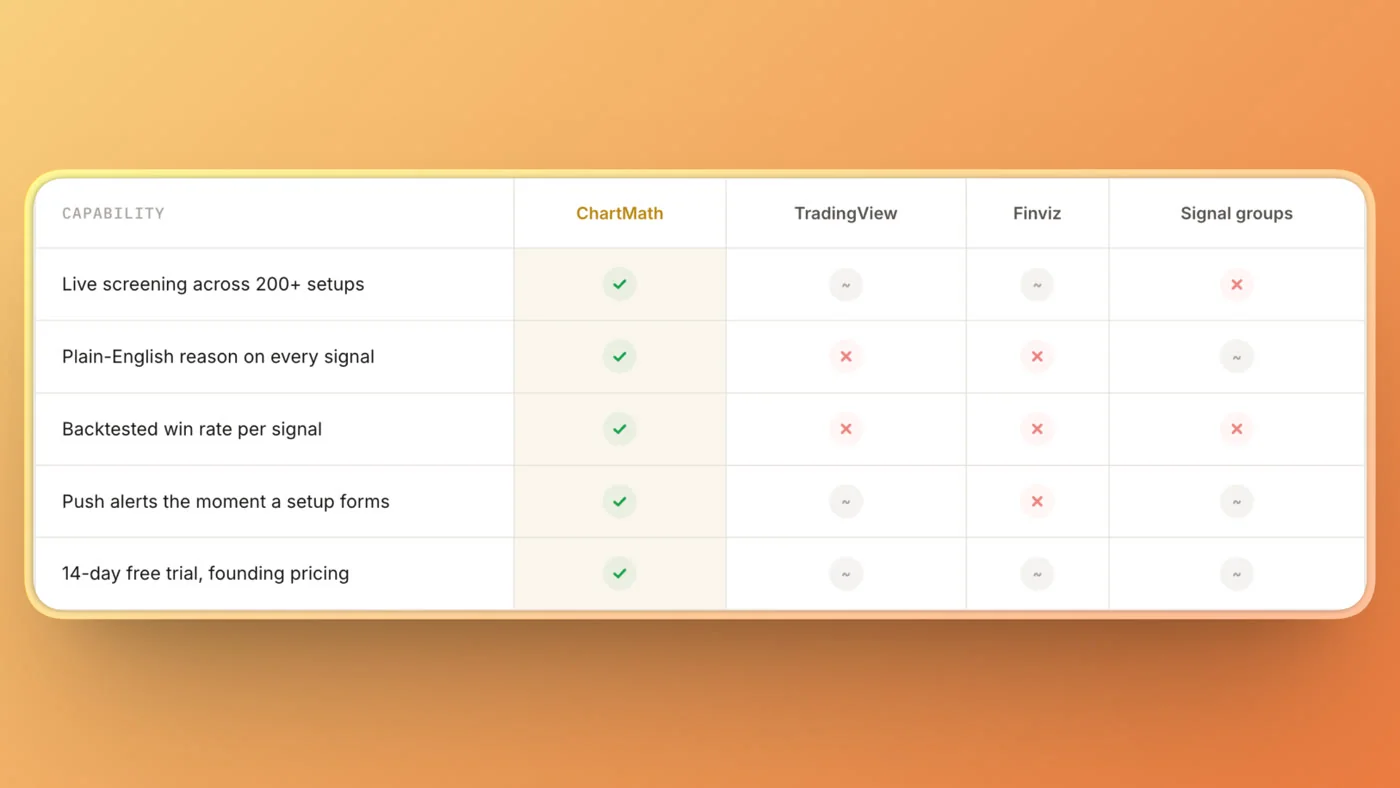
At a Glance: Free Screener Capability Map
| Tool | Data Freshness | Alert Delivery | Backtested Win Rate Per Screen | Mobile Push | Universe |
|---|---|---|---|---|---|
| Finviz (free) | End-of-day for most filters | None built in | No | No | Broad US equity list, self-filtered |
| TradingView (free) | Real-time on some exchanges, delayed on others | Capped, browser/app dependent | No | Limited | Broad, user-defined |
| Yahoo Finance | Near real-time quotes for US large caps | None systematic | No | No | Broad, manual lookup |
| Zacks (free) | End-of-day | None built in | No (fundamental rank, not a technical backtest) | No | Broad, fundamental focus |
| Research-first screener (e.g. ChartMath) | Runs continuously against live bars intraday | Push and email, no browser required | Yes, win rate and sample size shown per screen | Yes, mobile-first | Bounded and curated: 500+ US equities |
You've Already Refreshed Finviz 47 Times Today
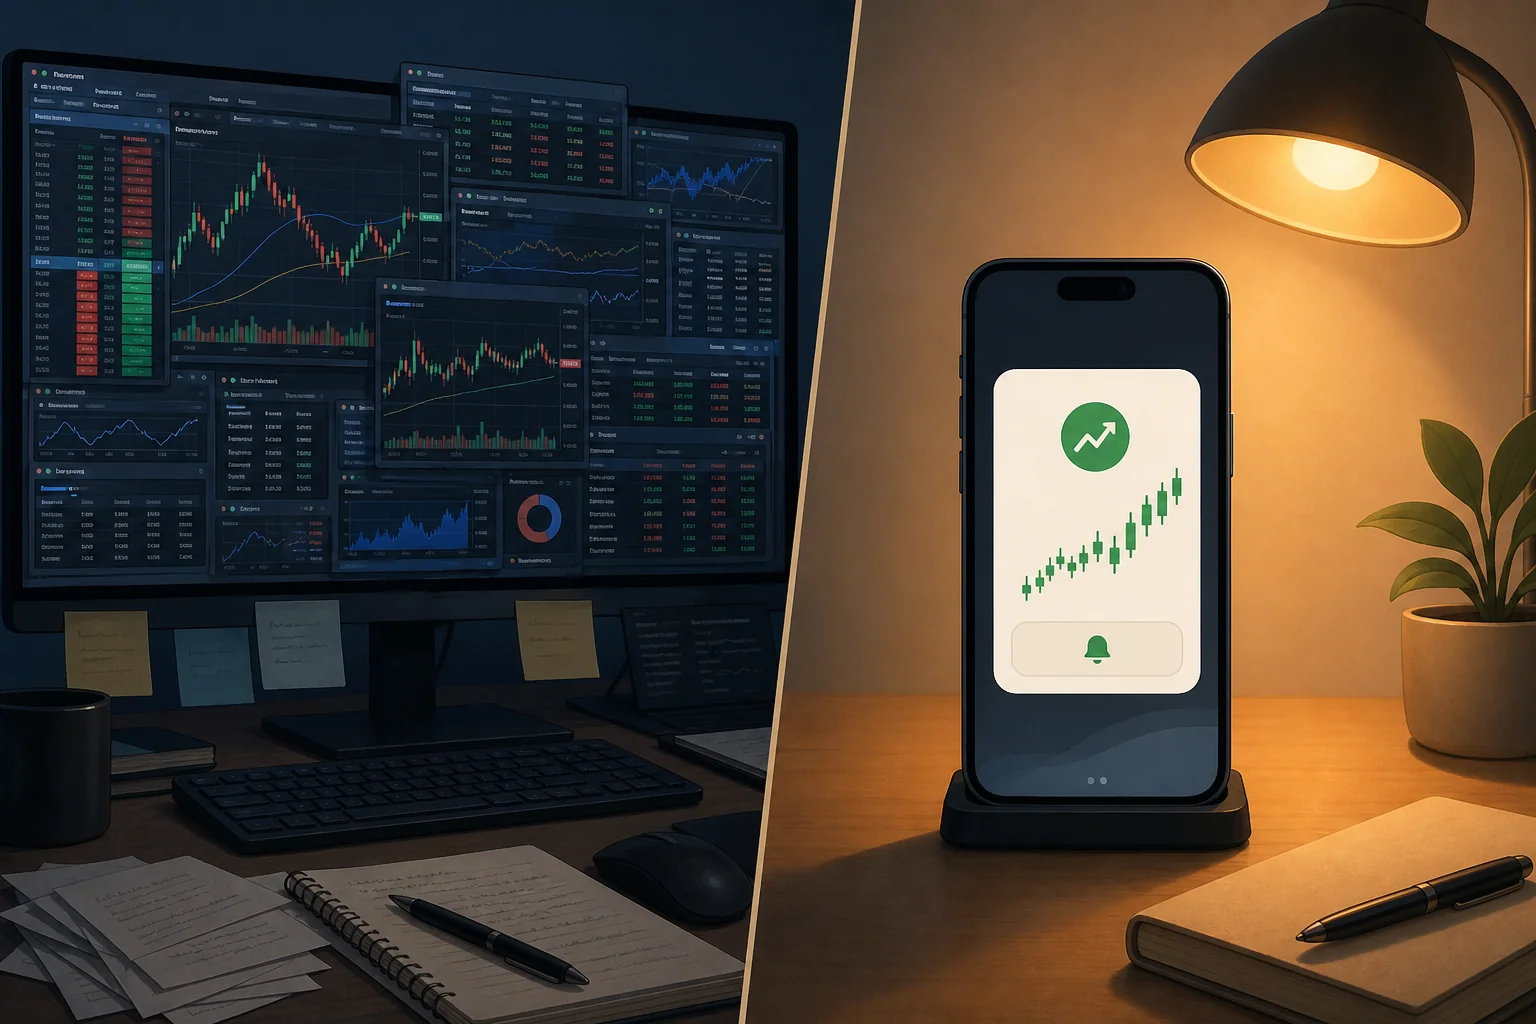
It's 2:15 PM. You're between calls, phone in one hand, Finviz open in the other tab, and you've now checked the same 30 tickers four separate times since lunch. Nothing has changed since the last refresh, or maybe it has and you just missed the five minutes it mattered. This isn't a knock on you. It's what hand-scanning looks like when you have a full-time job and a watchlist that won't watch itself.
Free screeners aren't a trap. Finviz, TradingView's free plan, Yahoo Finance, and Zacks are genuinely useful products that millions of retail traders rely on daily, and they deserve credit for what they do well. The honest question isn't "are free screeners bad." It's narrower than that: where specifically does a free tier stop being enough once you're trading actively, not just browsing charts on a Sunday? That's the line this guide maps out, tool by tool, wall by wall.
What Finviz, TradingView, Yahoo, and Zacks Actually Give You Free
Each of these tools earns its spot in a trader's browser bookmarks for a specific reason. Knowing exactly what each one is good at is the first step to knowing what it isn't built for.
Finviz's free screener is strong for fundamental and basic technical filtering across a huge list of US equities. You can filter by market cap, sector, P/E, moving average relationships, and dozens of other fields, then sort the results into a static list. It's fast and it's free, and for a trader building a shortlist once or twice a day, it's a solid first pass. The catch: most of that data updates end-of-day, and there's no alerting layer. You pull the list, you don't get pinged when the list changes.
TradingView's free plan is arguably the best free charting tool available anywhere, with custom indicators, drawing tools, and a large library of community scripts. Some US exchange data is real-time; other feeds are delayed depending on your plan and exchange agreements. Alerts exist, but the free tier caps how many you can run at once, and reliable delivery often depends on keeping the app open or the browser tab active. There's no backtested win rate attached to a screen you build. You get the chart. You don't get a track record.
Yahoo Finance gives you free quotes that are close to real-time for major US large caps, a basic screener, and portfolio tracking that's genuinely convenient for checking positions between meetings. It's not built for systematic scanning or alerting across a watchlist of dozens of names. It's a lookup tool, not a discovery engine.
Zacks' free tier centers on its fundamental Zacks Rank system and earnings-focused screens, which is useful if your process leans fundamental. It's end-of-day, has no technical alerting, and isn't built for the kind of intraday or multi-day technical setups a swing trader is watching for.
All four of these do their specific job well. None of them were built to scan continuously, attach a historical win rate to a setup, and push that alert straight to your phone. That combination is the specific gap active traders run into, and it's worth understanding exactly why.
What's the Difference Between a Real-Time Scanner and an End-of-Day Screener?
This is one of the most common questions traders type into Google when comparing tools, so it's worth answering plainly. An end-of-day screener runs its filters once the market closes, using that day's final prices and volume. You get your results after the close, or the next morning before market open. It's a snapshot, not a stream.
A real-time scanner runs its filters continuously during the session, checking live price and volume as new bars form on whatever timeframe you're watching, whether that's a 1-minute, 5-minute, or hourly chart. When a stock crosses your threshold at 10:47 AM, a real-time scanner can flag it at 10:47 AM. An end-of-day screener won't show you that name until tomorrow's list, by which point the move may already be over.
For a swing trader working entries measured in hours, not days, that gap matters. A setup that formed intraday and resolved by the close is invisible to an EOD tool entirely. This isn't a flaw in Finviz or Zacks. Their free tiers are built around EOD data by design, because that's what serves their broader fundamental and long-term screening audience. It's just a mismatch for someone trying to catch a VWAP reclaim or a relative-volume breakout while it's still forming.
Where Active Swing Traders Hit the Wall on Free Tiers
If you're checking charts a couple of times a day, the tools above will carry you fine. The wall shows up once your process gets more active: more tickers on the watchlist, more setups you're trying to track, and a job that doesn't let you stare at a screen from 9:30 to 4.
- Delayed or end-of-day data: you're trading yesterday's setup on today's open, and by the time you confirm it on the free tool, the early move is already priced in.
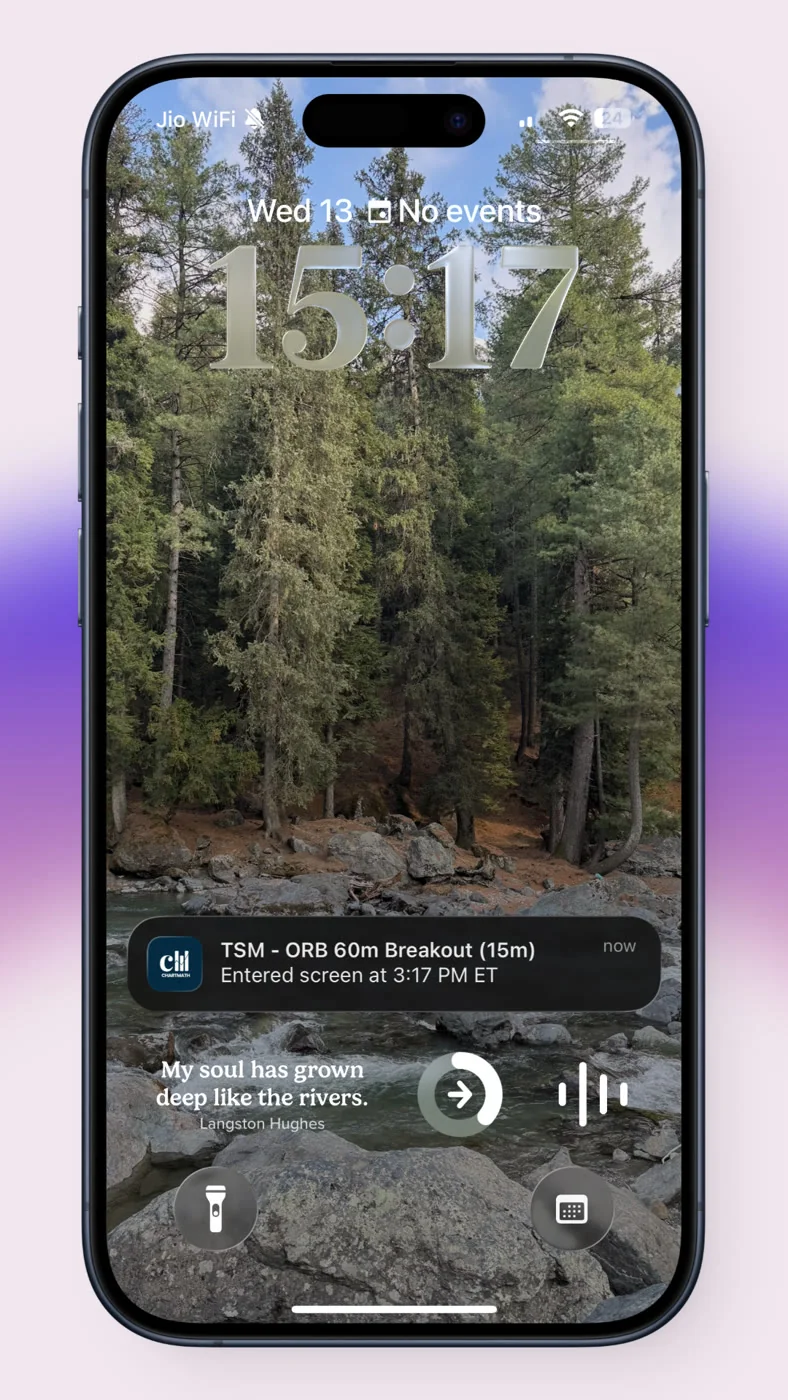
- Alert caps and browser dependence: most free alert systems either limit how many you can run or only fire reliably while the app or tab stays open, which defeats the point if you're in meetings all day.
- No backtested win rate behind a screen: a filter tells you a stock matches certain criteria right now. It doesn't tell you whether stocks matching those same criteria historically worked out more often than not.
- Desktop-bound workflows: without true push-to-phone delivery, you're back to opening a browser tab between meetings, which is the exact refresh loop most active traders are trying to escape.
- Alert fatigue once you do add alerts: generic price or volume triggers with no context fire constantly and teach you to ignore your phone, which defeats the purpose of having alerts at all.
None of this means the free tools are broken. It means they were built for a broader, less time-constrained audience, and an active trader with a day job needs something that closes those specific gaps: fresher data, reliable phone delivery, and a way to know if a setup has actually worked before.
A Screen Is Only as Good as the Rule Behind It
Here's the part most screener comparisons skip. A "screen" that returns a list of tickers matching some criteria is not the same thing as a systematic setup. The difference is whether that criteria has been tested against historical price bars to produce a win rate and an average return, and whether that result comes from a sample size large enough to mean anything.
A backtested win rate is not a promise about the future. It's a measurement of how a specific, deterministic rule performed the last time it appeared across a defined set of historical bars. If a screen has only fired 12 times in the data, that number should carry a lot less weight than one built on hundreds of occurrences. Small samples are exactly how traders talk themselves into a false edge after four good trades in a row, then wonder what happened when the next six don't work.
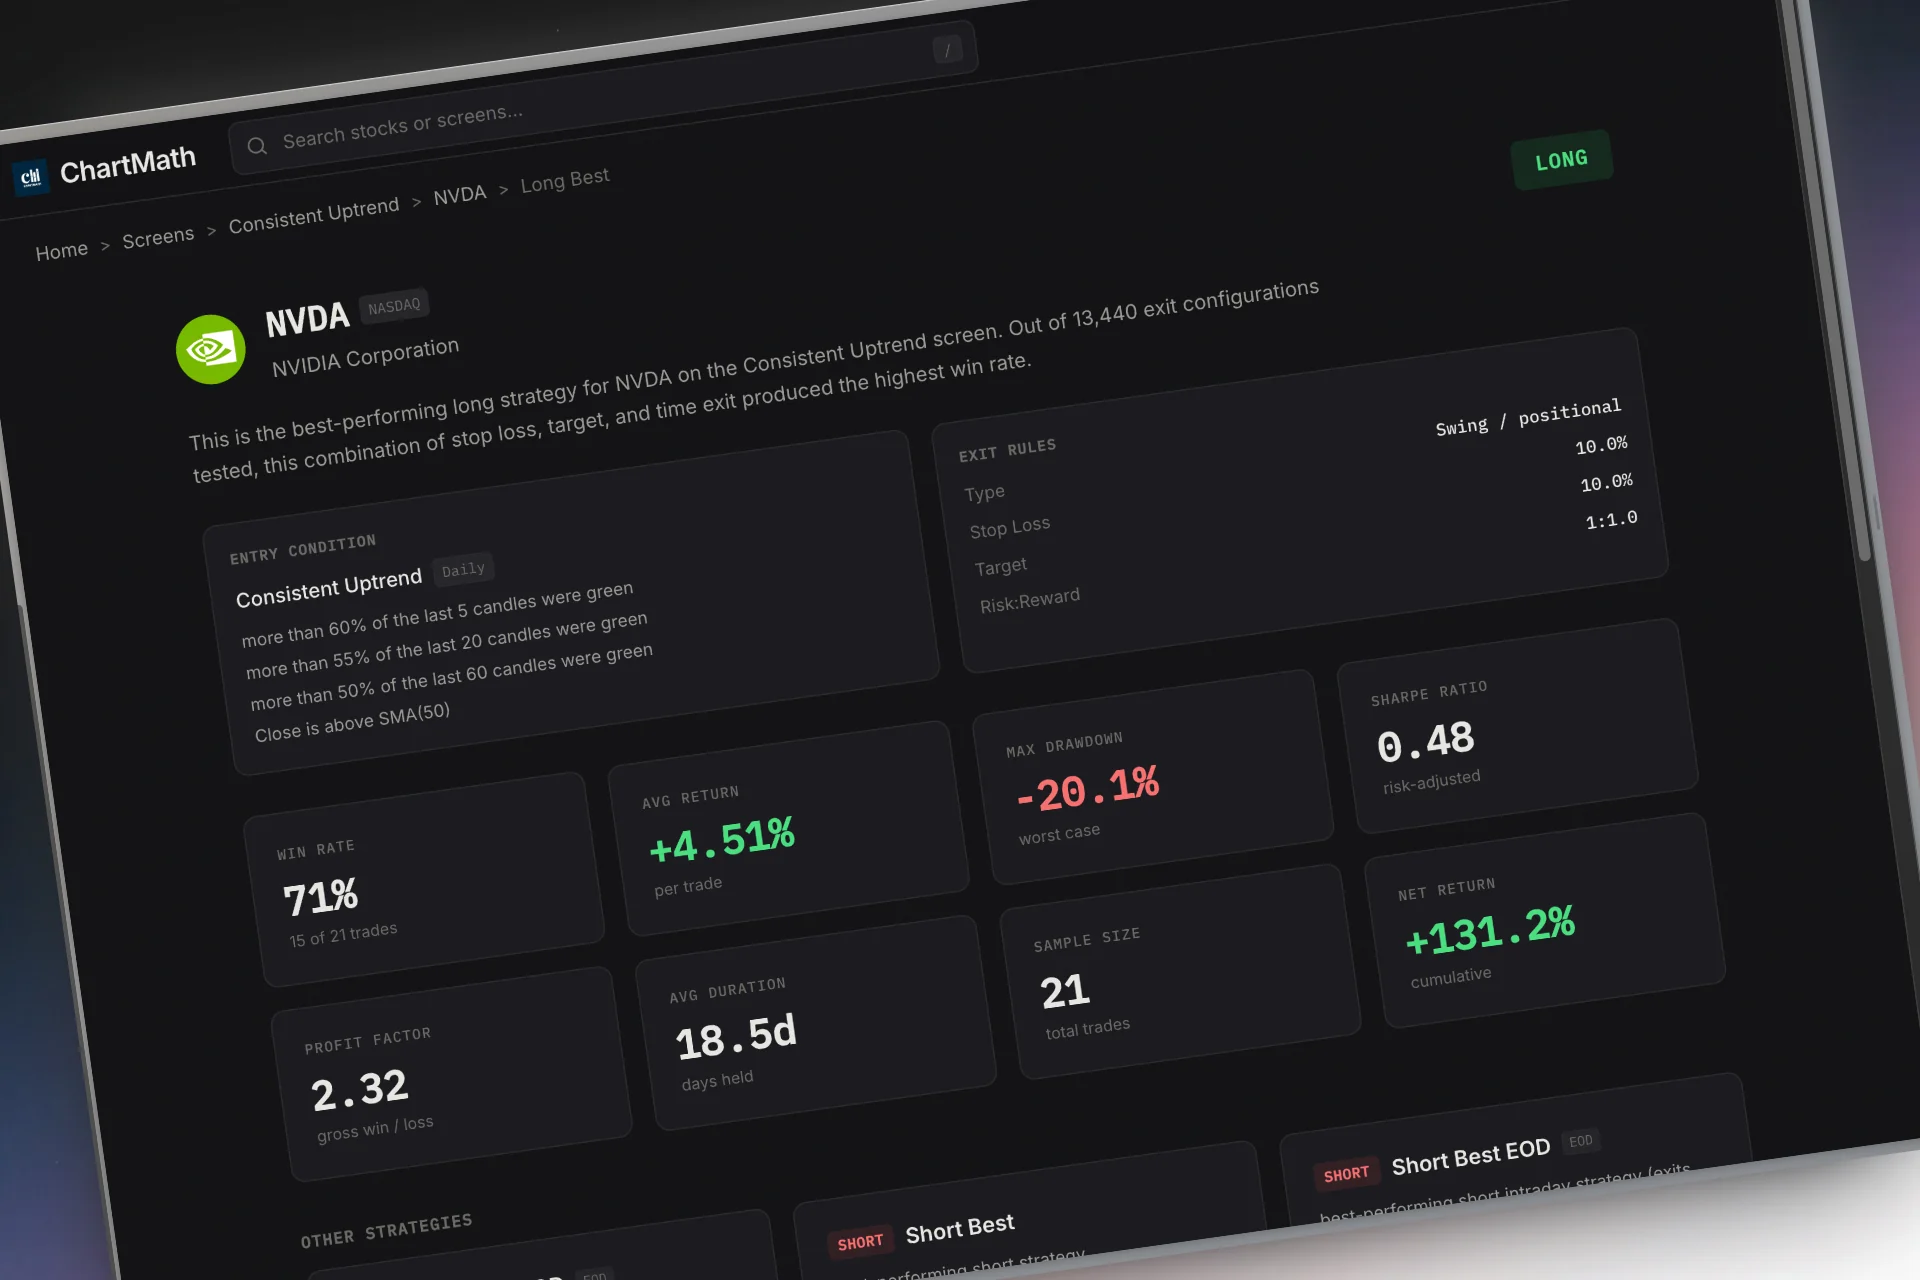
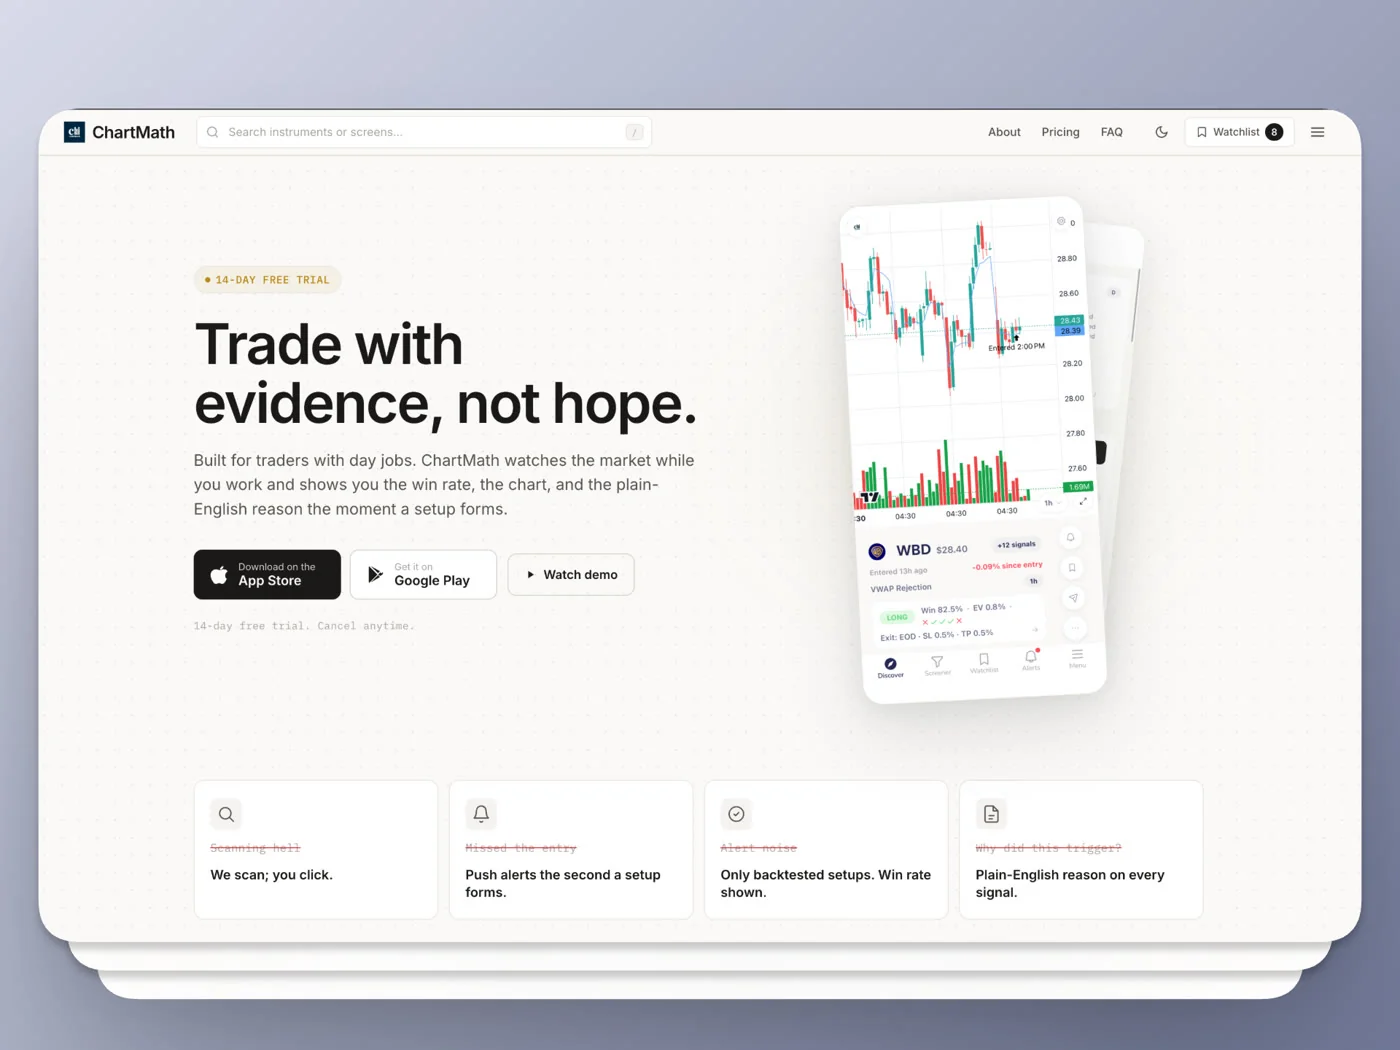
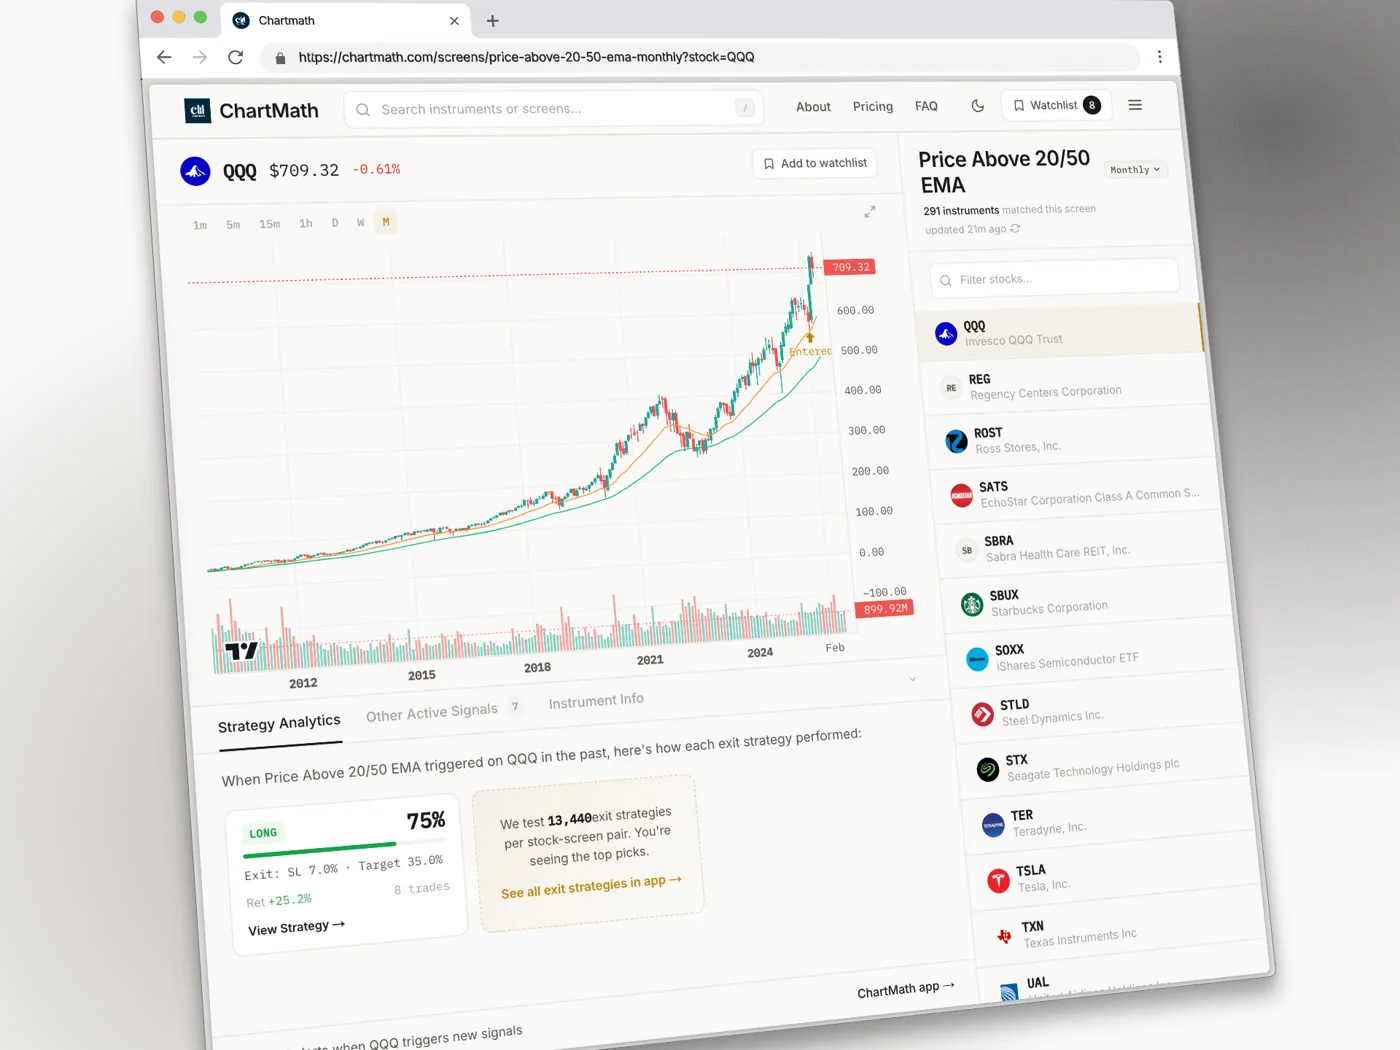
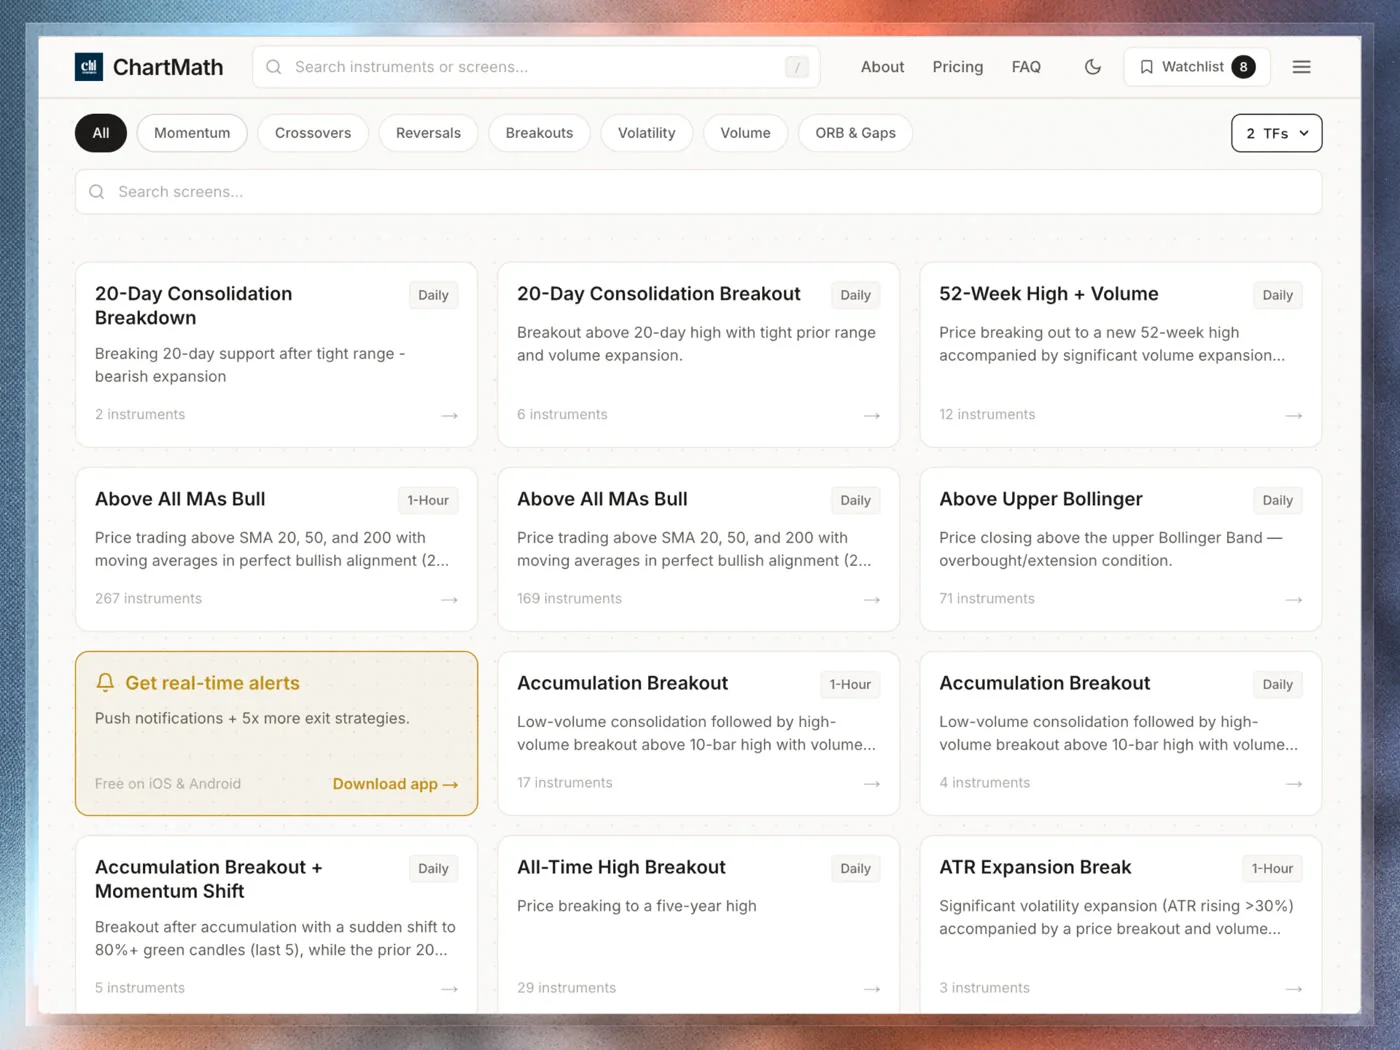
This is the structural piece that's missing from Finviz, TradingView's free filters, Yahoo, and Zacks: none of them attach a recomputable historical track record to the rule itself. That's the specific gap ChartMath was built to close. Instead of a filter you build yourself, ChartMath runs 200+ curated, read-only technical screens against a bounded universe of 500+ US equities, across timeframes from intraday to monthly. Every screen shows its historical win rate and average return over the matched sample, so you can see the evidence behind a setup, not just a list of names that happen to match a condition today.
It's worth being precise about what this is and isn't. ChartMath is a trade discovery tool, a research copilot, not an autopilot. It narrows a bounded universe down to setups worth a second look and explains in plain English why each one fired. You still decide whether to take the trade, size the position, and place the order in your own brokerage. Nobody is executing anything on your behalf. If you want to see what that looks like on an actual setup before changing anything about your current process, the web-based screener is browsable without an account.
5 Things to Check Before You Pay for Any Stock Screener
Whether you stick with free tools or start evaluating a paid one, run through this checklist first. It's built from the exact gaps active swing traders hit, not a generic feature list.
- Does the alert actually reach your phone? Not "does it have a notification setting," but does it fire the moment the setup matches, without you needing an app or browser tab open at that exact minute.
- Does every screen show a win rate and sample size you can inspect? A tool that just describes a filter in words ("stocks above their 50-day moving average with rising volume") isn't the same as one showing you how that exact rule performed historically, and over how many instances.
- Is the data real-time or intraday for the timeframes you actually trade? If you're trading 5-minute or 15-minute setups, end-of-day data is close to useless no matter how good the filtering logic is.
- Can it point you at a bounded, curated universe instead of you hand-scanning 50 to 100 tickers? The value of a screener collapses if you still have to manually check every name it surfaces against your own criteria before trusting it.
- Does it explain why a setup fired, in plain English? A ticker symbol with no context is a puzzle. A note that says which rule matched, on which timeframe, and how that rule has performed historically is something you can actually evaluate in the ten seconds you have between meetings. This is the same gap covered in more detail in how to read a trading signal before you risk money.
Real-Time Scanning Alerts and Why Traders Look for a Community Around Them
A common search pattern among active traders is something like "real time stock scanner breakout alerts community," which usually means one thing: traders want a live signal source, and they want some sense that other people are watching the same setups. That instinct makes sense, but it's worth separating two very different things that often get lumped together.
An unvalidated signal group, whether it's a Discord server or a Telegram channel, gives you a call and a personality behind it. What it typically doesn't give you is a documented, recomputable win rate for the exact rule behind that call, or a way to check how many times that setup has fired historically and how it resolved. The "community" feeling can be real, but it's not the same as evidence.
A backtested screen replaces the social layer with a measurable one. Instead of trusting a person's track record from memory, you're looking at a rule applied consistently to historical data, with a win rate and sample size attached. That doesn't mean human judgment goes away. It means the starting point is a number you can check rather than a call you have to take on faith. If you're weighing this tradeoff directly, testing a setup in a paper account first is a reasonable middle step before committing real capital either way.
When Free Is Genuinely Enough (and When It Isn't)
Free tools remain the right call for a specific kind of trader. If you check charts a few times a day, trade infrequently, or are still learning what a clean setup even looks like, Finviz, TradingView's free plan, Yahoo, and Zacks will carry you a long way without costing anything. There's no reason to add complexity you don't need yet.
The wall shows up for a different kind of trader: someone hand-scanning 20 to 100 tickers a day, trying to catch intraday or multi-day setups around a job that doesn't allow constant screen time, and increasingly frustrated that the tool doing the scanning can't also tell them if the scan means anything historically. That's less a feature gap and more a workflow mismatch. The free tools were never built to run continuously in the background and hand you a validated, mobile-delivered alert. For a full walkthrough of what that kind of workflow actually looks like day to day, see swing trading with a full-time job: a real system or how to trade stocks without watching a screen all day.
If that's where you are, it's worth seeing the alternative structure in action rather than taking the comparison on faith. You can watch a short demo of how a curated screen with a backtested win rate turns into a mobile push alert, end to end.
Recap: Matching the Tool to How Active You Actually Are
Finviz, TradingView's free plan, Yahoo Finance, and Zacks each solve a real problem well: fundamental filtering, charting, quick quote lookups, and fundamental ranking, respectively. Where active swing traders hit the wall is data freshness, alert caps, the absence of a backtested win rate behind any given screen, and being tied to a desktop or open browser tab to catch anything in real time.
Before you pay for anything, run the five-point check: phone delivery, visible win rate and sample size, real-time versus delayed data, a bounded universe instead of manual scanning, and a plain-English reason for every alert. Those five questions cut through the marketing on any screener, free or paid, and get you to the actual answer: does this tool watch the market the way you need it watched, or does it just give you another tab to refresh.
If you're ready to see a screener built specifically around that gap, one with a bounded, curated universe, backtested win rates on every screen, and real push alerts to your phone, you can get the app and start browsing the 200+ screens for yourself. It's copilot, not autopilot: it narrows the field and tells you why, and you still make every trading decision from there.

See these setups live in ChartMath
200+ curated screens with backtest data. Free. No credit card required.