What to Look for in a Stock Screener App: 2026 Guide
You're three tabs deep comparing stock screener apps, and they all show you the same wall: filter counts, chart types, a badge that says AI. None of it tells you whether a single setup on the page has ever been tested. What to look for in a stock screener app isn't a longer feature list, it's proof: a recomputable win rate, a plain-English reason for the alert, and a risk plan attached before you ever tap buy.
Key Takeaways
- Backtested, not branded: A screen's edge should be a deterministic rule with a documented Win Rate and Avg. Return you (or anyone) can recompute, not a vague "AI accuracy" score.
- Reason over noise: Every alert needs a plain-English explanation of why it fired, not just a ticker and a screen name.
- Push beats refresh: Real-time push and email alerts with de-duplication solve the actual problem, missing entries while at work, better than one more browser tab.
- Confirmation across timeframes: A setup on a 15-minute chart means more when the daily and weekly trend agree, so multi-timeframe support (7 timeframes, 1m to monthly) is a real edge, not a nice-to-have.
- Risk comes before the signal: Stop, target, and position size should be part of the setup, not an afterthought you calculate after you're already in the trade.
At a Glance: Screener Feature Checklist
| Feature | Why it matters | Checkbox item or real edge? |
|---|---|---|
| Backtested win rate on each screen | Shows historical performance of the exact rule, recomputable | Real edge |
| Plain-English signal reason | Lets you audit a setup before risking capital | Real edge |
| Push + email alerts | Reaches you away from the desk without alert fatigue | Real edge |
| 7 timeframes (1m to monthly) | Confirms a setup across multiple horizons | Real edge |
| Stop/target/position size pre-filled | Puts risk management ahead of entry, not after | Real edge |
| Screen builder / Pine Script | Sounds powerful, but adds a coding barrier for non-coders | Mostly checkbox |
| "Scans the entire market" claims | A bounded, curated universe is easier to audit than a vague "everything" | Mostly marketing |
| "Accuracy %" metric | Not a standard backtest term, often unverifiable | Red flag |
Real-Time Scanning vs End-of-Day Screening: What's the Actual Difference?
A real-time scanner runs continuously during market hours and pushes an alert the instant a stock matches a rule, sometimes within seconds of the trigger bar closing. An end-of-day screener batches its results overnight or after the close, so you get a list the next morning instead of a notification mid-session. If you hold positions for hours or days but still want to catch the exact bar where a setup confirms, real-time matters more than most beginners assume, even for swing trades.
The trade-off is workload. A real-time scanner watching 1-minute and 15-minute charts throws off far more alerts than a daily screen, so it needs good alert hygiene, de-duplication, throttling, and quiet hours, or it becomes another source of alert fatigue. For traders with a day job who check charts at lunch and after work, a hybrid approach works well: daily and weekly screens for direction, intraday screens for entry timing.
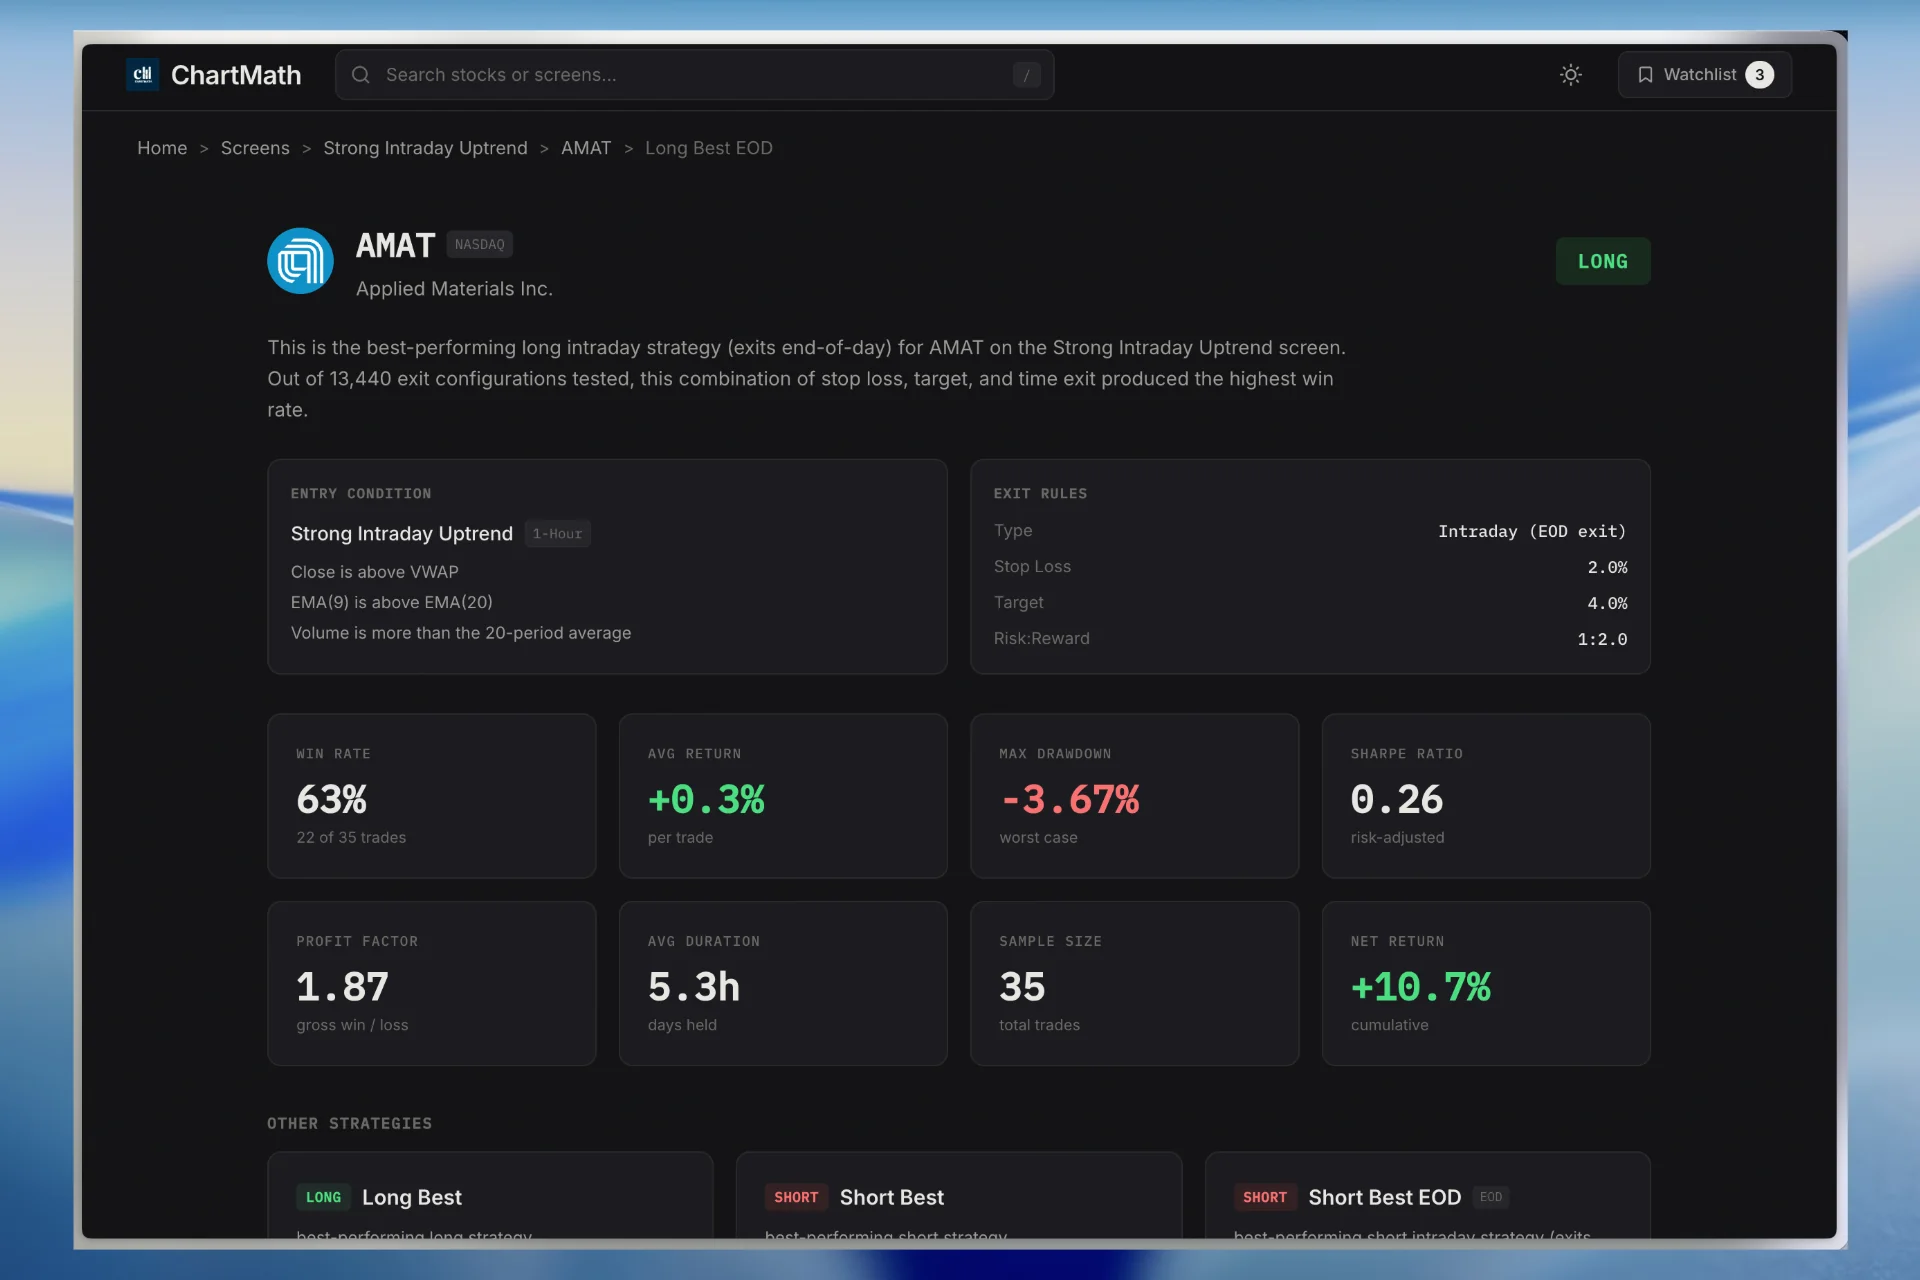
1. A Backtested Win Rate You Can Recompute, Not Just Trust
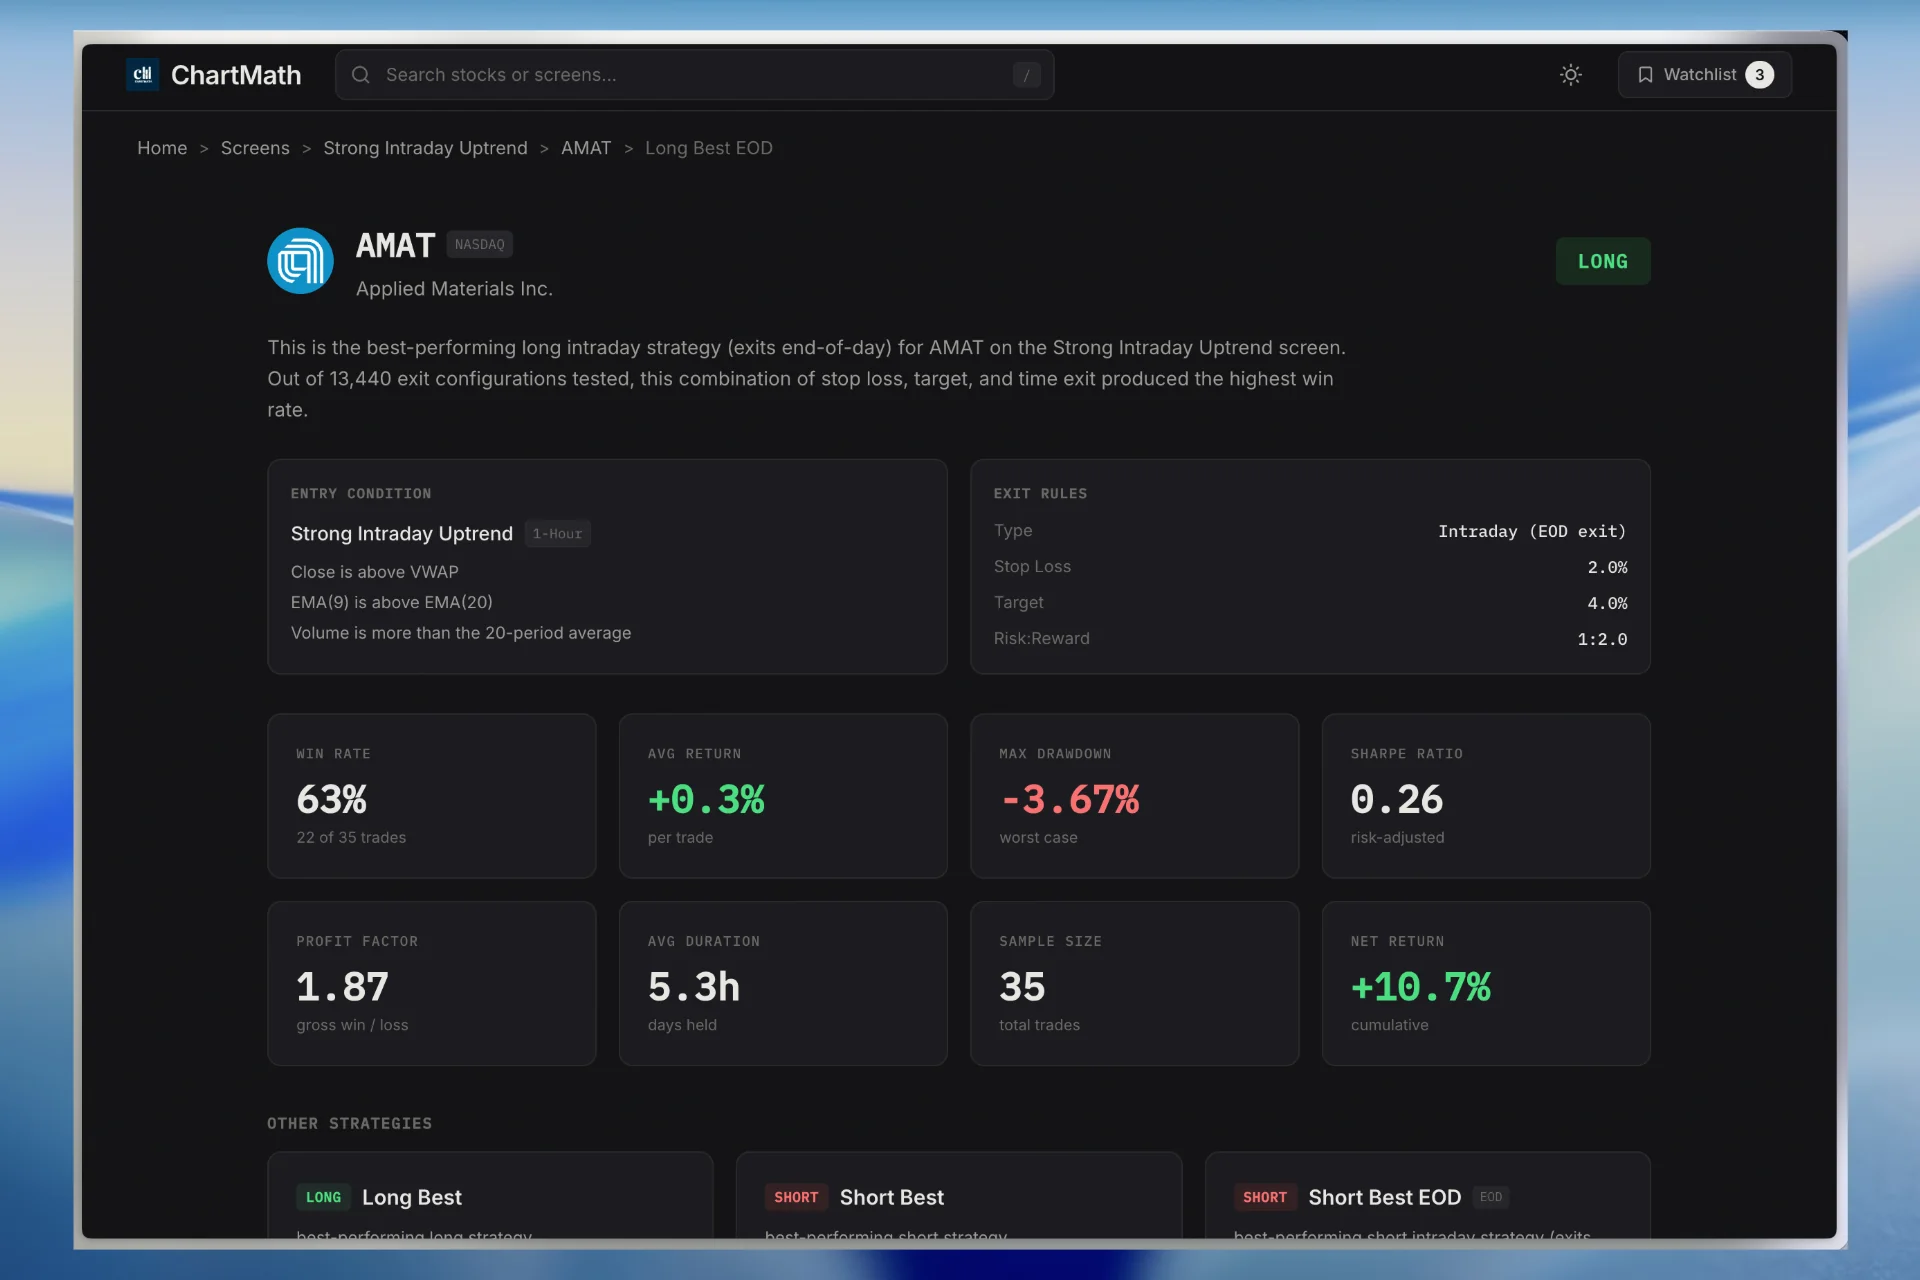
Marketing copy loves the word "accuracy." Real backtesting doesn't use it. A serious screener reports Win Rate and Avg. Return against a documented sample size, so the number can be checked instead of taken on faith. A screen that says it won 63% of the time across its backtested history is making a claim about the past, not a forecast of tomorrow, and any tool worth using should say so plainly.
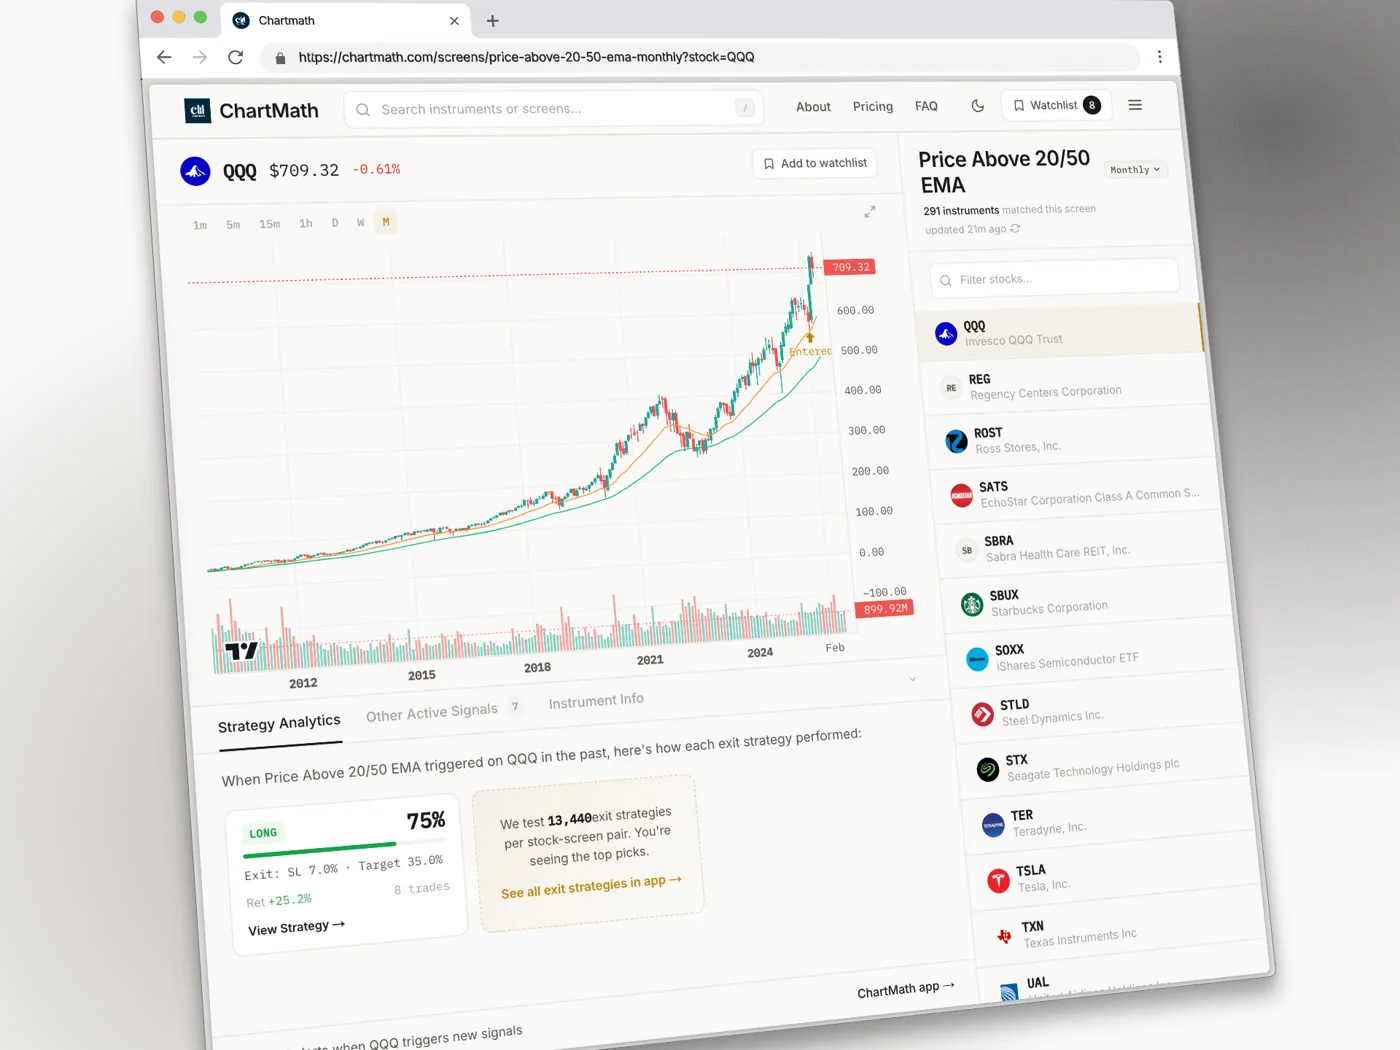
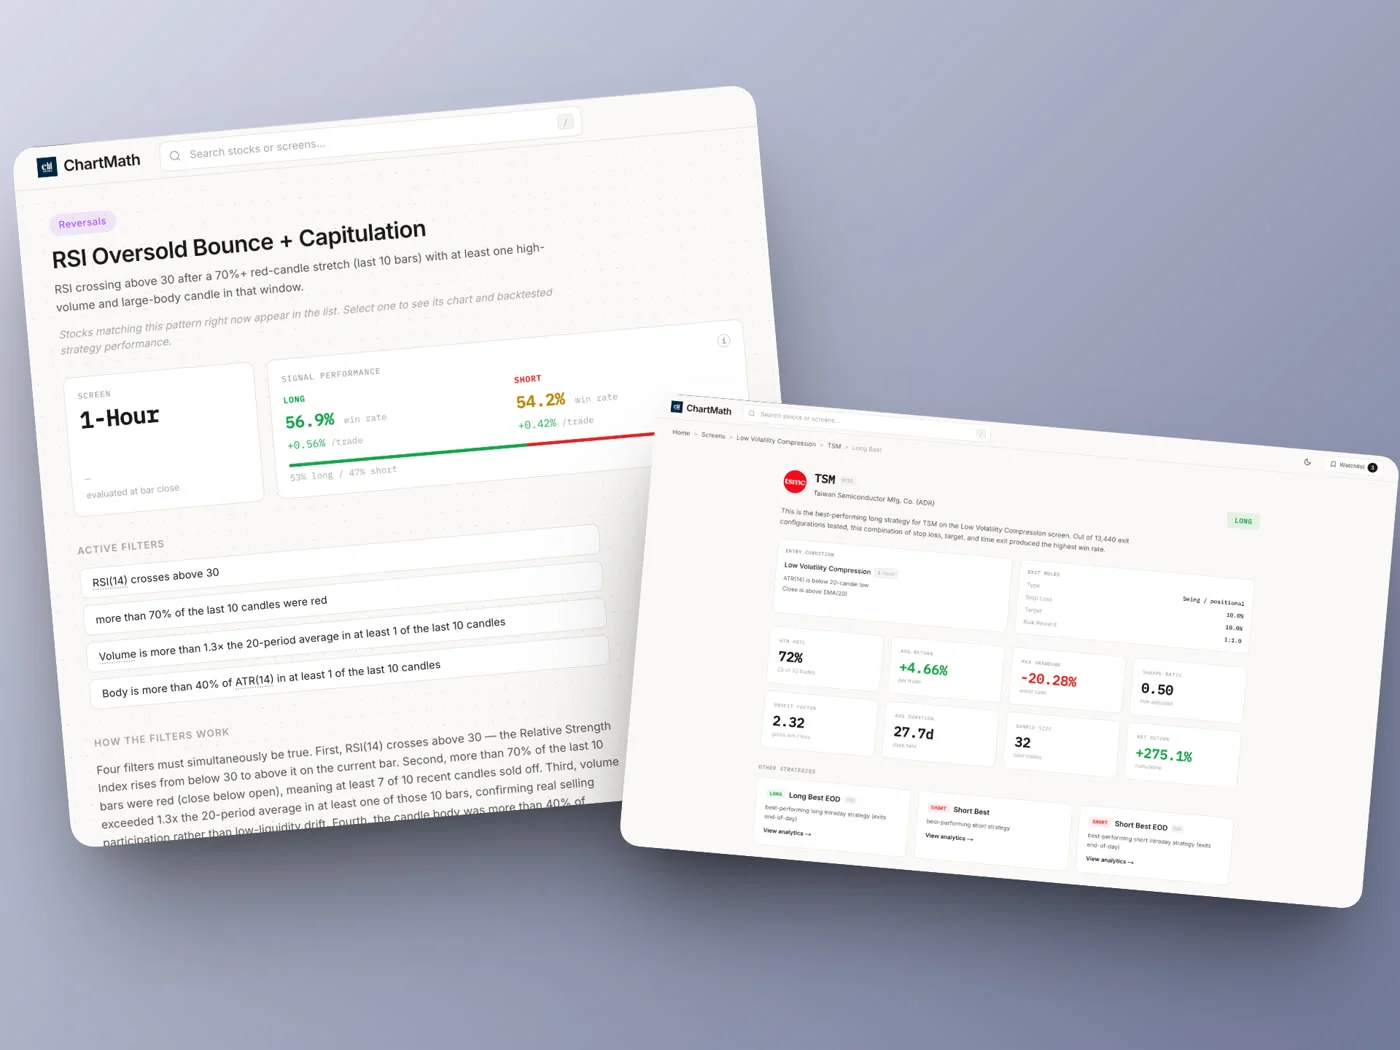
ChartMath runs this test on 200+ curated technical screens across a fixed universe of 500+ US equities. Any one of them is open to read before you install anything, the Golden Cross screen (Daily) or the RSI Oversold Bounce and Capitulation screen (1H), rule and record on the same page. Because each screen is a deterministic rule (not a discretionary call), its track record can be recomputed rather than trusted blindly. If you want the deeper mechanics of why this matters more than a flashy percentage, this breakdown of backtest win rate covers the sample-size traps beginners fall into.
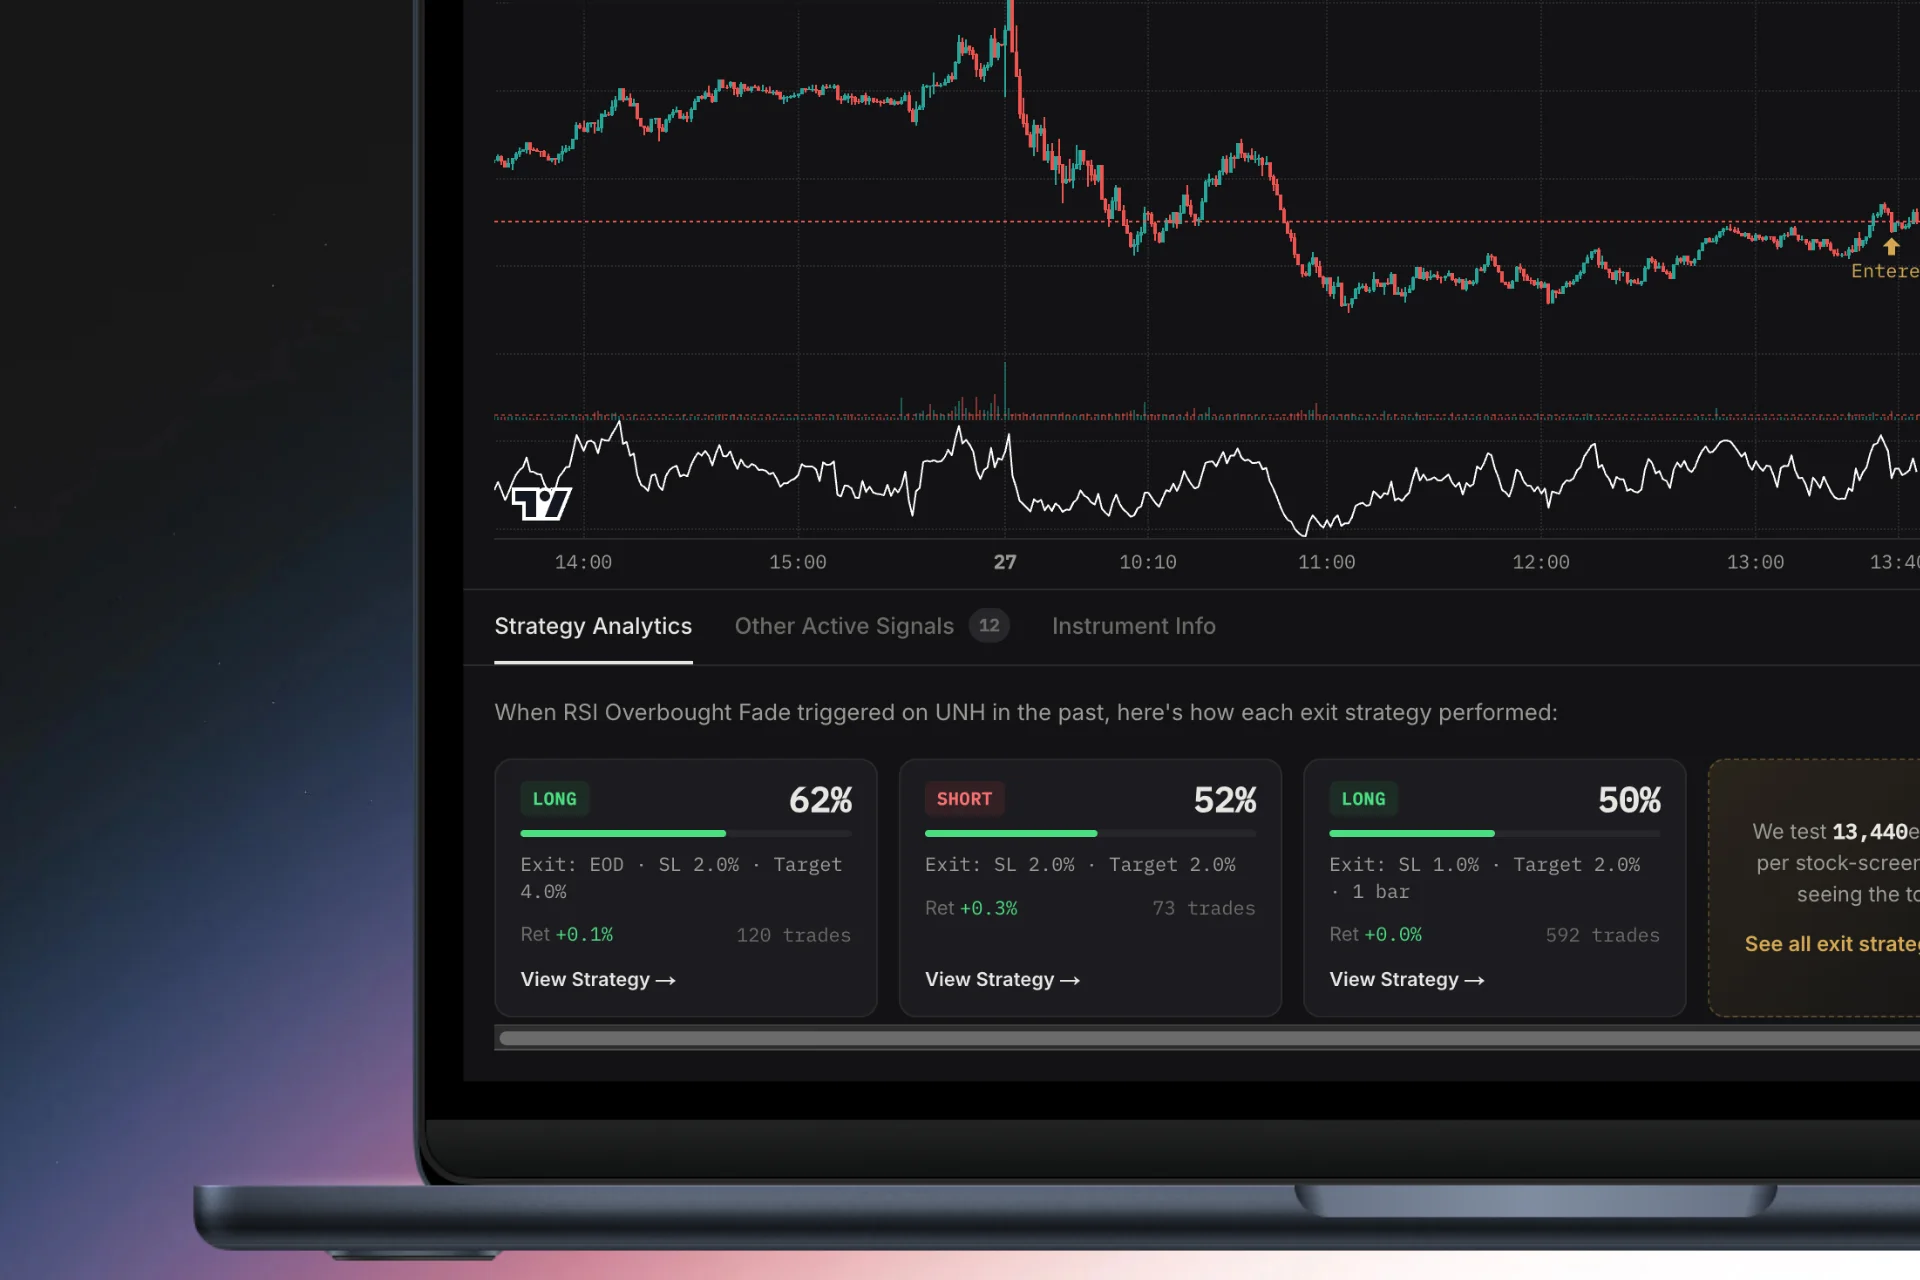
Watch for screeners that pair a big percentage with no sample size, or that swap "accuracy" for "win rate" without disclosing what the number was measured against. Those are marketing dressed up as data.
2. A Plain-English Reason Attached to Every Alert
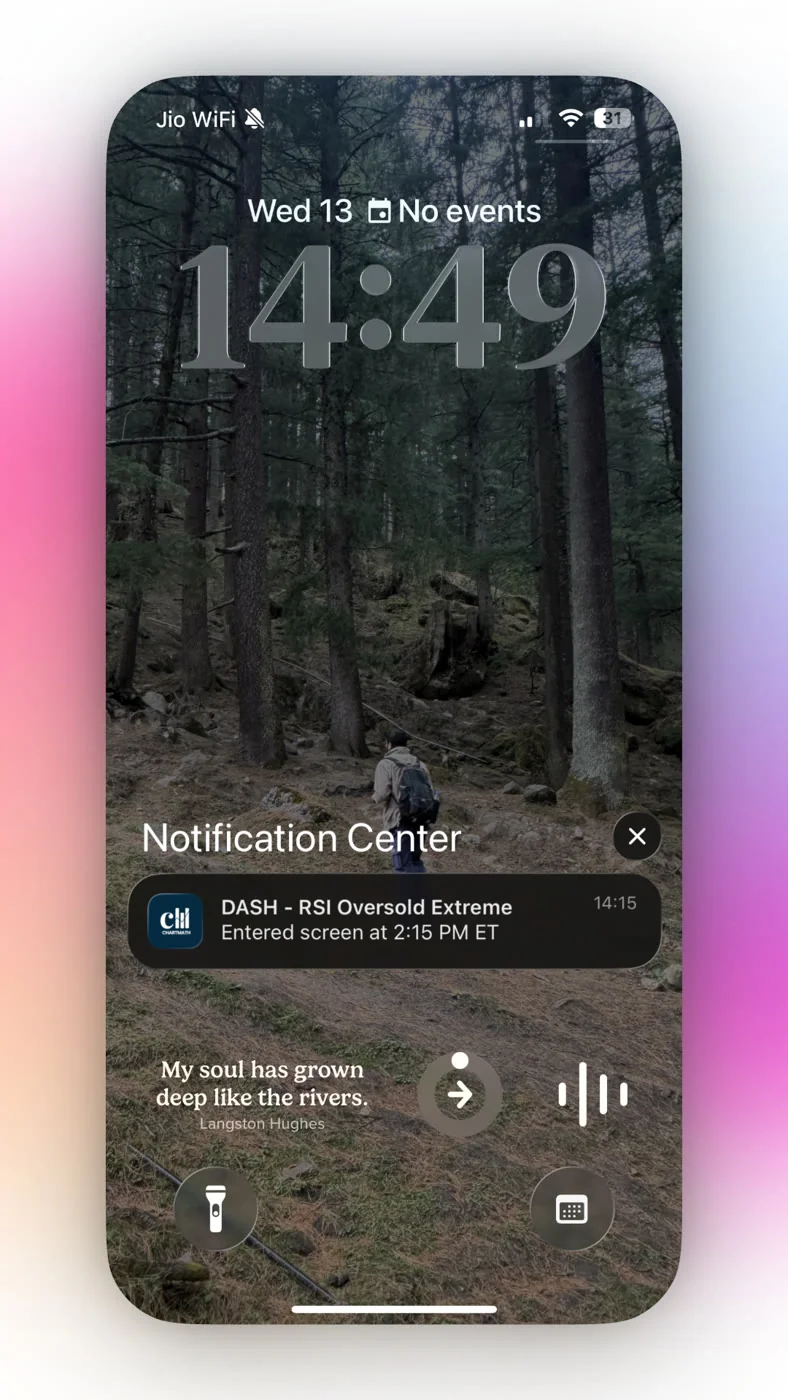
"DASH entered RSI Oversold" tells you a filter matched. It doesn't tell you why that filter is worth trading. A screener worth paying for (or worth using at all) should explain the setup in language you can check against the chart yourself: what the indicator did, over what lookback, and what the historical outcome has been when that condition showed up before.
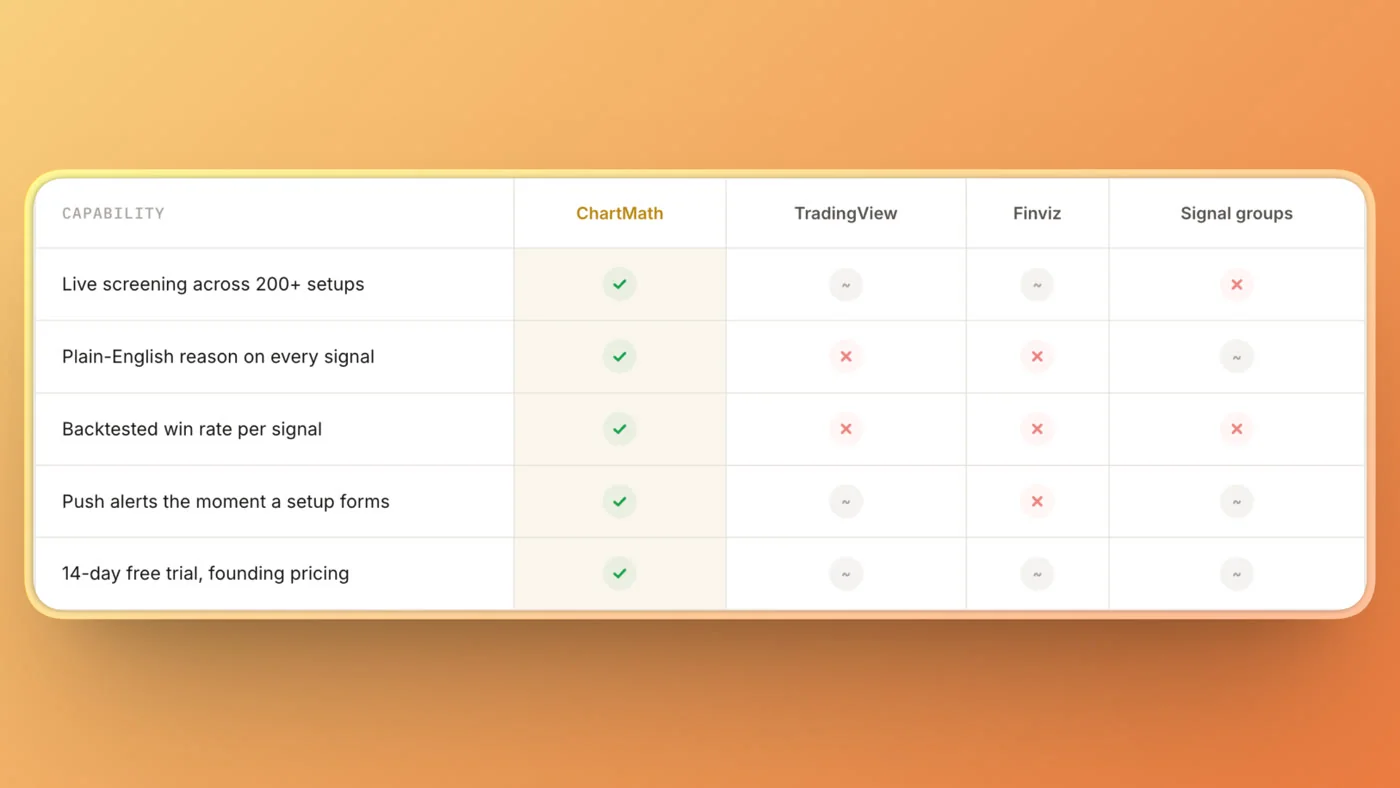
This is the difference between a signal you can audit and one you have to take on faith. TradingView's built-in screeners are strong for charting but don't attach a backtest or a plain-English reason to a match. Static screeners like Finviz show you a filtered list with no explanation of why today's match is meaningfully different from yesterday's. If your current tool leaves you guessing, this plain-English guide to reading scanner results is a useful gut-check on what a signal should actually tell you.
3. Push Alerts That Reach You Away From the Desk
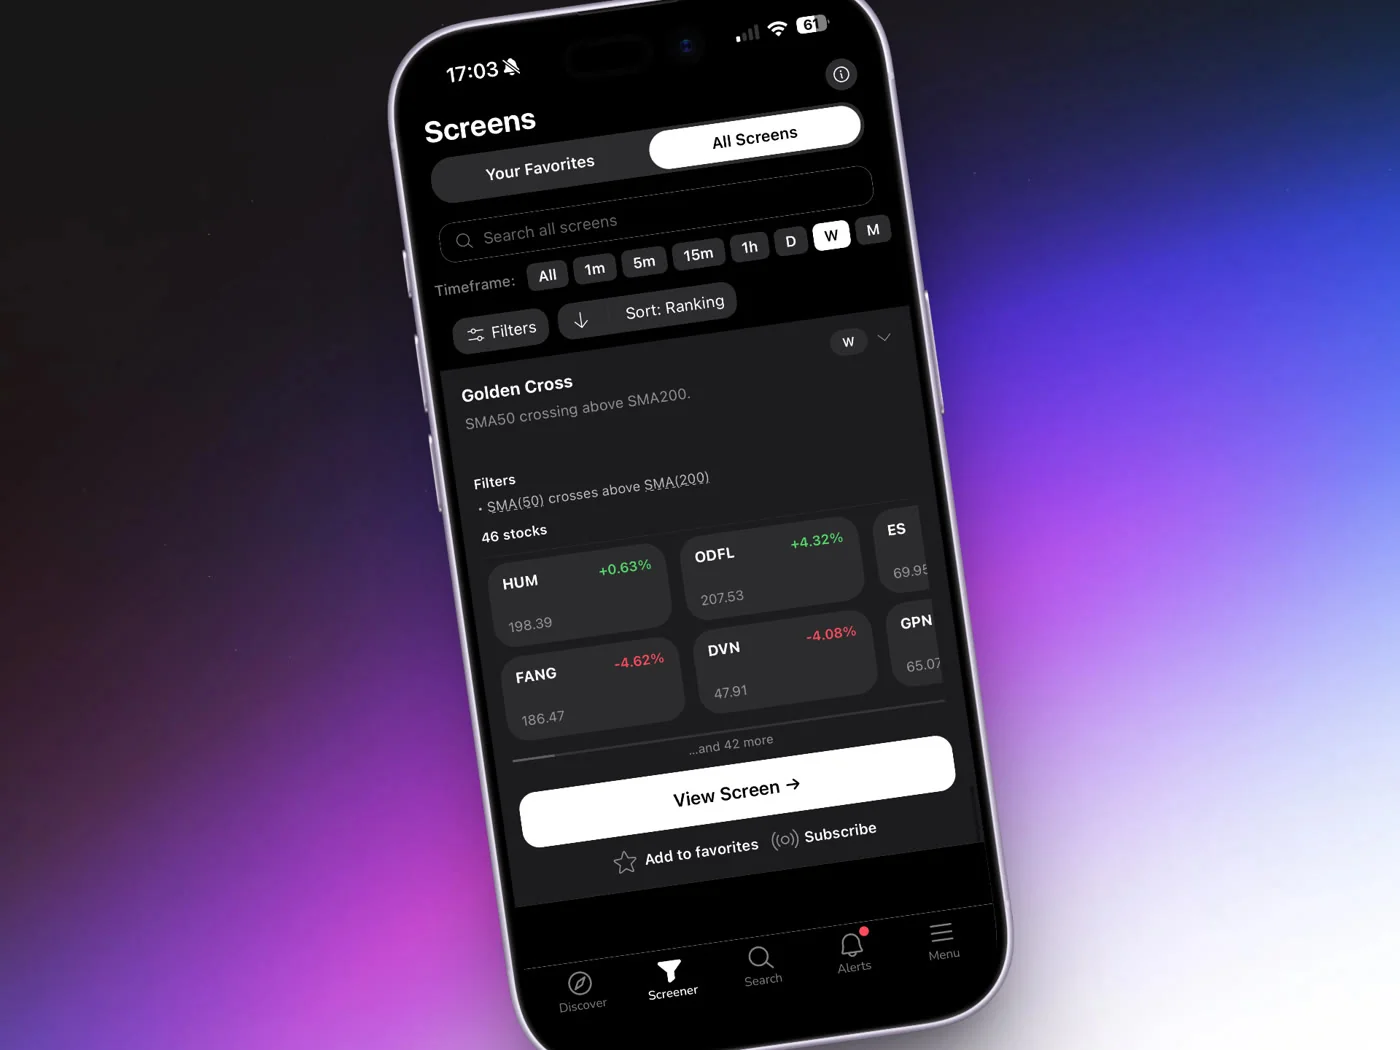
The core problem for a swing trader with a day job isn't finding setups, it's finding out about them in time. A screener that only shows results in a browser tab requires you to keep checking it, which defeats the point. Push notifications solve this, but only if they're managed well. Alerts that fire on every minor blip create the exact alert fatigue that makes traders mute notifications entirely, which is worse than having none.
Look for de-duplication (no repeat pings for the same setup), throttling, a per-bar cap, and timezone-aware quiet hours so an overnight move doesn't wake you at 2 AM for a position you hold for days. Push and email are the two channels that matter; SMS adds cost without adding much. For a walkthrough of getting this set up on your phone, see how to get stock alerts to your phone while at work and setting up screener alerts on mobile.
4. Multi-Timeframe Support to Confirm a Setup
A 15-minute breakout means something different depending on what the daily and weekly chart are doing underneath it. A screener limited to one timeframe forces you to open a second tool to check the bigger picture, which adds friction and invites you to skip the check entirely when you're busy. Support for 7 timeframes, from 1-minute up through monthly, lets you run the same rule at multiple horizons and see where they agree.
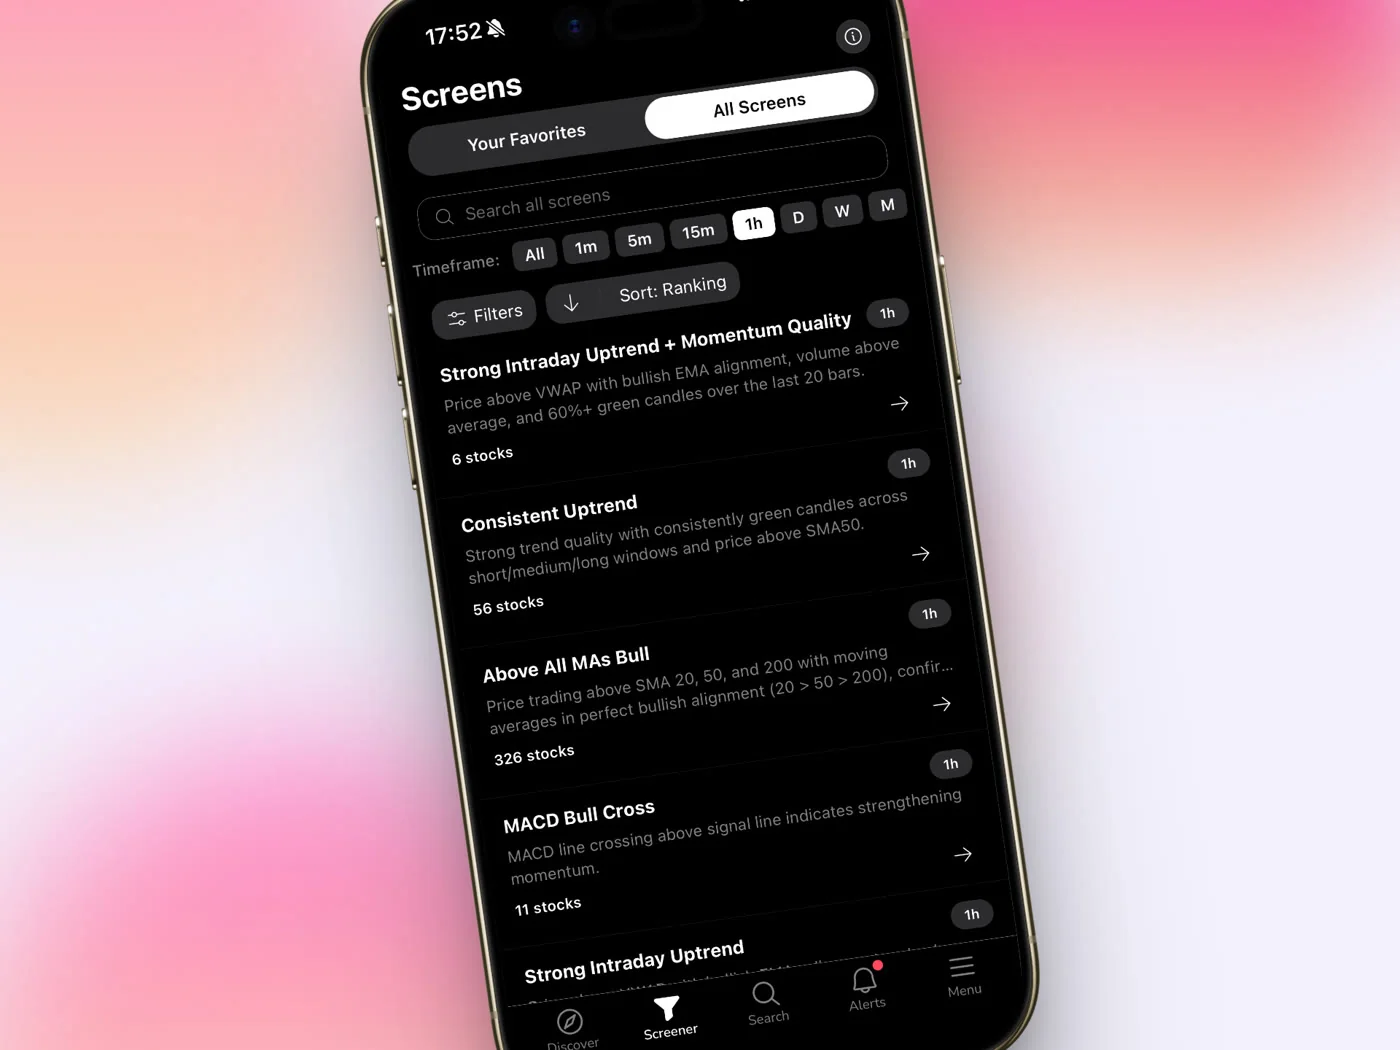
This matters most for entry timing on positions you already believe in. If the weekly trend is up, the daily is consolidating, and the 1-hour just reclaimed VWAP, that's three timeframes lining up instead of one alert in isolation. For more on sequencing that check, read entry timing for conviction stocks you own and how to use VWAP in your entry timing.
5. Risk Built In Before You Tap Buy
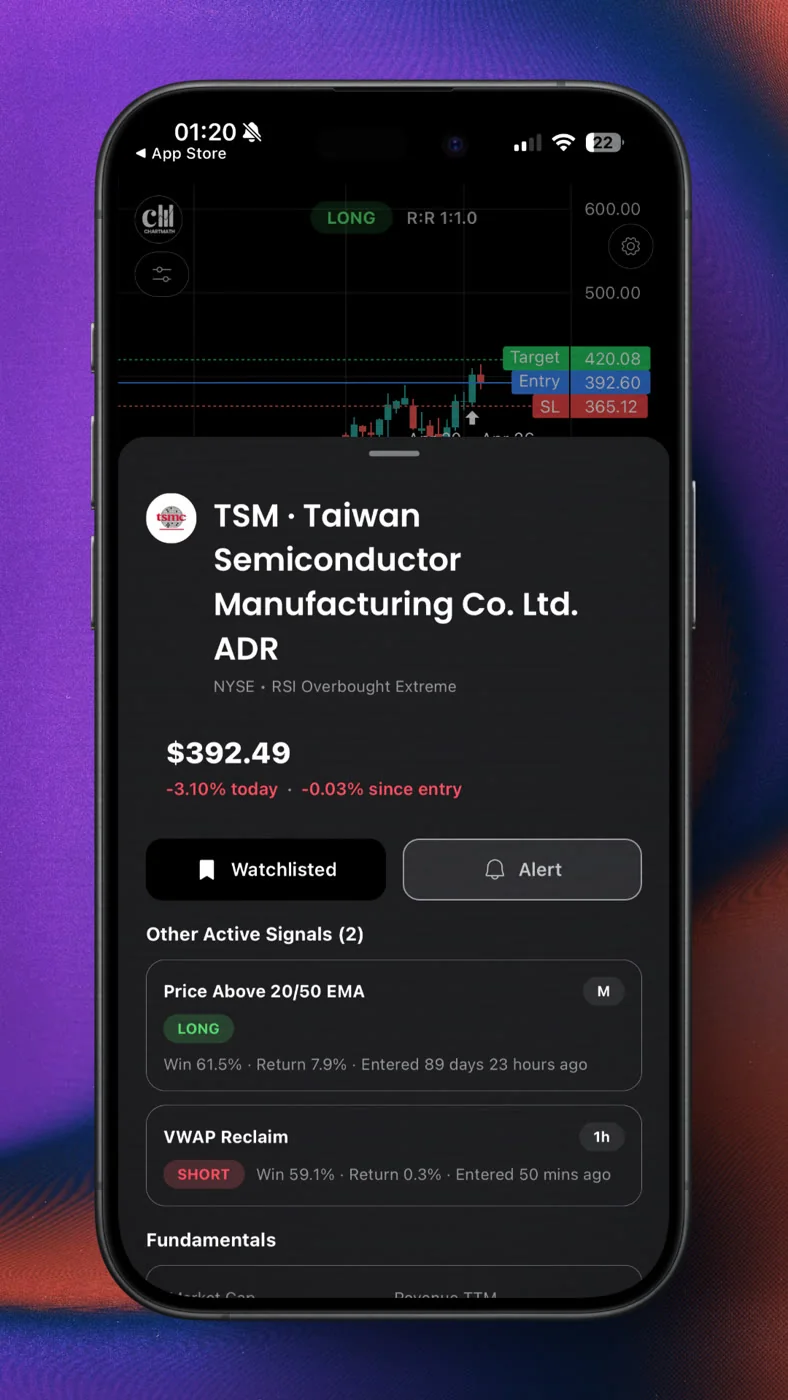
A stock screener that only tells you what to watch is half a tool. The other half is what happens the moment you decide to act. Stop level, target, and position size should be part of the setup itself, calculated by capital split (total account divided by max positions), not something you eyeball after you're already in the trade. That order matters: risk decided first, entry decided second.
Paper trading closes the gap between reading a backtest and actually executing it. Placing a simulated order with the stop and target pre-filled, tracked in a dedicated portfolio view, lets you rehearse the exact mechanics of a rule before committing real capital. This is a copilot, not an autopilot: the trader taps to place every order, nothing fires automatically. For the sizing math specifically, see position sizing for swing traders.
6. A Watchlist That Screens for You, Not the Other Way Around
Most traders build a watchlist and then manually check each ticker against a handful of setups, over and over, every day. That's backwards. A watchlist should run every ticker on it against 200+ screens continuously, so the screening happens automatically and you're only notified when something actually matches. Compare that to refreshing Finviz or scrolling a TradingView layout by hand: the work is identical, it's just done for you instead of by you.
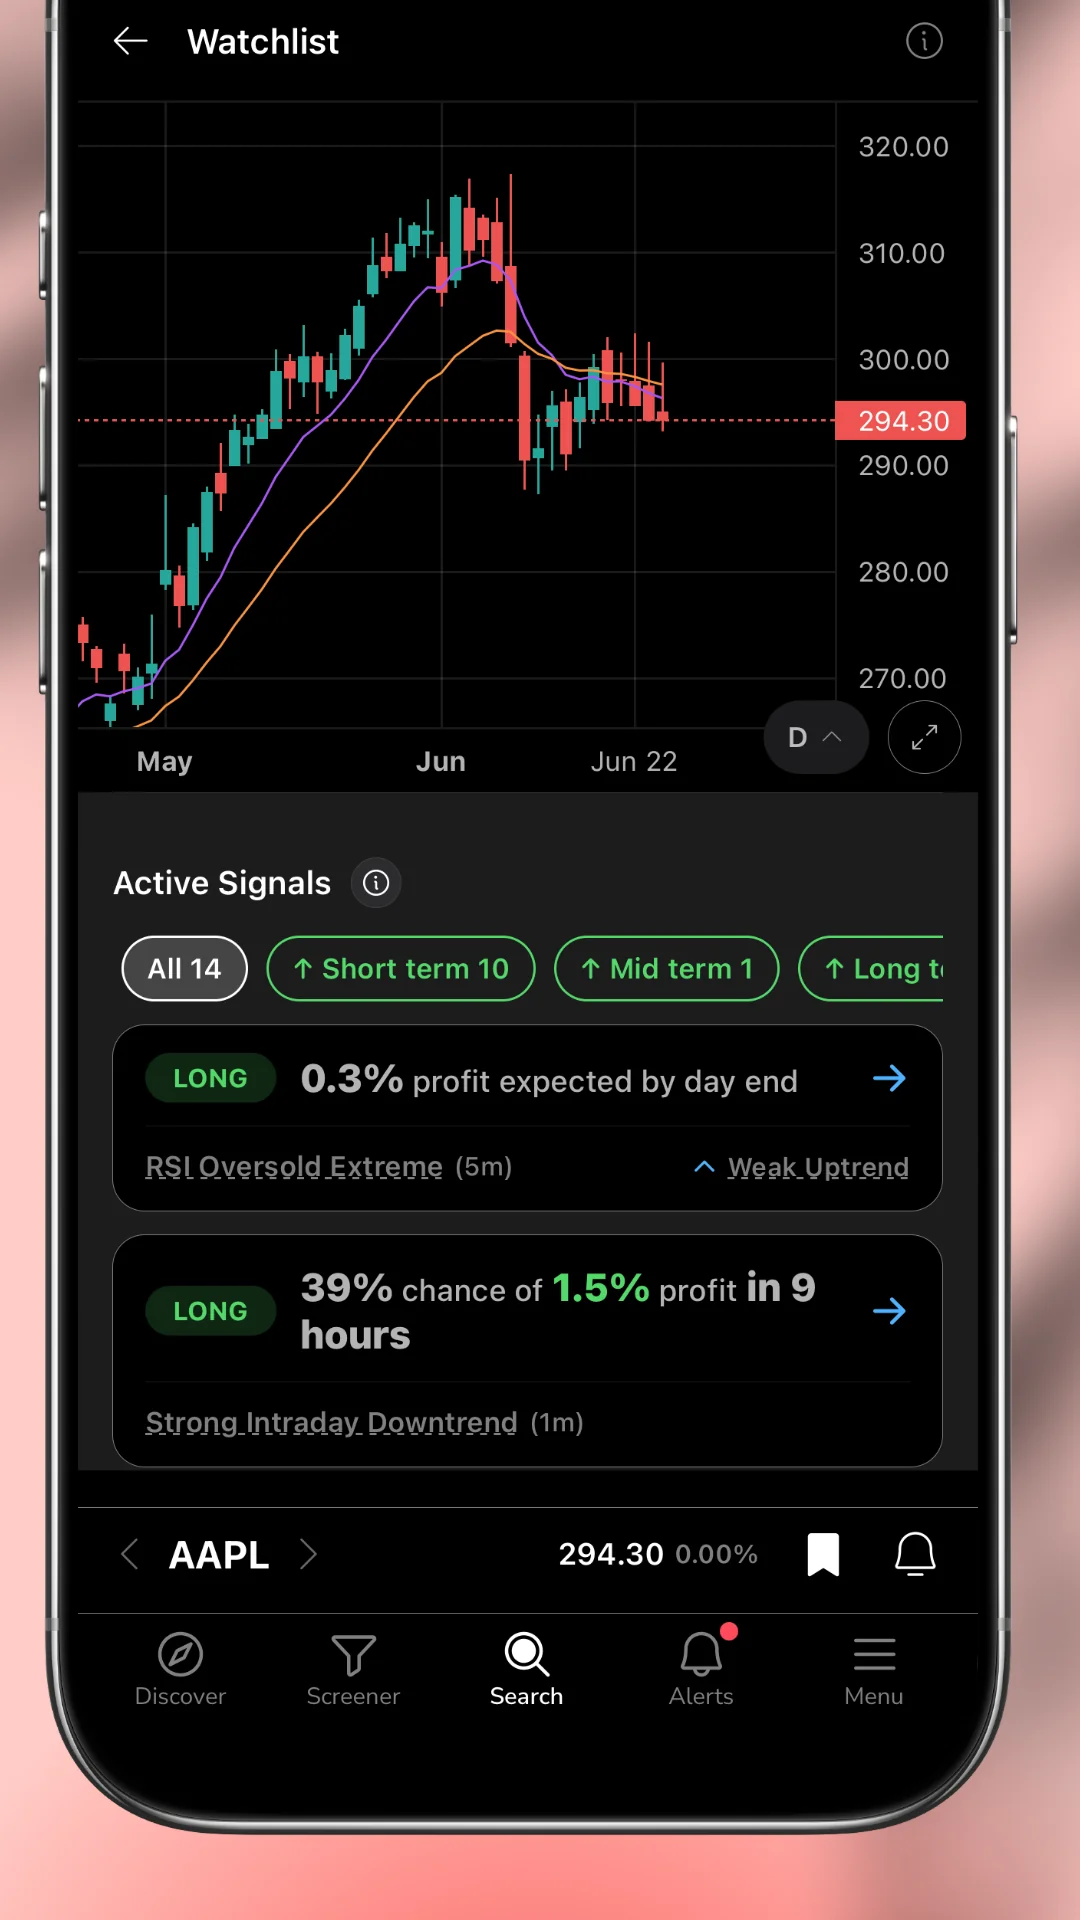
This is one of the clearer places where a curated, bounded screener universe (500+ US equities) beats a vague claim of "scanning thousands of stocks." A smaller, well-defined universe with real backtests behind every screen is more useful than a giant, unverifiable one.
7. A Weekly Review Loop, Not Just Daily Noise
Systematic trading isn't just about catching entries. It's a ladder: move from gut calls to evidence-backed screens, attach a risk plan to every trade, then step back weekly to review what actually happened across the book. A screener that only produces alerts, with no way to look back at which screens performed and which didn't for your own trades, leaves you stuck at the alert-firehose stage. Treat the weekly review as a chance to check your own results against the screen's historical Win Rate and Avg. Return, not just to react to the next ping.
If your current process is still built around instinct more than data, how to stop trading on gut and start using data lays out that shift step by step.
Checkbox Features That Sound Good but Don't Move the Needle
- Screen builders and Pine Script: Powerful in theory, but they turn a screening tool into a coding project. If you read indicators but don't write code, a library of 200+ ready-made screens gets you to a usable setup faster than a blank canvas. See a scanner without Pine Script for what that looks like in practice.
- "Accuracy" as a metric: This isn't a standard backtesting term. Win Rate and Avg. Return, with a stated sample size, are the terms that let you actually verify a claim.
- "Scans thousands of stocks" or "the entire market": Breadth without a backtest is just noise at scale. A bounded, well-documented universe you can audit beats an enormous one you can't.
- Unvalidated signal groups: A Discord or Telegram call with no documented history is a stranger's opinion, not a track record. See the comparison in Discord signals vs a backtested screener.
FAQ
What's the difference between a real-time scanner and an end-of-day screener?
A real-time scanner checks the market continuously during trading hours and alerts you the moment a stock matches, useful for catching intraday entries. An end-of-day screener compiles its results after the close, giving you a list to review the next morning instead of a live notification. Swing traders often want both: EOD or daily/weekly screens for direction, real-time alerts for entry timing.
Are free stock screeners good enough?
Free screeners like Finviz's basic tier are solid for filtering by fundamentals and simple technical criteria, but most lack push alerts, backtested win rates, and plain-English signal explanations. They're a fine starting point for learning to read a chart; they fall short once you need real-time confirmation or a documented edge behind a setup.
Does a bigger stock universe mean better screening?
Not necessarily. A screener that claims to cover "the entire market" or "thousands of stocks" is harder to audit than one with a defined, bounded universe where every screen carries its own backtest. Coverage matters less than whether the results are explainable and verifiable.
Put the Checklist to Work on Your Own Watchlist
Seven criteria, recapped: a recomputable win rate, a plain-English reason, push alerts that don't create fatigue, multiple timeframes for confirmation, risk built in before entry, a watchlist that screens continuously, and a weekly review loop. Run your current screener through that list before you renew or upgrade anything.
ChartMath is built around exactly this checklist: 200+ deterministic, backtested screens across 500+ US equities, with a plain-English reason and a Win Rate/Avg. Return on every screen. It is free, no credit card required, available on iOS and Android. Download the app and run it against your own watchlist, or browse the full catalog first on the web-based screener. The catalog is open to browse, so you can run the screens against this checklist before installing anything.

See these setups live in ChartMath
200+ curated screens with backtest data. Free. No credit card required.