Best Stock Scanner App with Real-Time Alerts (iPhone & Android)

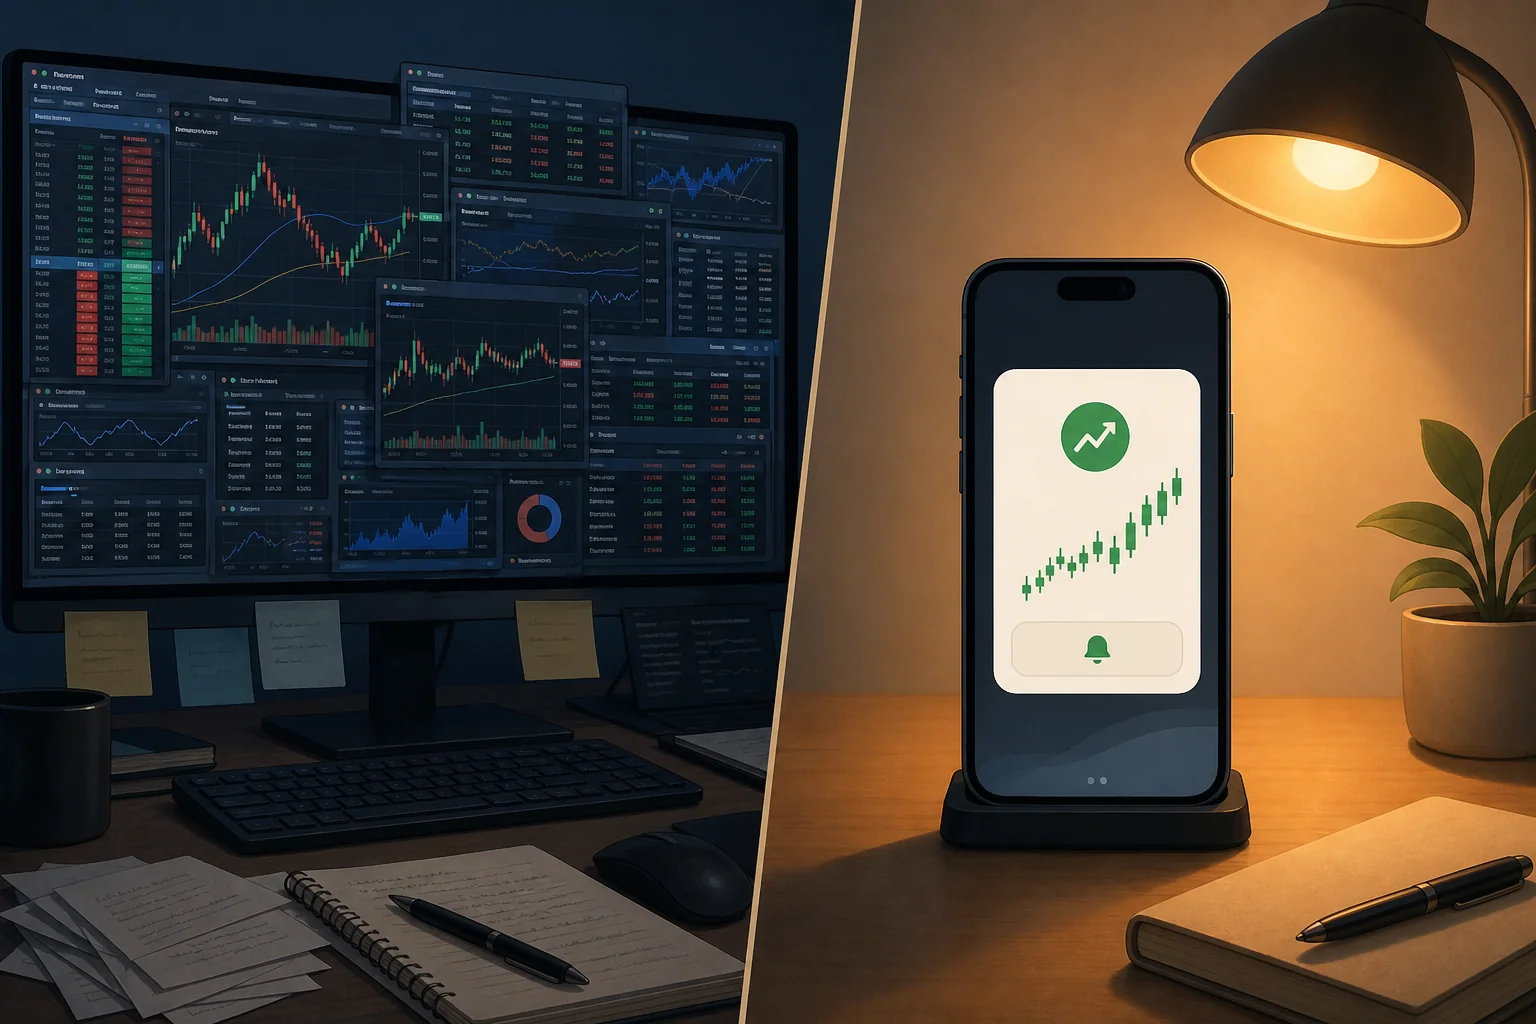
Somewhere between your third meeting of the day and a lunch you barely had time to eat, a stock you've been watching for three weeks finally broke out. Clean setup. Heavy volume. Textbook entry. Gone before you looked up.
That's not bad luck. That's a tool problem. Most stock scanner apps were built for traders who sit at a desk all day — and then ported to mobile as an afterthought. The result is either a stripped-down version of a desktop platform that can't do much, or a firehose of alerts with no context about why any of them matter. Neither one is a stock screener that finds trades for you.
This review evaluates the top real-time stock scanner apps for iPhone and Android in 2026. We looked at four things: alert speed, setup quality, interface usability, and price. We'll tell you which apps are genuinely built for mobile, which ones are desktop tools in disguise, and which one is worth downloading if you trade around a full-time job.
What Most Stock Scanner Apps Get Wrong
The stock scanner market has a dirty secret: most "mobile apps" are just responsive web wrappers around desktop software. They look fine on a phone screen, but they weren't designed for one. The filter menus are tiny. The alerts are generic. And the whole experience assumes you're sitting at a keyboard with time to configure things.
That's a problem for the majority of active traders. According to FINRA's investor research, a significant portion of self-directed retail traders hold full-time jobs alongside their trading activity. They're not watching Level 2 quotes at 10 AM. They're in meetings, on calls, or managing a workload that doesn't pause for the market open.
Three failure modes show up repeatedly in mobile scanner apps:
- Alert fatigue: Platforms that send 50–200 notifications a day without explaining why any of them triggered. You stop reading them within a week.
- End-of-day data on a real-time label: Some apps market themselves as "real-time" but only update screener results once a day. That's useless for momentum and intraday setups.
- Discovery gap: Charting tools like TradingView are excellent — but they only analyze stocks you already pulled up. They don't go find new setups for you. That's a fundamentally different job.
The best mobile scanner apps solve all three. They scan the whole market continuously, surface only the setups that match a defined edge, and explain each alert in plain English. That's what separates a true trade discovery tool from a charting app with a notification badge.
For a deeper look at how to structure your scanning routine around a day job, see How to Build an Efficient Trading Workflow in 2026.
How We Evaluated Each App
We tested each platform across four criteria that matter most to active traders who aren't glued to a screen:
- Alert speed: Does the app send real-time push notifications, or does it update on a delay? We tested alert latency during market hours for breakout and VWAP setups.
- Setup quality: Are the screens based on validated technical setups with backtest data, or are they raw filter outputs with no edge behind them? A screener that surfaces 200 tickers matching a loose RSI filter isn't helping you, it's just moving the work.
- Interface usability: Is the app genuinely designed for a phone, or is it a desktop port? Can you evaluate a setup in under 30 seconds on a 6-inch screen?
- Price: Is there a free tier? What do you actually get at each price point? Is the cost justified for a part-time or swing trader?
We also weighted heavily for explainability, whether an alert tells you why it triggered, not just that it did. A push notification that says "NVDA alert" is noise. One that says "NVDA broke above 6-week consolidation on 2.3x relative volume, matches the High-Volume Breakout screen (68% win rate, 200 backtests)" is actionable.
ChartMath: Best Overall for Swing Traders with Day Jobs
ChartMath was built from the ground up for one specific trader: someone who knows their setups, trades around a full-time job, and needs the system to do the scanning while they keep the final call. It's not trying to replace your charting platform. It's the discovery layer that tells you which stocks are worth opening a chart on.
200+ Pre-Built Screens, Zero Pine Script
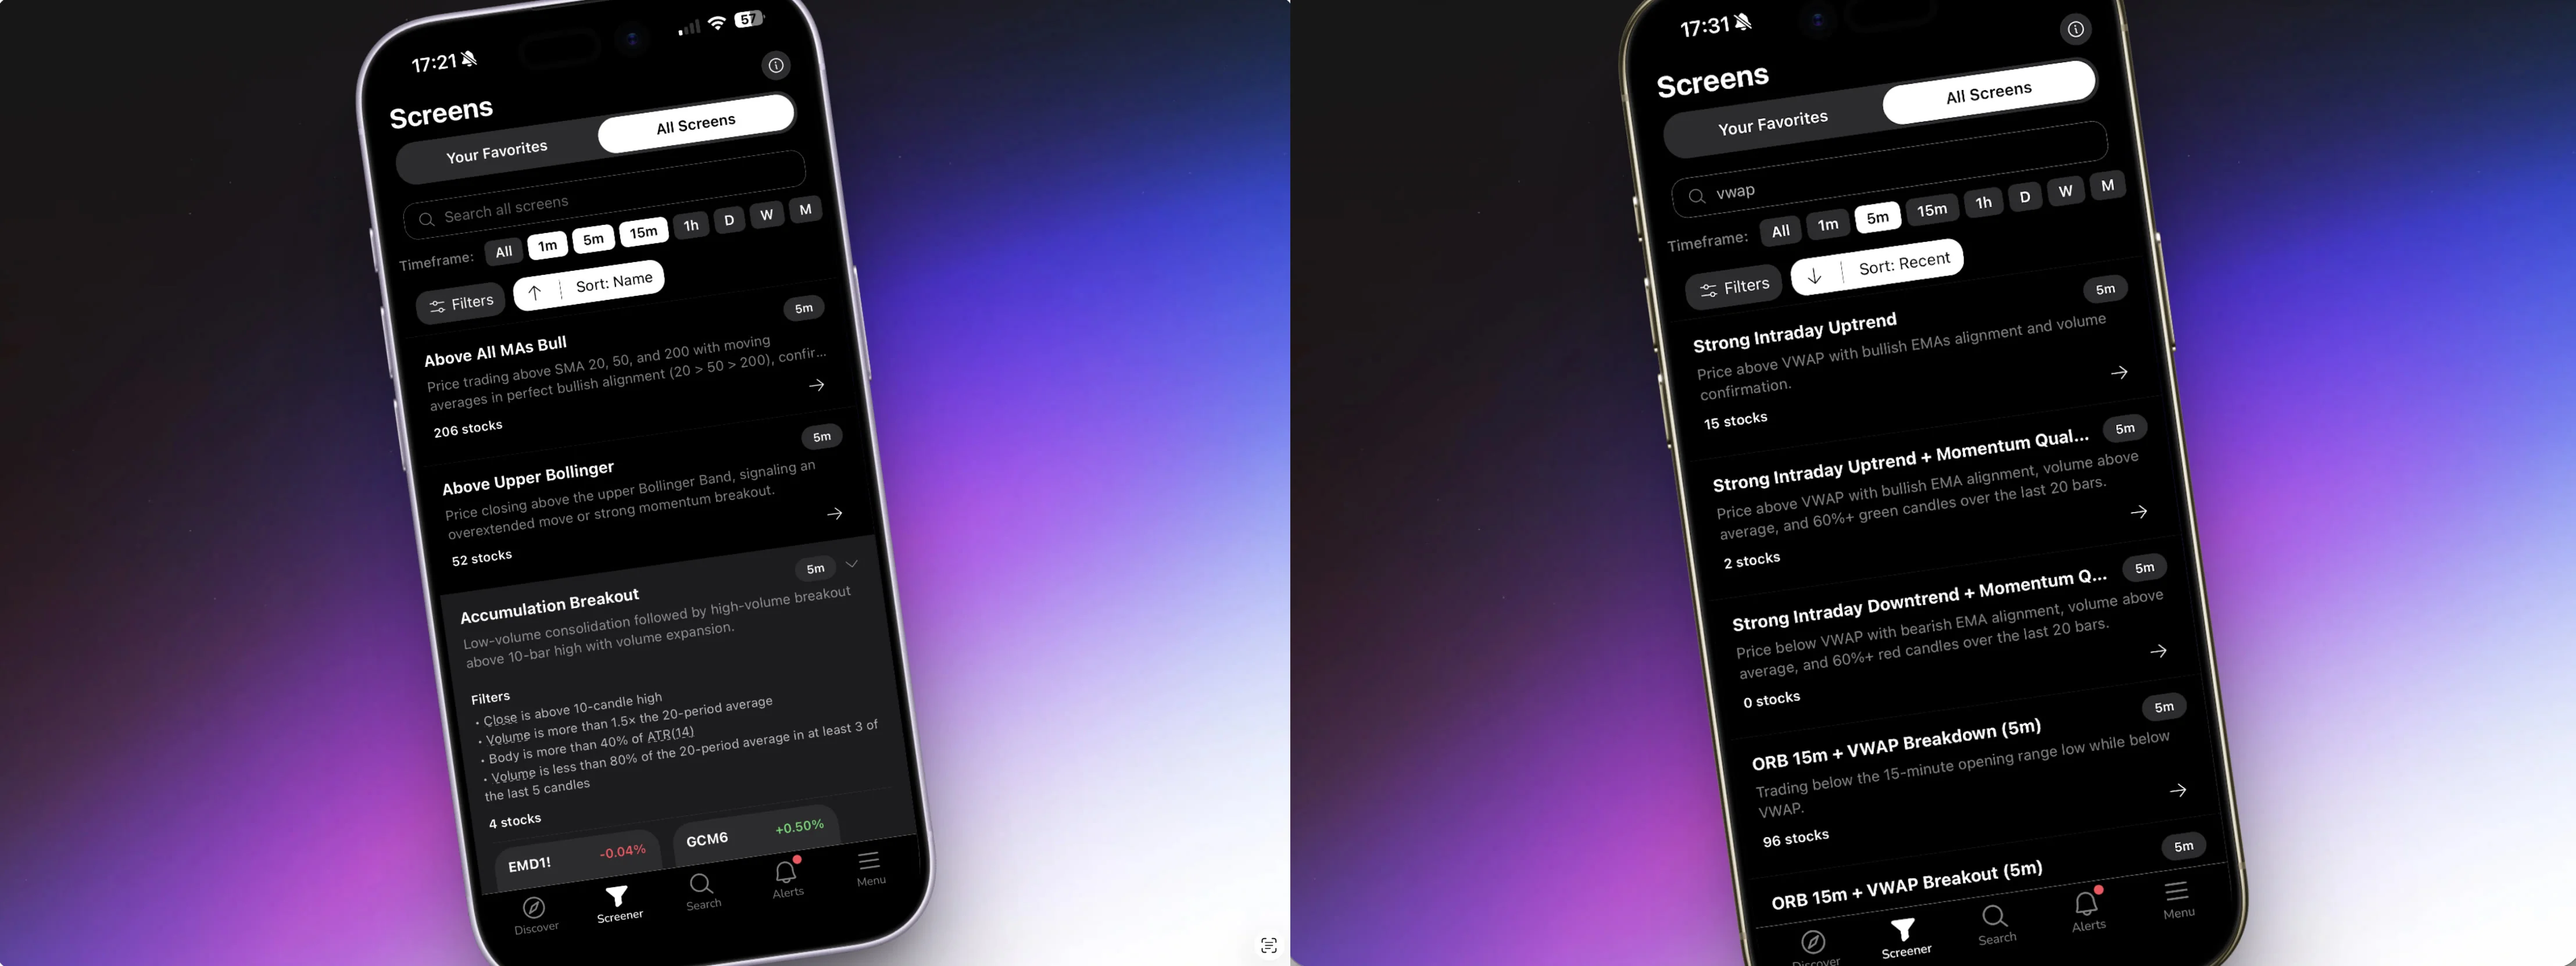
ChartMath runs continuously across 200+ curated technical screens, breakouts, 52-week highs, VWAP reclaims, RVOL spikes, ORB setups, momentum plays, and more. Every screen is pre-built. You don't write a single line of code to access any of them. For traders who've been told to "just write a Pine Script alert" on TradingView, this is a meaningful difference.
Each screen comes with backtest validation: historical win rates, average returns, and drawdown data across hundreds of past signals. You're not trading a setup blind. You know the edge before you enter. That's the kind of transparency most platforms skip entirely. For more on why backtest data matters before you risk capital, see How to Build Winning Backtesting Strategies: A Complete Guide.
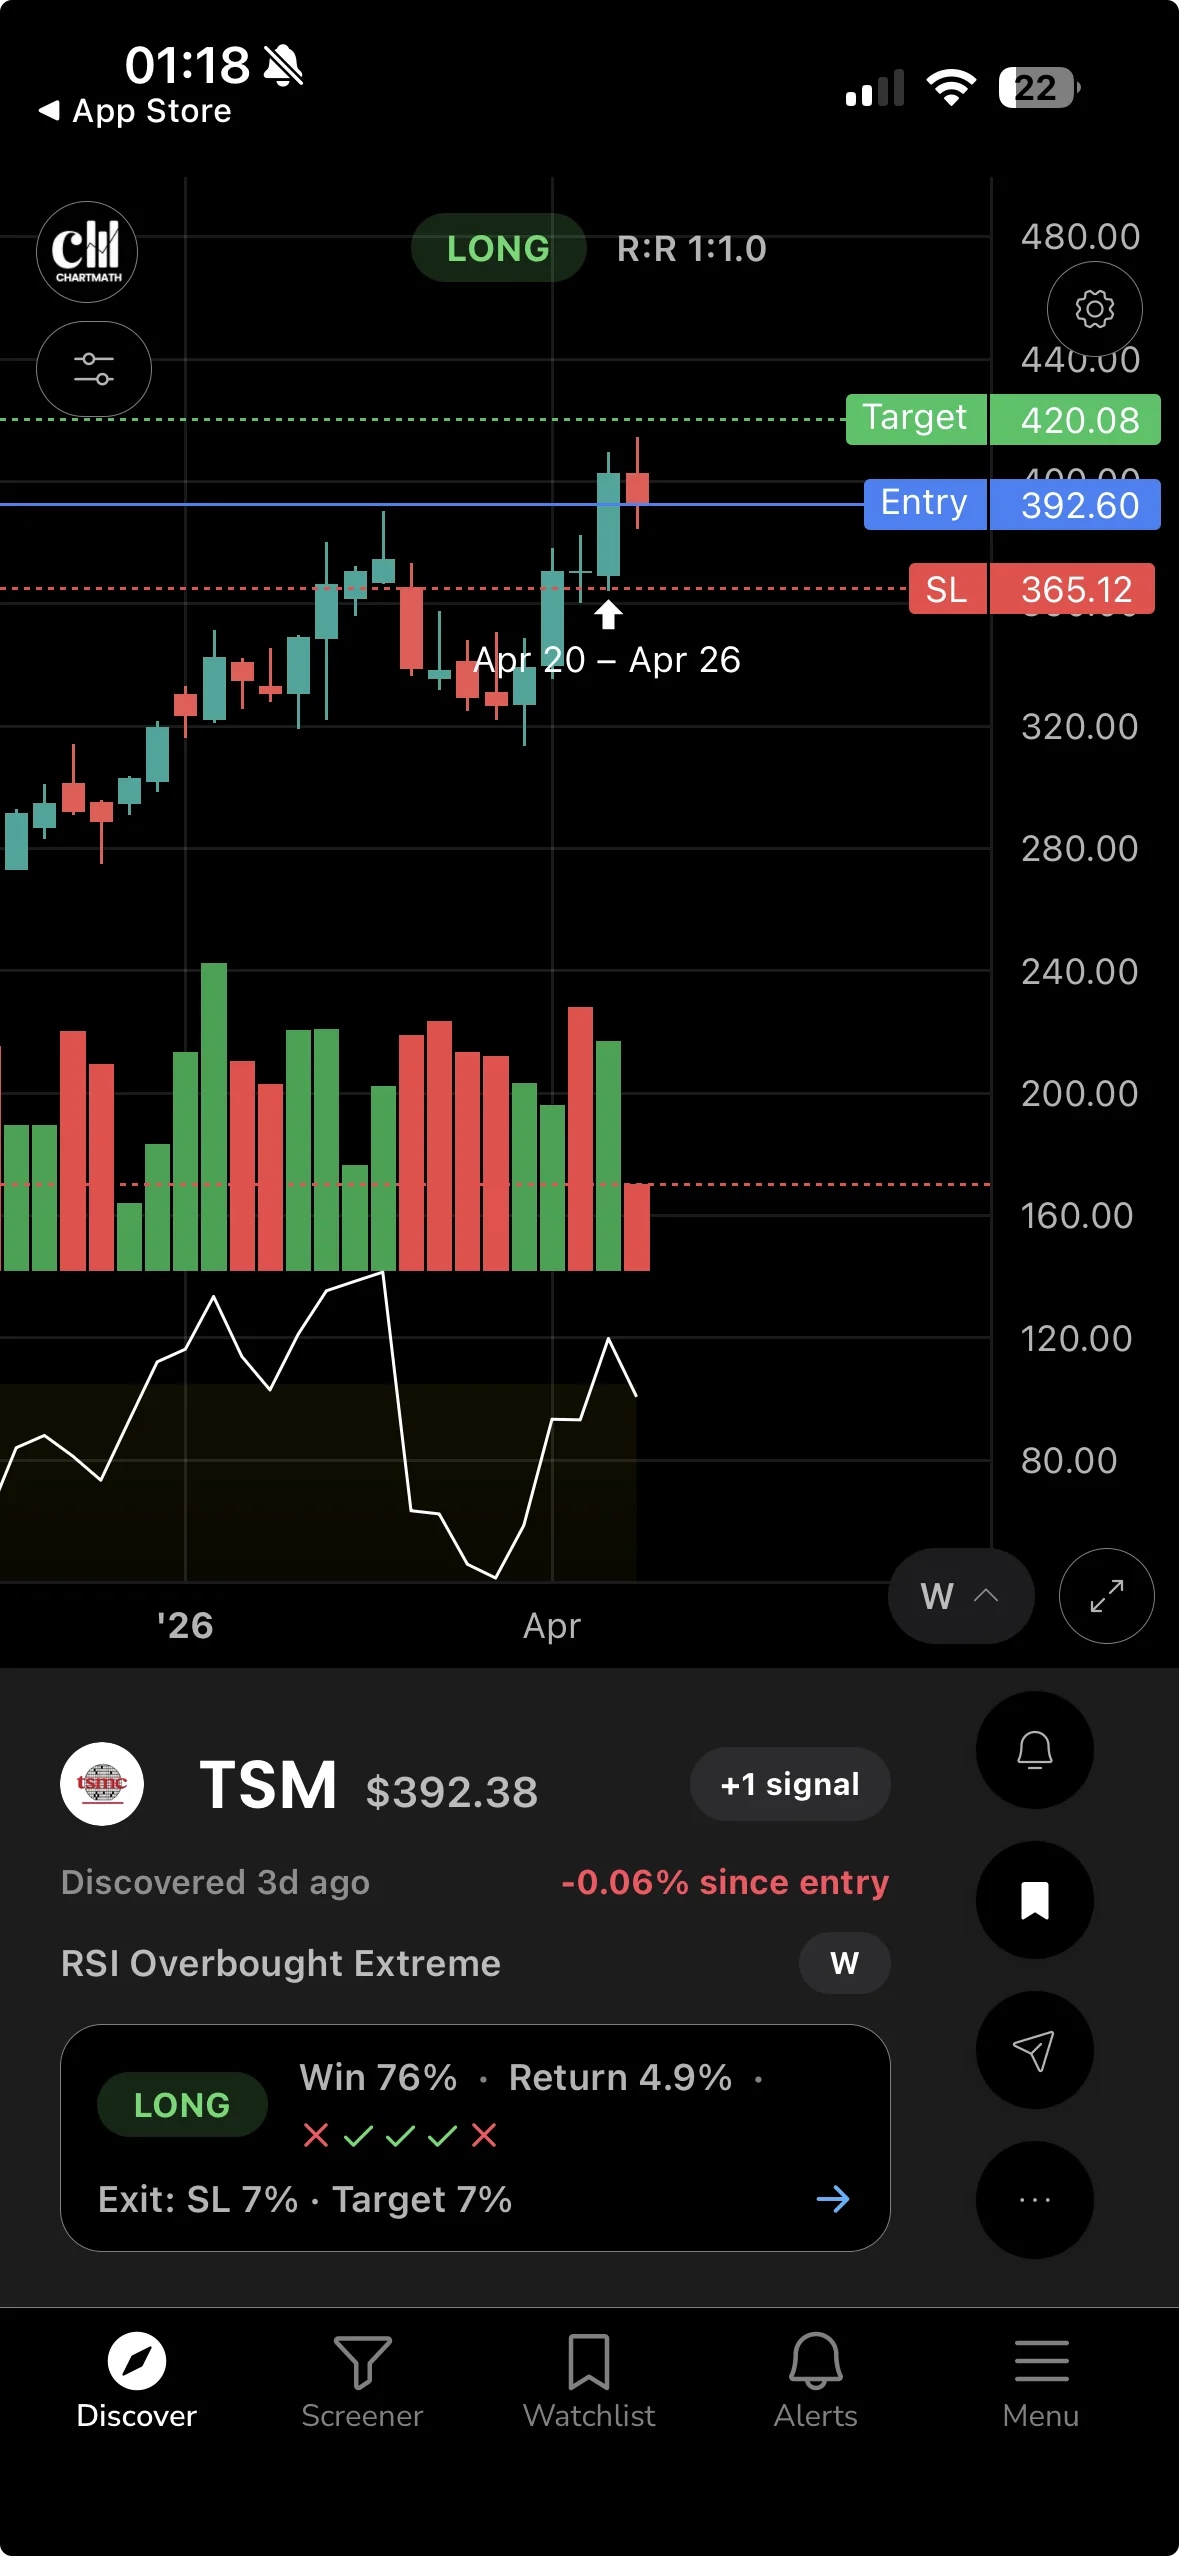
Explainable Push Alerts That Fire While You're at Work
When a stock matches a setup, ChartMath sends a push notification to your iPhone or Android device, in plain English. Not just a ticker symbol. The alert tells you which screen triggered, what the setup looks like, and what the historical edge is behind it. You can evaluate the setup in under a minute on your phone, decide whether it fits your plan, and either act or pass.
This is the core value for swing traders with day jobs. You're not refreshing a screener at lunch. The screener is watching the market for you and tapping you on the shoulder when something worth looking at appears.
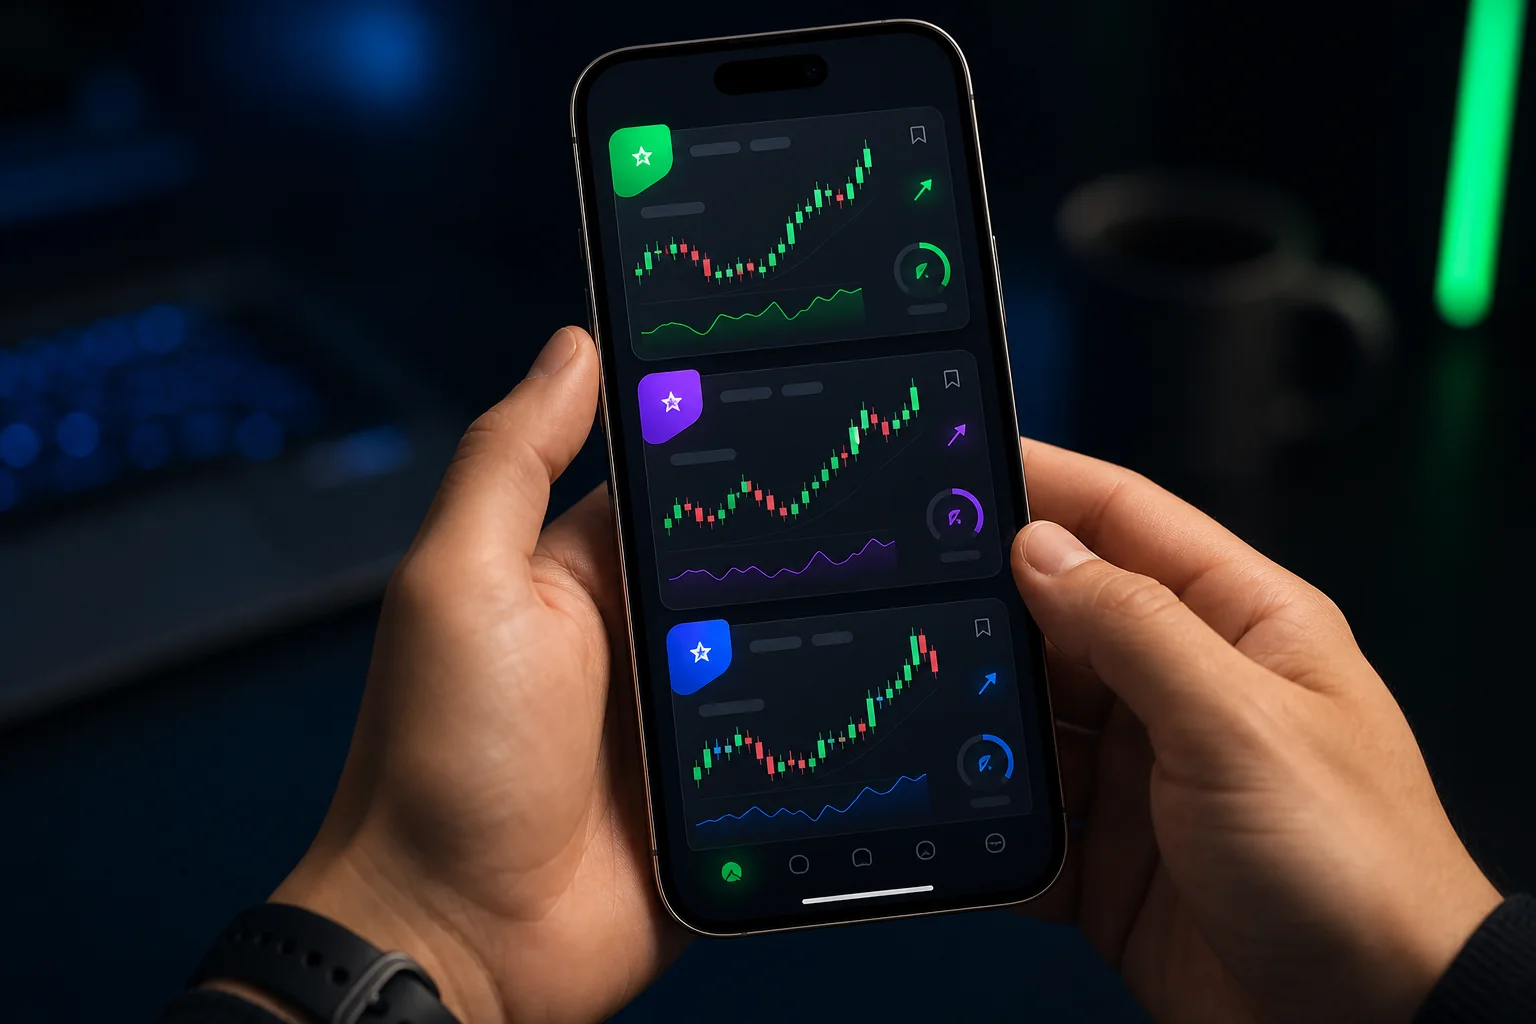
A Mobile Interface Built for Discovery, Not Desktop Habits
ChartMath uses a TikTok-style swipe interface for browsing setups. Each setup appears as a card with the chart, the trigger reason, and the backtest stats. Swipe right to add to your watchlist. Swipe left to pass. It takes about 20 seconds per setup, which means you can review 10 setups in your lunch break without squinting at a desktop-ported table.
This isn't a cosmetic choice. It reflects a real design philosophy: the app was built for a 6-inch screen first, not adapted for one later.
Multi-Timeframe Coverage for Every Schedule
ChartMath covers timeframes from 1-minute to weekly, which means it serves both swing traders reviewing daily setups after hours and active day traders catching intraday momentum plays in real time. If you're running VWAP trading strategies or watching for ORB setups at the open, the intraday screens have you covered. If you're a swing trader who reviews setups after the close, the daily and weekly screens surface what moved and what's setting up for tomorrow.
Works Alongside the Tools You Already Use
ChartMath is explicitly designed as a discovery layer, not a replacement for TradingView, TrendSpider, or Finviz. It finds the setups. You do your deeper analysis on whatever charting platform you already pay for. This is a smart positioning for traders who've already invested in a charting workflow and just need the front end of the process (finding what to look at) to be automated.
For a detailed look at how to connect ChartMath alerts with your existing charting setup, see How to Integrate Trading Alerts with Your Charting Platform.
Verdict: Best overall for swing traders with day jobs, aspiring technical traders, and anyone who wants a no-code stock screener that finds trades for you and explains each one. Download ChartMath on iOS or Android and see what you've been missing while you were in meetings.
TradingView Mobile: Best for Chart Analysis, Not Discovery
TradingView is the gold standard for charting. The mobile app is genuinely good, fast, feature-rich, and capable of displaying nearly everything the desktop version can. If you already have a setup in mind and want to pull up a chart on your phone, TradingView mobile is excellent.
The problem is that TradingView is an analysis tool, not a discovery tool. It only shows you what's happening on stocks you've already pulled up. It doesn't go find new setups across the whole market and push them to you. And if you want custom alerts beyond the basic price-level triggers, you need Pine Script, a real programming language that most self-directed traders didn't sign up to learn.
TradingView's mobile alerts also have a known limitation: push notifications for complex multi-condition alerts require a paid plan and can have latency issues during high-volume market periods. For traders who need real-time alerts on breakout and momentum setups, that's a meaningful gap.
Best for: Chart analysis on stocks you're already watching. Use it as your charting companion, not your scanner.
Not ideal for: Proactive trade discovery, no-code alert setup, or mobile-first workflows.
Trade Ideas: Powerful Desktop Tool, Awkward on Mobile
Trade Ideas has one of the most powerful real-time scanning engines in the industry. Its Holly AI system runs thousands of simulated trades overnight to identify high-probability setups for the next session. For professional day traders at a desktop, it's a serious tool.
For mobile traders, it's a different story. Trade Ideas doesn't have a native mobile app. Its web interface works on a phone, but it wasn't designed for one, the layout is dense, the configuration is complex, and evaluating a setup on a small screen takes real effort. The platform is built around a multi-window desktop workflow that simply doesn't translate to mobile.
Pricing starts at $118/month, which is a significant commitment for part-time or swing traders. The alert volume can also be overwhelming without substantial time invested in configuration, which is fine if you're a full-time trader who can dedicate that time, but a real barrier if you're trading around a day job.
Best for: Full-time professional day traders at a desktop who need institutional-grade scanning power.
Not ideal for: Mobile-first traders, swing traders with day jobs, or anyone on a budget.
Finviz and TrendSpider: Useful Tools with Mobile Blind Spots
Both Finviz and TrendSpider are genuinely useful platforms, but neither was built for mobile trade discovery, and it shows.
Finviz
Finviz is the first screener most traders bookmark, and for good reason. The filter interface is fast, the free tier is generous, and the heatmap view is genuinely useful for market overview. But Finviz's screener updates end-of-day on the free plan, and even the Elite plan doesn't send push alerts to your phone. It's a research tool you visit, not a discovery engine that comes to you.
For intraday momentum trading, VWAP setups, or any strategy that depends on real-time data, Finviz simply isn't the right tool. It's excellent for after-hours research and building watchlists, but it won't tap you on the shoulder when a breakout is happening at 10:30 AM.
TrendSpider
TrendSpider is impressive for automated chart analysis. It can identify trendlines, flag pattern completions, and run multi-timeframe analysis automatically. But it analyzes stocks you're already watching, it doesn't proactively scan the whole market and surface new setups you haven't considered.
TrendSpider also doesn't have a native mobile app with push alerts for new setups. It's a powerful desktop tool for traders who already know what they want to analyze. If you need something to find the setups in the first place, you need a dedicated scanner alongside it.
Best for: Desktop research, after-hours watchlist building (Finviz), and automated chart analysis on known tickers (TrendSpider).
Not ideal for: Real-time mobile alerts, proactive trade discovery, or intraday scanning.
Feature-by-Feature Comparison: What Separates the Best from the Rest
Here's how the major platforms stack up across the criteria that matter most for mobile traders:
| Feature | ChartMath | TradingView | Trade Ideas | Finviz | TrendSpider |
|---|---|---|---|---|---|
| Real-Time Push Alerts | ✅ Yes | ⚠️ Limited | ❌ No native app | ❌ No | ❌ No |
| Proactive Trade Discovery | ✅ Yes | ❌ No | ✅ Yes | ⚠️ EOD only | ❌ No |
| No Coding Required | ✅ Yes | ❌ Pine Script | ⚠️ Complex UI | ✅ Yes | ⚠️ Partial |
| Backtest Data Per Setup | ✅ Yes | ⚠️ Manual | ⚠️ AI score only | ❌ No | ✅ Yes |
| Native Mobile App | ✅ iOS & Android | ✅ iOS & Android | ❌ Web only | ❌ Web only | ❌ Web only |
| Explainable Alerts | ✅ Yes | ❌ No | ⚠️ Partial | ❌ No | ❌ No |
| Free Tier Available | ✅ Yes | ✅ Yes | ❌ No | ✅ Yes | ❌ No |
The pattern is clear. ChartMath is the only platform in this comparison that checks all five boxes that matter for mobile-first trade discovery: real-time push alerts, proactive scanning, no coding required, backtest transparency, and a native mobile app. Every other platform excels in at least one area, but none covers the full stack for a trader who needs the market to come to them.
For a deeper breakdown of which technical indicators power the best setups, see VWAP vs RVOL vs ORB: Which Technical Indicators Work Best?
How to Integrate a Mobile Scanner Into Your Trading Workflow
The best mobile scanner app is only as good as the workflow it fits into. Here's how to build a practical routine around ChartMath as your discovery layer, whether you're a swing trader reviewing setups after hours or an active trader catching intraday plays between meetings.

Premarket Routine (15, 20 Minutes)
Before the market opens, check your ChartMath alerts from the previous evening and overnight. The app surfaces daily and weekly setups that triggered after the close, stocks forming bases, approaching key levels, or showing unusual volume patterns. Review the setup cards, check the backtest stats, and build a short watchlist of 3, 5 names worth watching at the open.
This is also when you'd cross-reference with your charting platform. ChartMath tells you what to look at. TradingView or TrendSpider tells you exactly where the key levels are. For a structured approach to this routine, see Premarket Trading: 7 Strategies to Find High-Probability Setups.
Intraday (Alerts to Your Phone)
During market hours, let ChartMath do the watching. You've set up your watchlist and your preferred screens, VWAP reclaims, ORB breakouts, RVOL spikes, momentum setups. When a stock matches, you get a push notification with the setup explained in plain English. You glance at it, decide in 30 seconds whether it fits your plan, and either act or pass.
You don't need to refresh anything. You don't need to be watching a screen. The scanner is running continuously in the background, and it only interrupts you when something worth your attention appears.
After-Hours Review (20, 30 Minutes)
After the close, use ChartMath's daily and weekly screens to review what set up during the session and what's building for tomorrow. This is the core workflow for swing traders, reviewing the day's setups, updating your watchlist, and preparing your plan for the next session. The swipe interface makes it fast: you can evaluate 15, 20 setups in under 30 minutes on your phone.
For a complete framework around this routine, see Swing Trading for Busy Professionals: 30-Minute Daily Guide.
The Key Principle: Discovery First, Analysis Second
The most important shift in this workflow is separating discovery from analysis. ChartMath handles discovery, finding which stocks are worth looking at. Your charting platform handles analysis, figuring out exactly where to enter, where to stop, and what the risk/reward looks like. When you stop trying to make one tool do both jobs, both jobs get done better.
You can also use ChartMath's web-based screener for deeper desktop research when you have more time, it runs the same 200+ screens and backtest data in a browser, so your workflow is consistent whether you're on your phone or at your desk.
Frequently Asked Questions
What is a stock screener that finds trades for you?
A stock screener that finds trades for you is a tool that continuously scans the entire market against a set of technical criteria and proactively alerts you when a stock matches a setup, rather than waiting for you to manually search. The key difference from a standard screener is the push: instead of you going to the tool, the tool comes to you. ChartMath is built specifically for this use case, running 200+ screens in real time and sending explainable push alerts to your phone when a setup triggers.
Do I need coding skills to use these apps?
It depends on the platform. TradingView requires Pine Script for custom multi-condition alerts. Trade Ideas has a complex configuration interface that takes significant time to learn. ChartMath requires zero coding, all 200+ screens are pre-built and ready to use out of the box. You can add stocks to your watchlist and start receiving alerts in minutes without writing a single line of code.
Can I use a mobile scanner alongside TradingView or TrendSpider?
Yes, and that's exactly how ChartMath is designed to be used. It acts as a discovery layer on top of whatever charting platform you already use. ChartMath finds the setups. TradingView or TrendSpider helps you analyze them in depth. You don't have to choose between them; they solve different parts of the same problem.
What's the difference between a scanner and a screener?
The terms are often used interchangeably, but there's a practical distinction. A screener typically filters a static list of stocks based on criteria you define, you run it when you want results. A scanner runs continuously in real time and alerts you the moment a stock meets your criteria. For active traders, a real-time scanner is more useful during market hours. For swing traders reviewing setups after hours, a screener with end-of-day data can work, but real-time alerts are still valuable for catching intraday entries. ChartMath does both.
Which app is best for swing traders vs. day traders?
For swing traders with day jobs, ChartMath is the clear choice. The daily and weekly screens, explainable alerts, and mobile-first design are built exactly for this use case. For active day traders who are closer to the screen and need institutional-grade scanning power, Trade Ideas is worth the cost, if you're at a desktop. For traders who want a no-code, mobile-first option that covers both intraday and swing setups, ChartMath covers both timeframes without requiring a desktop setup or a $118/month subscription.
What technical setups does ChartMath scan for?
ChartMath scans across 200+ pre-built screens including breakouts, 52-week highs, VWAP reclaims, RVOL spikes, Opening Range Breakouts (ORB), momentum setups, gap plays, and more, across timeframes from 1-minute to weekly. Every screen comes with backtest data so you know the historical edge before you trade it. For a look at the setups that tend to perform best, see 15 Proven Technical Setups Every Day Trader Should Know.
The Bottom Line
The best stock scanner app for mobile isn't the one with the most features. It's the one that fits your actual trading life, the one that watches the market while you're at work, sends you alerts you can act on in 30 seconds, and doesn't require a computer science degree to set up.
TradingView is the best charting app. Trade Ideas is the most powerful desktop scanner. Finviz is the best free research tool. But none of them is a stock screener that finds trades for you and delivers them to your phone with context, backtest data, and a plain-English explanation of why the setup triggered.
That's what ChartMath was built to do. If you've been missing entries while you're at work, spending your evenings manually scanning charts, or drowning in alerts that tell you nothing useful, this is the tool that changes that workflow.
Stop scanning. Start discovering. Download ChartMath on iOS or Android and let the scanner do the work, or watch a quick demo to see exactly how the alerts and setup cards work before you download.

Ankush Jindal
LinkedInSee these setups live in ChartMath
200+ curated screens with backtest data. 14-day free trial.