Best Stock Screener With Backtested Win Rates 2026
You've just watched a stock clear resistance on a screener you refresh a dozen times a day. Volume is up, the chart looks clean, and part of you wants to click buy right now. But here's the question almost nobody asks before pulling the trigger: has this exact setup ever actually worked before? Not "does it look good." Has it made money historically, and how often?
That question is the entire reason to look for the best stock screener with backtested win rates instead of settling for a tool that just flags tickers and leaves you to guess the rest. Most popular screeners hand you a list of names that match a filter. They don't tell you whether that filter has ever produced a winning trade, how often it wins, or what the average return looked like when it did. You're left trading on pattern recognition and hope.
This guide breaks down why that gap exists in tools like TradingView, Finviz, and Trade Ideas, what real edge data should look like, and how to evaluate any screener's win-rate claims before you risk a single dollar on them.
The Missing Layer in Most Stock Screeners
A screener's basic job is simple: apply a rule (price above the 200-day moving average, RSI under 30, volume 2x the average) and return a list of matches. That's useful for narrowing a universe of stocks down to a manageable watchlist. But a list of matches is not evidence of an edge. It's just a filter doing what filters do.
The problem shows up the moment you try to size a position or decide whether to take the trade at all. If you don't know a setup's historical win rate or its average return per occurrence, you're guessing at both. You might risk too much on a setup that only wins 40% of the time, or skip a setup that's actually quietly reliable because it doesn't "feel" strong on the chart. Gut feel and chart aesthetics are not the same thing as documented performance.
Backtested win rate data closes that gap. It turns "this looks like a good setup" into "this setup has fired X times historically, won Y% of the time, and averaged Z% return per trade." That's the difference between trading on a hunch and trading with a documented, testable edge, which is exactly what a resource like validating a swing trade setup before you risk capital is built around.
What Does "Backtested Win Rate" Actually Mean?
Win rate is the percentage of historical instances where a setup produced a profitable outcome, based on a defined exit rule. Average return is the mean gain or loss per occurrence across that same sample. Neither number means much alone. A screen that wins 70% of the time but loses big on the other 30% can still be a losing strategy over the long run. A screen that only wins 45% of the time but has winners that are three times the size of its losers can be very profitable. You need both figures, plus a sense of the sample size behind them, to actually judge whether a setup has a real edge.
Sample size matters more than most traders give it credit for. A setup that "won" its last four occurrences tells you almost nothing statistically. A setup that has triggered 150 or 200 times across multiple market conditions and still holds a consistent win rate is a much stronger signal. Small samples are exactly how traders talk themselves into bad conclusions after a lucky streak, which is a pattern worth reading more on in how to build winning backtesting strategies.
It's also worth being honest about what a backtest is and isn't. A historical win rate reflects past bar-close data under a specific set of rules. It's not a live, fee-adjusted, guaranteed forward return. Markets change, liquidity changes, and past performance never promises future results. The value of backtested win rate data isn't certainty, it's context. It tells you whether a setup has historically had an edge worth testing further, not whether tomorrow's trade is a sure thing.
Why Most Popular Screeners Skip This Data
If backtested win rate data is this useful, why don't more screeners show it? Mostly because it's genuinely hard to build. You need clean historical price data, a rules engine that can simulate entries and exits consistently, and a way to present that history without misleading the user. Most screening tools were built to filter and chart, not to grade their own signals.
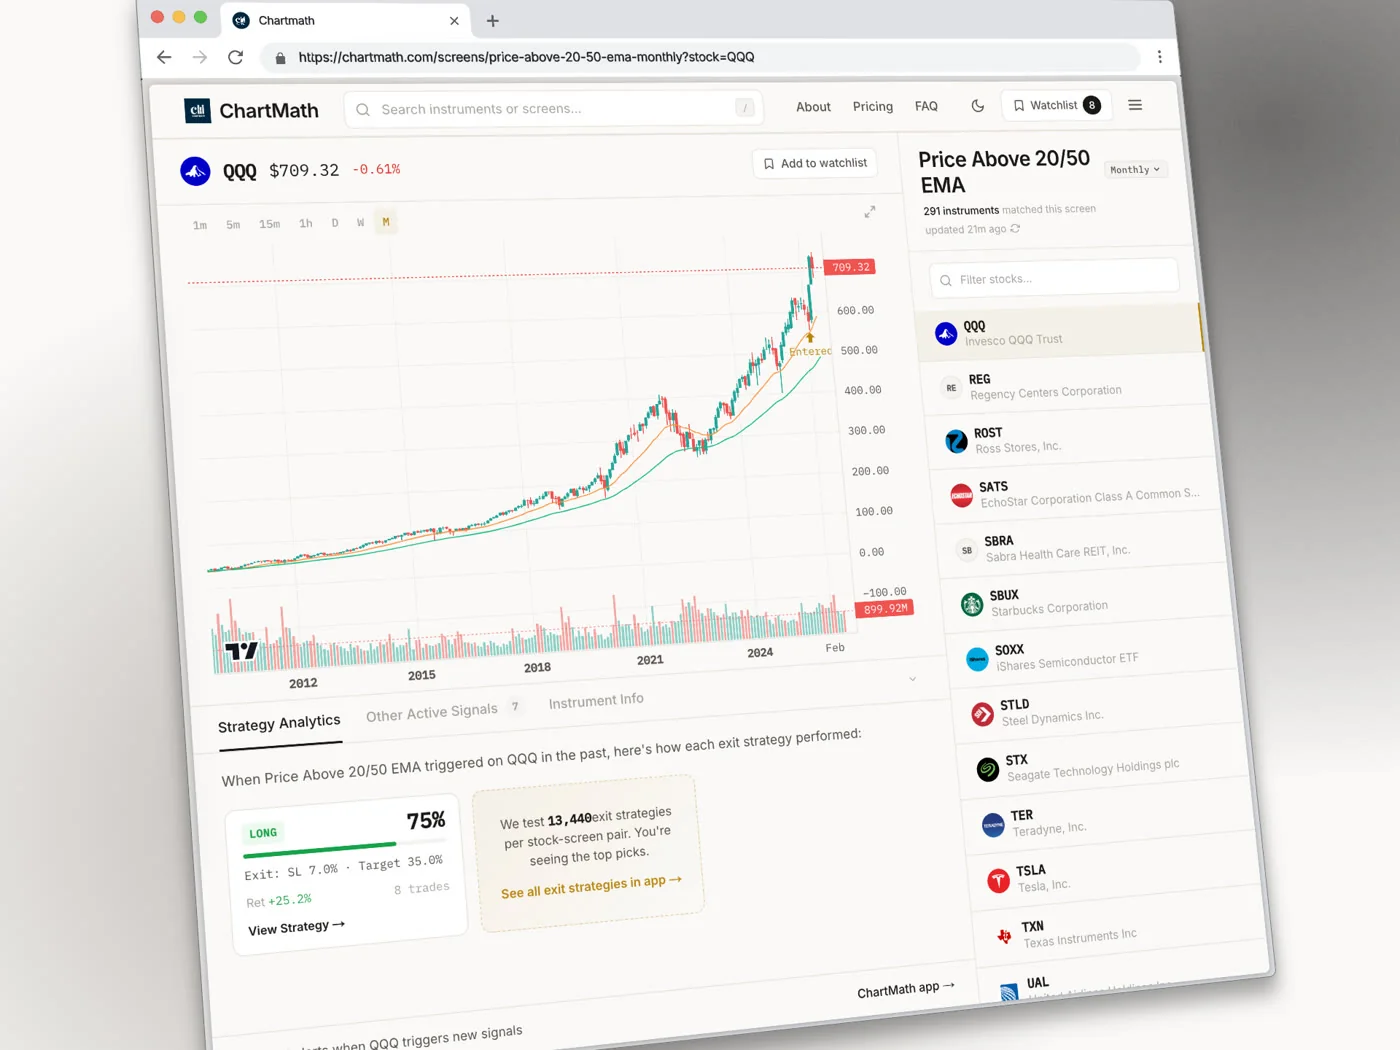
TradingView is a phenomenal charting platform with flexible screeners and a huge community of custom scripts. What it doesn't do out of the box is attach a historical win rate to a screener result. You can build a Pine Script strategy and backtest it yourself, but that takes coding knowledge most part-time traders don't have time to develop. For traders who want TradingView's charting alongside something that fills this gap, a VWAP trading companion that shows historical performance on the same setups can round out the workflow.
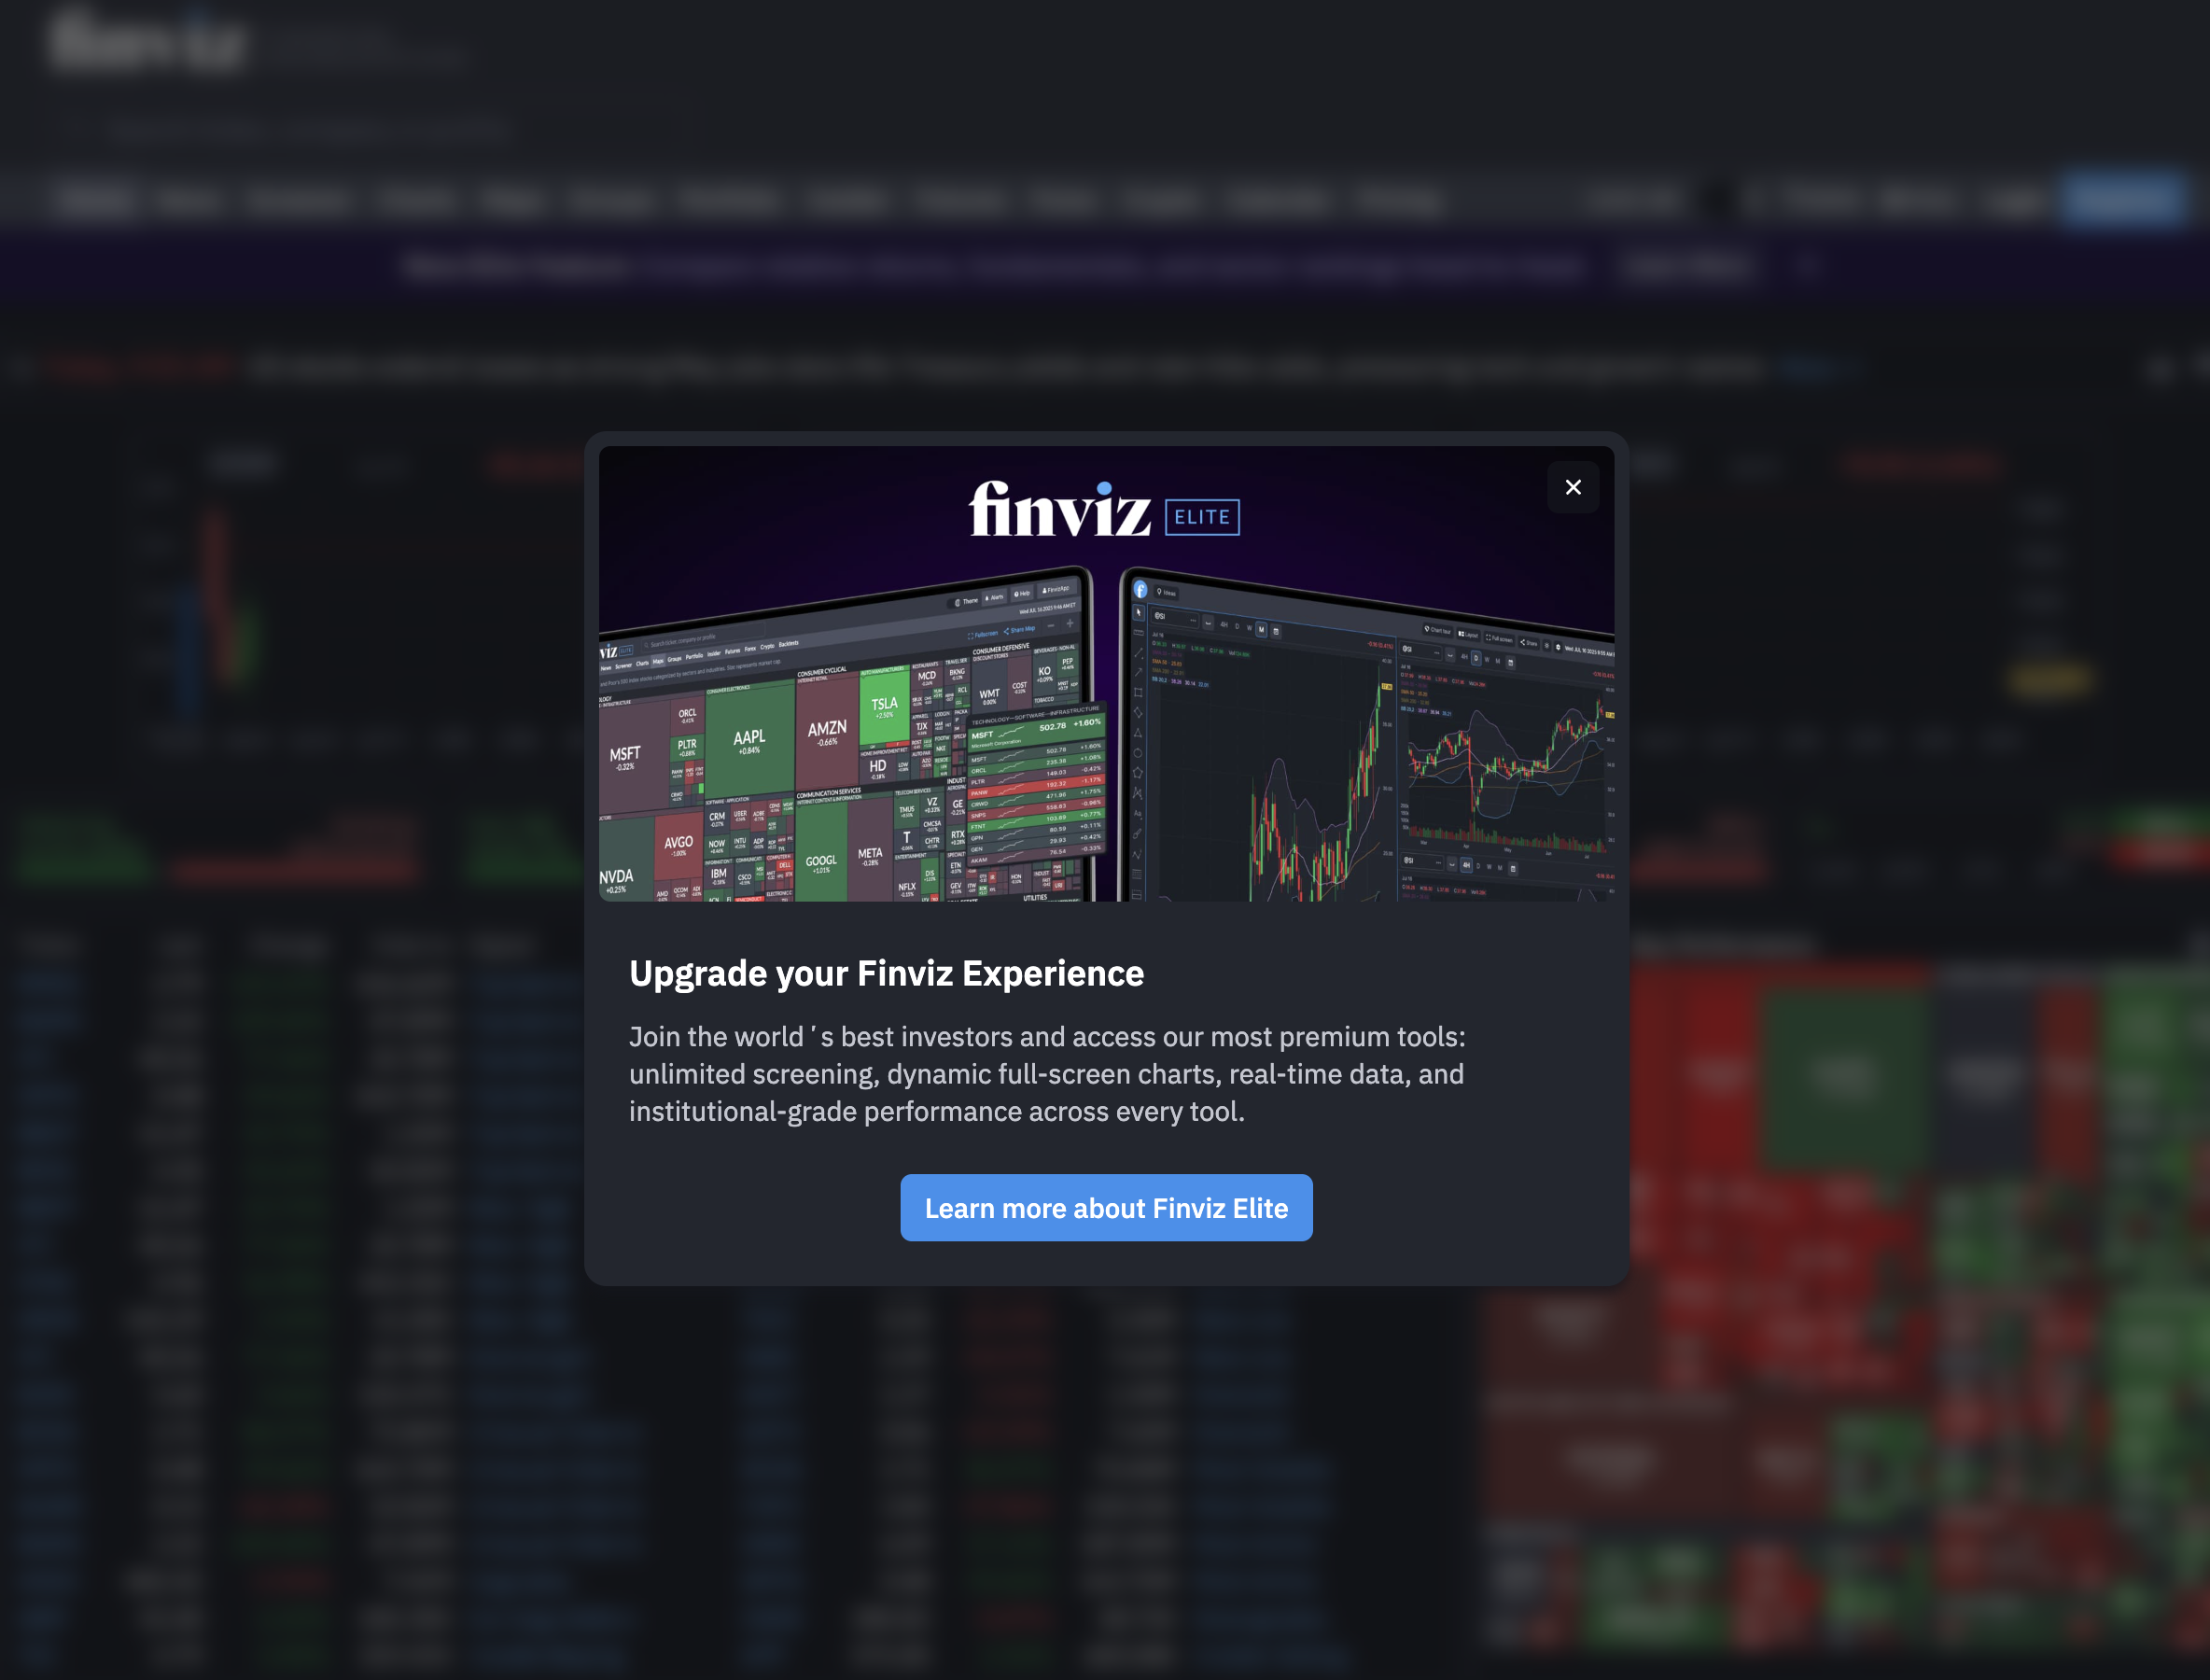
Finviz is the classic free screener, and it's genuinely good at fast filtering. But it's a static tool. You set filters, you refresh, you scroll. There's no push alert when a new stock matches, and there's no historical win rate attached to any filter combination. You're back to refreshing the page and eyeballing the chart, which is the exact workflow that turns into "you've refreshed Finviz 47 times today and still don't have a plan."
Trade Ideas is a step up in scanning power, with real-time alerts and a more sophisticated engine under the hood. It's a serious tool for active traders. But the cost and complexity are real barriers for someone trading around a day job, and win-rate-first workflows aren't the default experience. You still have to know what you're looking for and interpret the scan results yourself.
Signal groups on Discord and Telegram are the least rigorous option of all. A human posts a ticker and an entry, sometimes with a chart screenshot, rarely with any documented history. What gets shared tends to be the winners; the losing calls quietly disappear from memory. There's no backtest, no sample size, and no way to separate a lucky call from a repeatable edge.
What to Look For When Evaluating a Screener's Edge Data
Not every tool that claims to show "backtested" results is showing you something useful. Here's a practical checklist to run before you trust any screener's edge data:
- Win Rate shown per setup, not just overall. A blended win rate across every possible filter combination tells you nothing about the specific setup you're about to trade.
- Average Return alongside Win Rate. One number without the other is incomplete. A high win rate with tiny average wins and occasional large losses can still be a losing system.
- Disclosed sample size. Ask how many times the setup has actually fired historically. Four occurrences is not fourteen hundred.
- A plain-English reason the signal fired. "RSI crossed above 30 with rising volume" is useful. A bare ticker symbol with no rule attached is not.
- Push and email alerts, not just a dashboard you have to remember to check. Alert fatigue is real when every group chat and every app is buzzing, but silence is worse when the setup you've been waiting on fires while you're in a meeting.
- Coverage across the timeframes you actually trade. A 1-minute scalp setup and a Weekly swing setup need different data, and a good screener should span both.
This checklist matters because alert fatigue and signal noise push a lot of traders toward ignoring alerts altogether, which defeats the purpose of having a screener in the first place. A tool that only tells you what matched, without the history behind it, adds noise instead of removing it. If you've felt that fatigue, the workflow breakdown in avoiding alert fatigue from stock screeners style content is worth a look, and the watchlist alerts post covers how to tune alerts so they fire at the right moments instead of constantly.
How ChartMath Approaches Backtested Win Rates
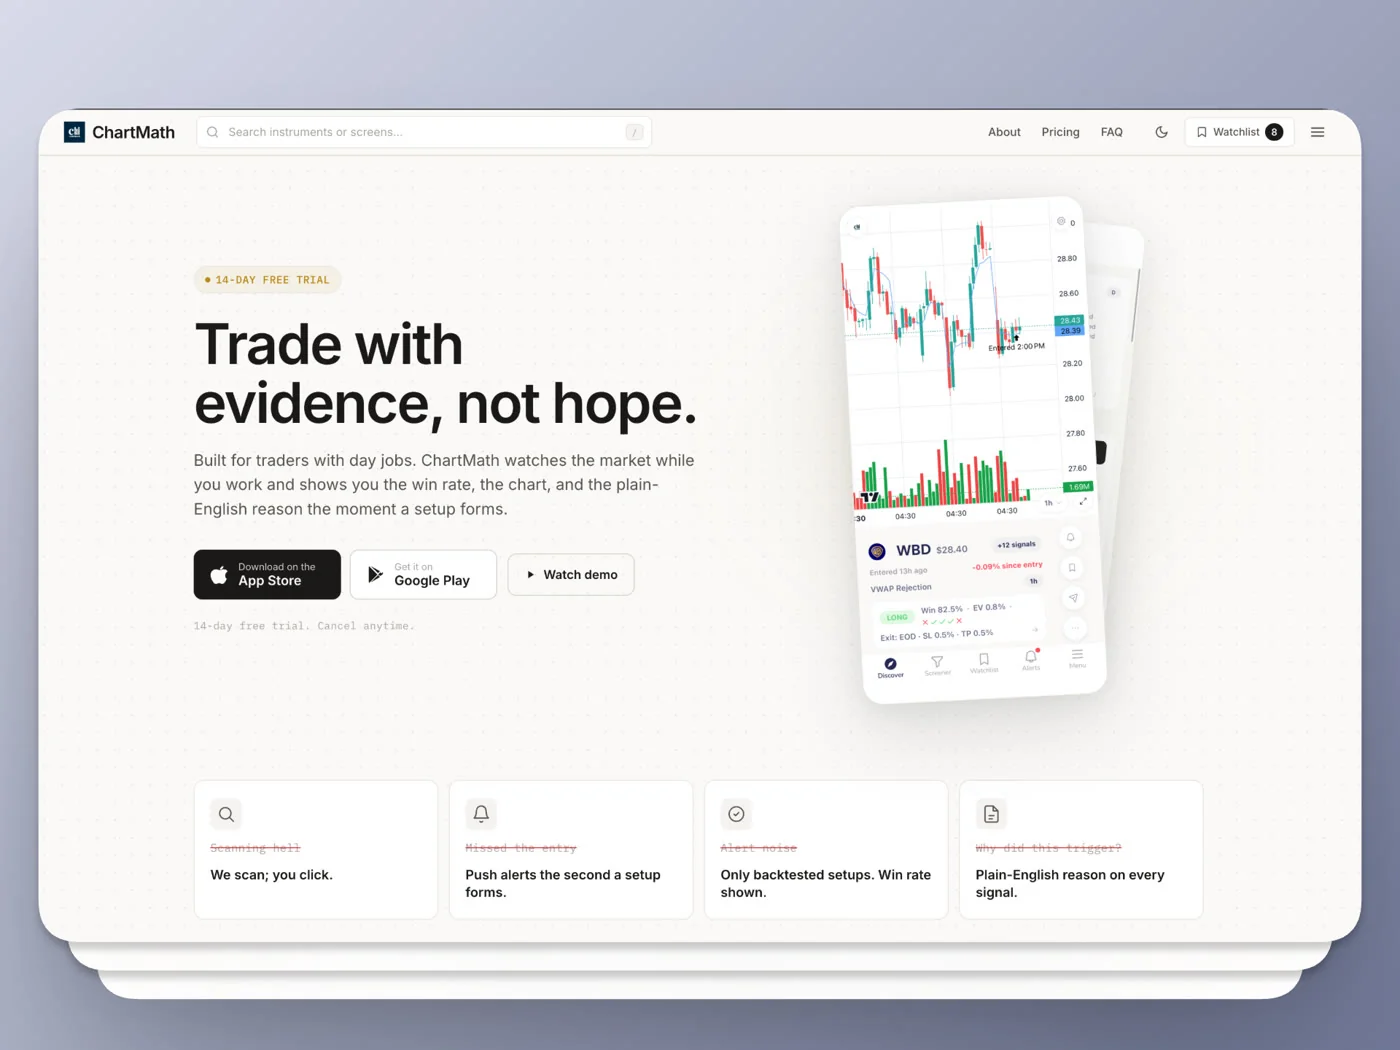
ChartMath was built specifically around this gap. It's a mobile-first trade-discovery app that scans a curated universe of 500+ US equities, across 200+ pre-built, read-only technical screens and 7 timeframes from 1-minute up to Monthly. Every one of those screens carries its own Win Rate and Avg. Return, calculated from historical bar-close data, not a generic "accuracy" score that hides what's actually being measured.
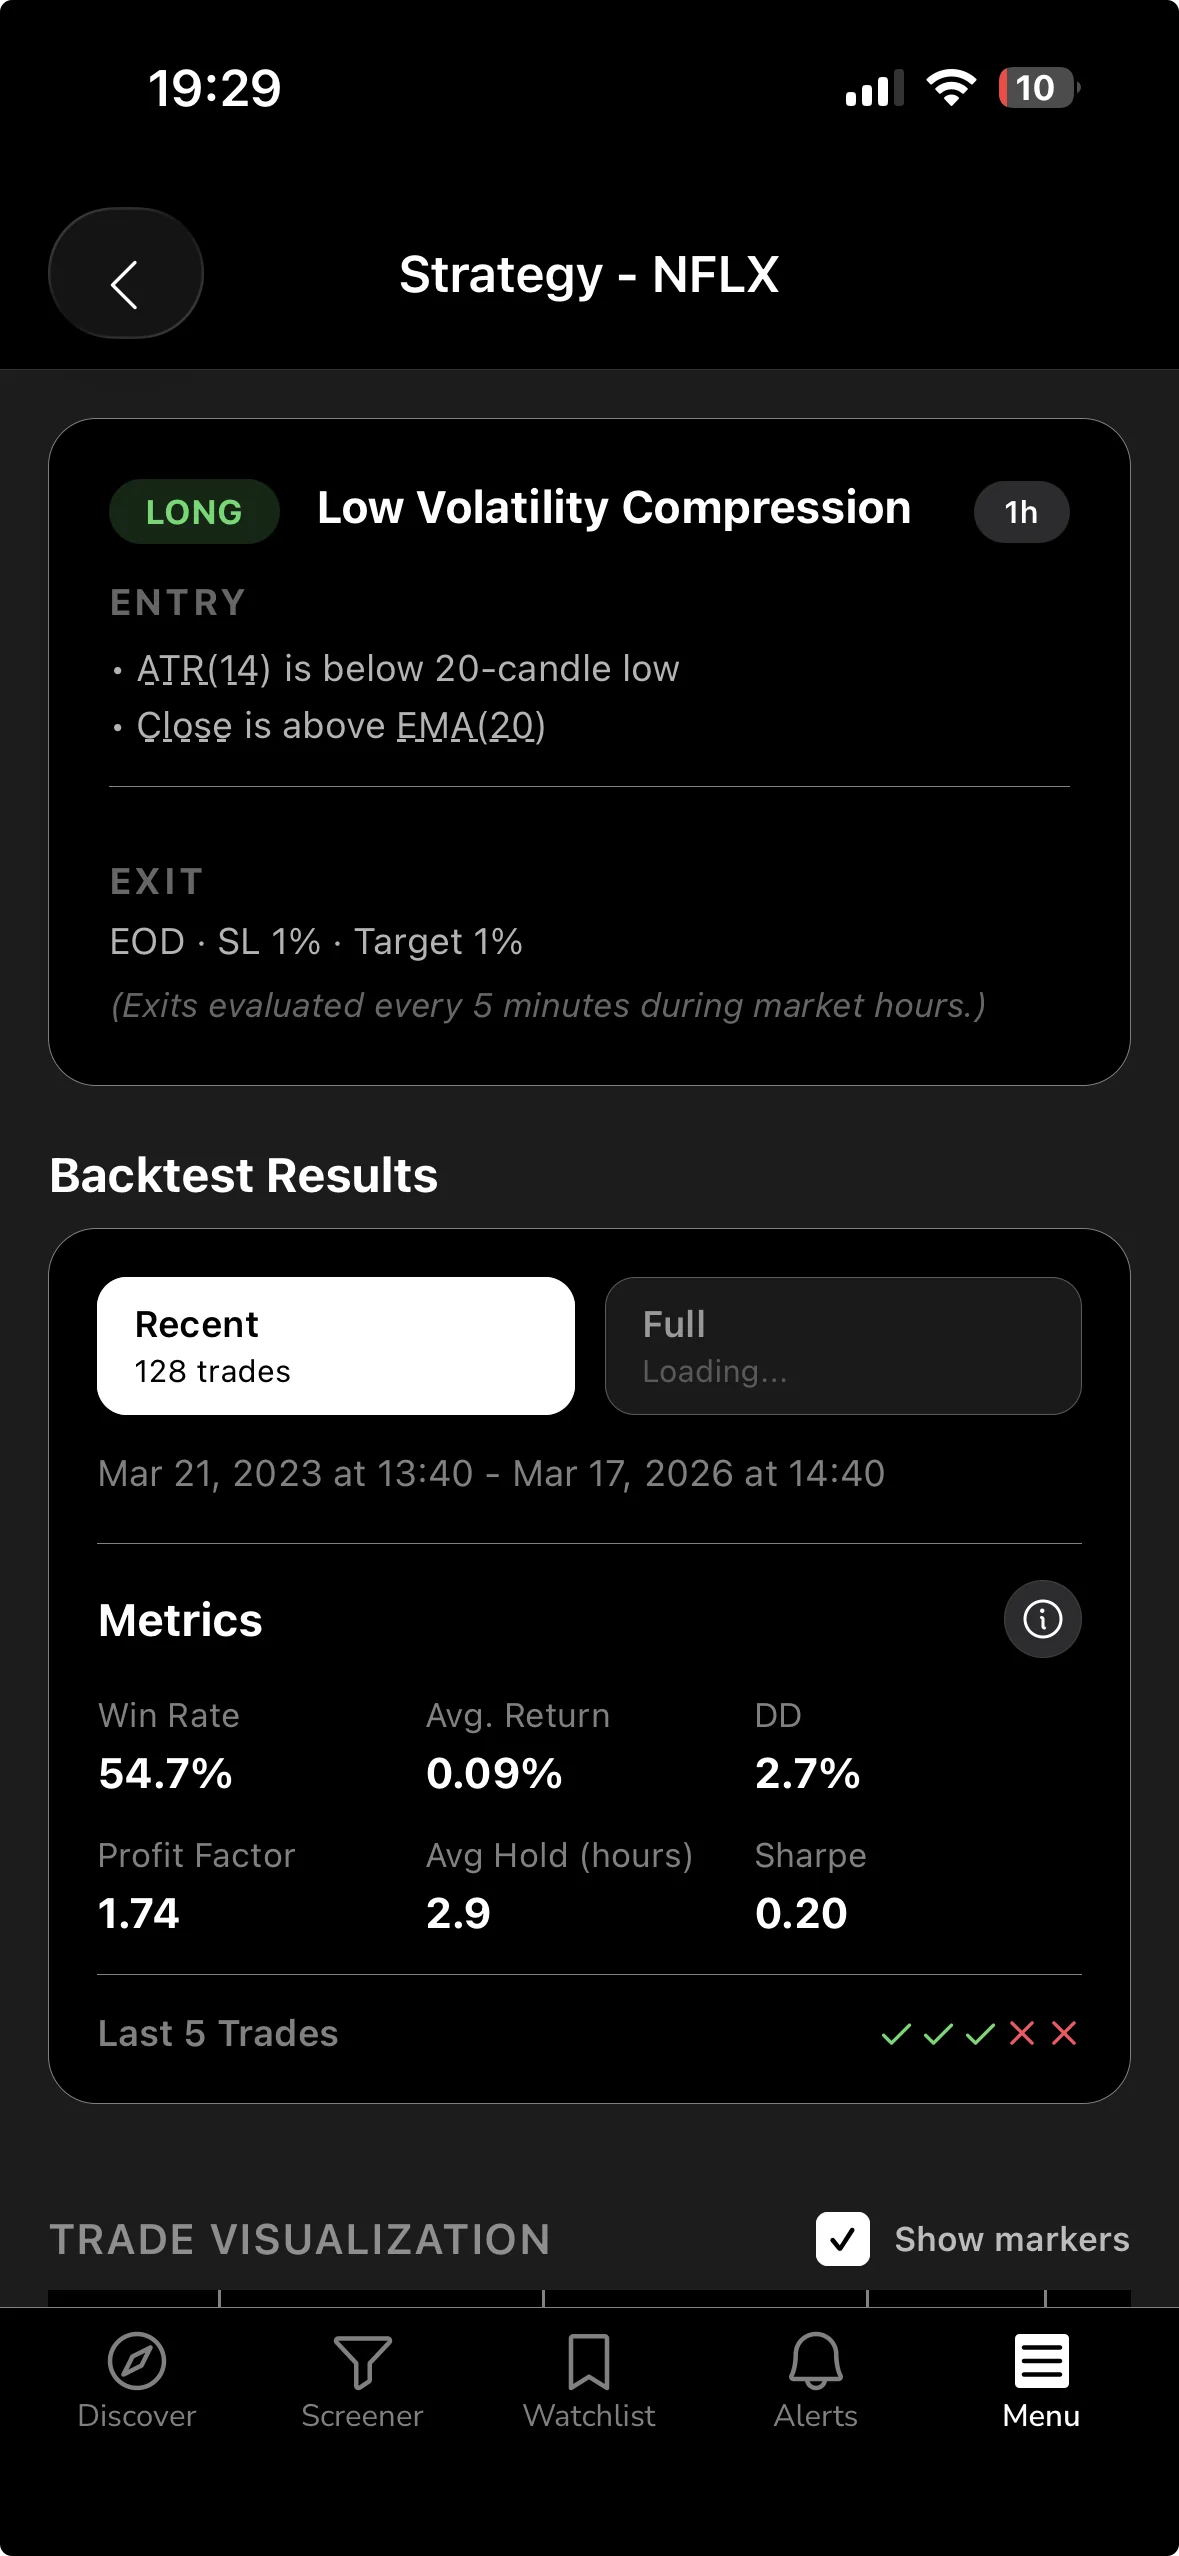
The Discover feed is the signature surface. Instead of a bare ticker symbol, each card explains, in plain English, why a stock matched a setup right now, along with its historical Win Rate and Avg. Return so you're not evaluating the signal blind. There's no user-built screen editor here; the 200+ screens are curated and backtested before they ever ship, which means no Pine Script and no coding required to get a documented edge on a setup.
Alerts go out by push and email, so you find out the moment a stock enters a screen you're watching instead of discovering it hours later. And to be clear about what ChartMath isn't: it doesn't connect to your broker, and it doesn't place trades. It's a copilot, not autopilot. It surfaces the setup and the historical context; you still make the call and execute it in your own brokerage account. That distinction matters if you're evaluating a Trade Ideas alternative or a Finviz alternative, since some tools blur the line between discovery and execution in ways that can create false confidence.
Backtested Win Rate vs. Raw Signal: A Side-by-Side Look
Picture the same VWAP reclaim setup showing up in two different tools. On a raw signal feed, you get a ticker symbol and maybe a note that price crossed back above VWAP. That's it. You're left to decide, on the spot, whether this is a trade worth taking, based on nothing but the chart in front of you.
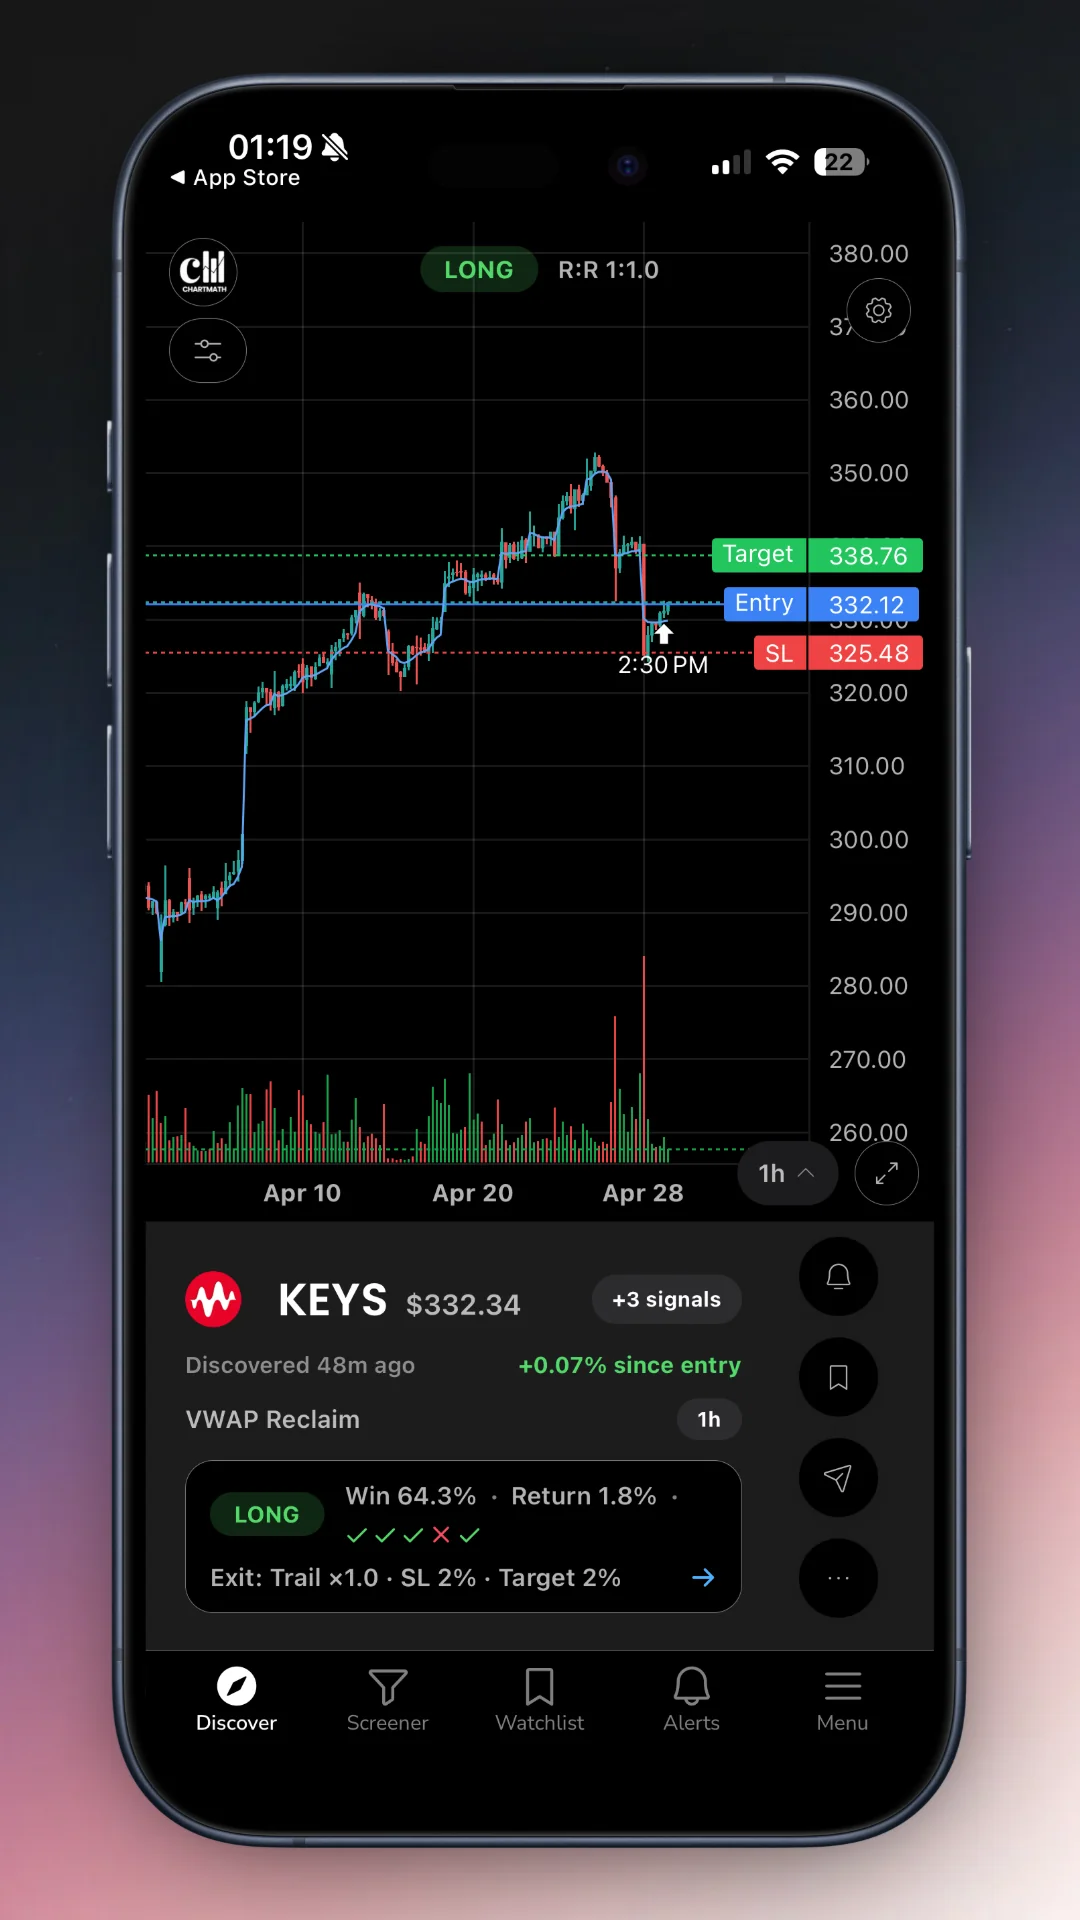
On a win-rate-first workflow, the same signal comes with its documented history attached: how many times this specific screen has fired, what percentage of those instances were profitable, and what the average return looked like across the sample. That context changes how you approach the trade. If the sample size is thin, you treat the setup with more caution or wait for further confirmation. If the win rate and average return both look solid across a meaningful sample, you can size the position with more conviction, using your own position sizing rules (a common approach is risking 1-2% of account equity per trade, regardless of how strong a setup looks).
The difference isn't that one workflow guarantees a winning trade and the other doesn't. Neither does. The difference is that one gives you actual information to make a decision with, and the other asks you to trust your eyes and your gut under time pressure. If you're building a repeatable process around RVOL trading, momentum breakouts, or VWAP reclaims, having the historical context in front of you before you act is what turns a hunch into a rule-based decision.
How to Evaluate and Use Win Rate Data Without Getting Overconfident
A backtested win rate is a tool, not a promise. It's worth internalizing a few guardrails so the data helps you instead of giving you false confidence.
First, a high win rate on its own doesn't mean a strategy is profitable. If a setup wins 75% of the time but the average loss on the other 25% is five times the average win, the math can still lose money over a large enough sample. Always look at Win Rate and Avg. Return together, never one without the other.
Second, watch the sample size behind any number you're shown. A setup with a strong win rate over 15 occurrences is a much weaker signal than one with a similar win rate over 300 occurrences. Small samples swing wildly and can flatter or punish a strategy based on pure luck.
Third, remember that backtests reflect historical rules applied to historical data. They generally use bar-close entries and don't model live-trading frictions like commissions, slippage, or bid-ask spread. That doesn't make the data useless, it just means you should treat a backtested win rate as a strong starting filter, not a live guarantee, and continue to apply your own risk management on top of it.
Finally, use win rate data as one input in a repeatable review process, not a one-time check. Tracking which setups you actually traded, and how they performed against their historical numbers, is one of the fastest ways to build real confidence in a system. A structured version of this habit is covered in how to run a weekly trading review in 20 minutes.
Building a Screener-Backed Trading Workflow
Backtested win rate data is most useful when it's built into a routine, not just glanced at once before a single trade. Start by setting up watchlist alerts tied to specific screens that match your trading style, rather than trying to watch every possible setup across every ticker. A day trader leaning on 1-minute or 5-minute screens has a very different rhythm than a swing trader working off Daily or Weekly charts, and the right screener should let you filter by the timeframes that actually fit your schedule.
From there, let alerts do the watching. Instead of refreshing a static list, push and email alerts mean you find out the moment a stock enters a screen you care about, whether you're at your desk or in a meeting. This is the core fix for anyone who has tried to combine a full-time job with active trading; the workflow breakdown in how to trade stocks without watching screens all day and swing trading with a full-time job both dig into building a schedule around alerts instead of screen time.
Close the loop with a weekly review. Look back at which screens actually triggered, which ones you traded, and how the outcomes compared to their documented Win Rate and Avg. Return. Over a few months, this turns a stack of individual trades into a track record you can actually learn from, and it's a habit worth pairing with a broader efficient trading workflow so screening, alerts, and review all fit together instead of living as separate, disconnected steps.
Frequently Asked Questions
Is a high win rate the same as a profitable strategy?
No. Win rate only tells you how often a setup was profitable historically, not by how much. A setup can win most of the time and still lose money overall if the average loss is much bigger than the average win. Always check Win Rate alongside Avg. Return before judging a setup's edge.
Do TradingView or Finviz show backtested win rates?
Not natively. TradingView lets advanced users build and backtest custom Pine Script strategies, but it requires coding knowledge and doesn't attach a historical win rate to its built-in screeners by default. Finviz is a static filtering tool with no built-in backtesting or win rate data attached to its scans.
What's a reasonable sample size for a backtested screen?
There's no single magic number, but a screen that has triggered only a handful of times shouldn't carry much weight. Look for setups with a large enough historical sample, ideally across different market conditions, so the win rate reflects a repeatable pattern rather than a short lucky or unlucky streak.
Do I need to know how to code to use ChartMath?
No. The 200+ screens are curated and backtested before they ship, so there's no Pine Script and no coding required. You get the Win Rate and Avg. Return on each setup out of the box, without building or maintaining a backtest engine yourself.
Does ChartMath place trades for me?
No. ChartMath is a discovery and alerting tool, a copilot rather than an autopilot. It surfaces setups with their historical Win Rate and Avg. Return and explains why a signal fired, but you make the decision and place the trade yourself in your own brokerage account.
Choosing the best stock screener with backtested win rates comes down to one question: does the tool give you documented history before you risk capital, or just a list of tickers and a chart? If you're ready to stop guessing which setups actually have an edge, you can download the ChartMath app and see Win Rate and Avg. Return on every one of its 200+ screens for yourself. Prefer to browse first? Check out the web-based screener to explore the full catalog, or watch a quick demo to see the Discover feed and alerts in action before you commit to a new workflow.

See these setups live in ChartMath
200+ curated screens with backtest data. Free. No credit card required.