Best TrendSpider Alternative for Trade Discovery
Pull up TrendSpider right now. Draw your trendlines. Set your multi-timeframe analysis. It's genuinely impressive software. Now answer one question: how did you decide which stock to open in the first place?
That question is where most traders hit a wall. TrendSpider is a powerful chart analysis platform, but it only works on tickers you already know to look at. The discovery work — scanning hundreds of stocks, spotting which ones are forming high-probability setups right now — still falls entirely on you. For a trader with a day job, that's the part of the workflow that breaks first.
This post compares TrendSpider against tools built specifically for proactive trade discovery, with a focus on what busy swing traders actually need: a system that surfaces setups to them, not the other way around.
TrendSpider Is a Charting Tool, Not a Discovery Engine
TrendSpider launched in 2017 with a genuinely clever idea: automate the tedious parts of technical analysis. Automated trendline detection, multi-timeframe analysis on a single chart, raindrop charts that show volume distribution over time. For a trader who already knows what they want to analyze, it removes a lot of manual work.
That's the key phrase: "already knows what they want to analyze." TrendSpider's workflow starts with a ticker. You type in a symbol, and TrendSpider goes to work on it. The platform's screener can help you build a watchlist, but it requires you to define the conditions, configure the filters, and maintain the setup. That's a meaningful time investment, and it assumes you have the technical knowledge to translate a trading idea into screener logic.
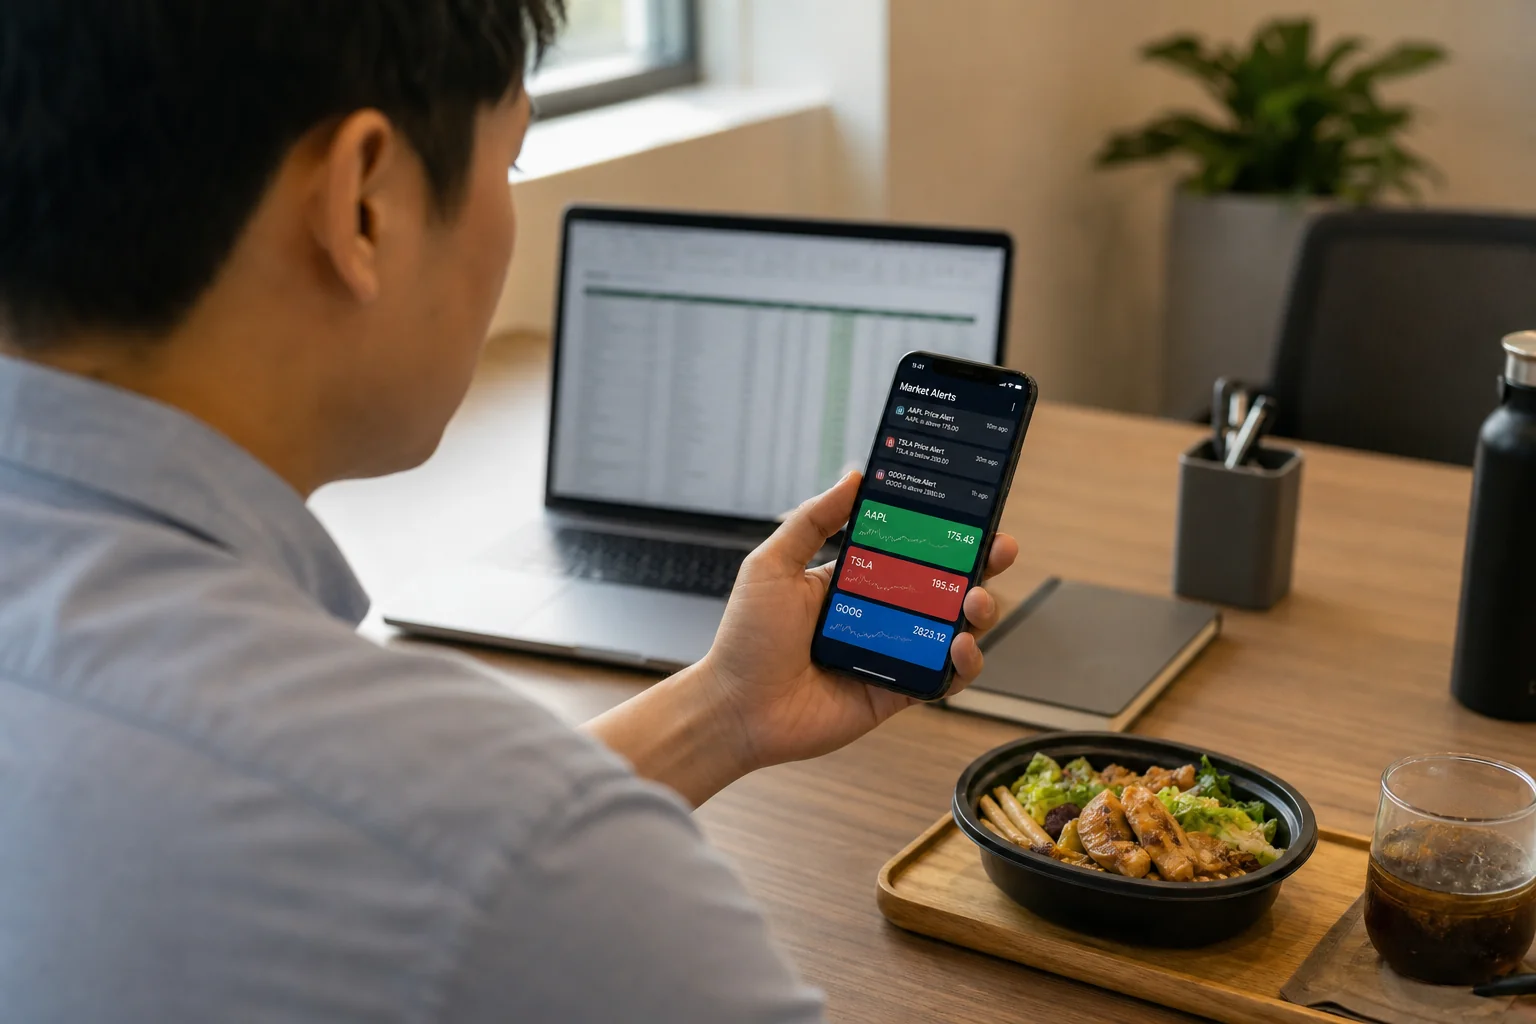
For a professional day trader sitting at multiple monitors from 9:30 AM to 4:00 PM, that workflow makes sense. For a swing trader who checks their phone between meetings and has maybe 30 minutes in the evening to prep, it's a different story. The discovery problem doesn't get solved by better charting. It gets solved by a tool that does the scanning for you.
What "Trade Discovery" Actually Means (and Why It's Different from Charting)
Charting and discovery are two separate jobs, and most traders conflate them. Charting is what you do after you've identified a candidate: you pull up the chart, draw your levels, check the indicators, and decide whether the setup is worth trading. Discovery is what happens before that — the process of finding which stocks, out of hundreds, are forming actionable setups right now.
Most retail traders handle discovery manually. They scroll through a watchlist, check a few Reddit threads, glance at a screener they set up six months ago, and hope something jumps out. That process is slow, inconsistent, and heavily biased toward whatever they already know. Stocks they've never heard of, forming textbook setups on elevated volume, never make it onto the radar.
A true trade discovery tool flips the workflow. Instead of you going to the market, the market comes to you. Setups that match pre-defined, backtested criteria fire an alert the moment they form. You review the candidate, verify it on your charting platform, and decide whether to act. The discovery work is done before you even open the app.
That distinction matters enormously for traders with day jobs. If you can only give the market 20 minutes in the evening, you need those 20 minutes to be spent on evaluation and decision-making, not on manually scanning for candidates. That's the gap TrendSpider doesn't fill, and it's the gap a tool like ChartMath is built specifically to close.
For a deeper look at building a workflow around this principle, the guide on how to trade stocks without watching the screen all day covers the full system.
TrendSpider vs. ChartMath: A Head-to-Head Comparison
Let's put the two tools next to each other across the dimensions that matter most for a swing trader with a day job.
Universe and Coverage
TrendSpider covers a broad range of US equities, crypto, and futures, and lets you build screens across that universe. ChartMath scans a curated universe of 500+ US equities, 100 crypto pairs, and 11 US futures across 7 timeframes: 1m, 5m, 15m, 1h, Daily, Weekly, and Monthly. The ChartMath universe is intentionally curated rather than exhaustive, which means the signal-to-noise ratio stays high.
Screener Approach
TrendSpider's screener is flexible and powerful, but it requires you to build and maintain your own conditions. If you want to screen for VWAP reclaims on elevated relative volume, you configure that logic yourself. ChartMath takes the opposite approach: 200+ curated, read-only technical screens are pre-built and backtested before they ship. There's no screen builder, no Pine Script, no coding. You pick from what's already validated. For traders who want to use a stock scanner without Pine Script, that's a meaningful difference.
Alerts
TrendSpider supports price alerts and indicator-based alerts, but they require manual setup per ticker. You have to know which stock to watch, then configure the alert condition for that specific stock. ChartMath's alerts work differently: they fire the moment any stock in the universe enters a screen, across all 500+ equities, without you having to pre-select tickers. Alerts go out via push and email, carrying the ticker, timeframe, screen name, and a plain-English explanation of why the setup triggered.
Backtesting and Performance Metrics
TrendSpider has a strategy tester that lets you backtest custom conditions. It's capable, but it requires you to build the strategy first. ChartMath attaches Win Rate and Average Return to every screen, calculated from historical backtests, so you know the historical edge of a setup before you act on it. Every alert comes with that context baked in. There's no separate backtesting step required.
One important note: ChartMath's backtests use bar-close entries with no look-ahead bias. They do not yet model commissions, slippage, or spread. Past performance of any screen does not guarantee future results. The metrics are a starting point for evaluation, not a promise of outcome.
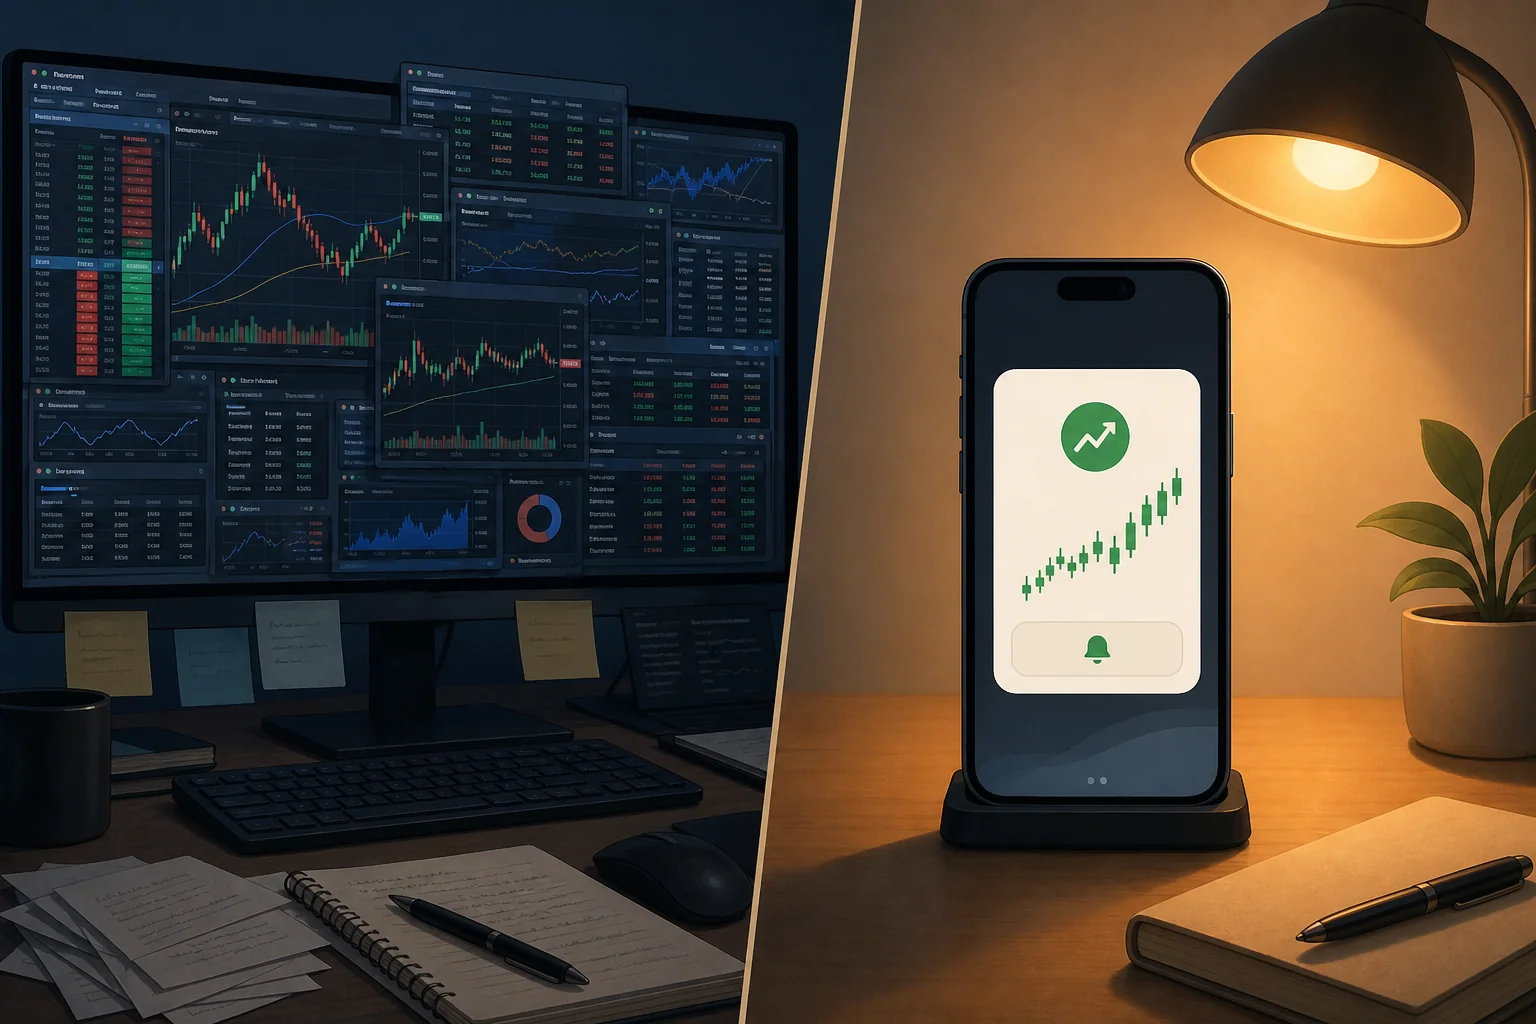
Mobile Experience
TrendSpider is primarily a desktop platform. It has a mobile app, but the core workflow is designed around a large screen with multiple panels. ChartMath is mobile-first by design, available on iOS and Android, with a swipe-based Discover feed built for checking setups on your phone between meetings. There's also a read-only web browse layer at chartmath.com/screens for desktop review.
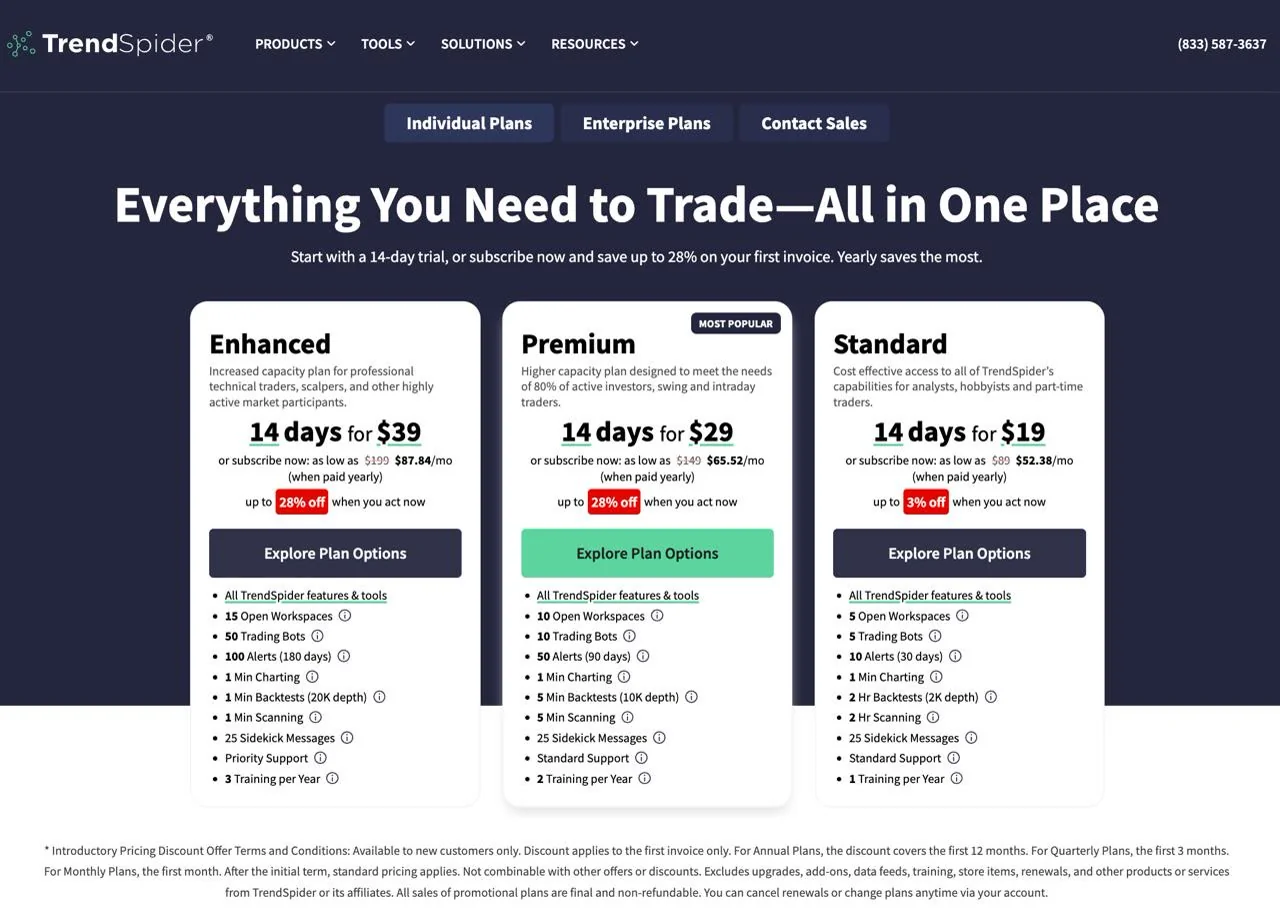
Pricing
TrendSpider operates on paid subscription tiers. ChartMath is currently in open beta, with the full screen library, backtesting tools, and alerts accessible during this early period. Paid plans will be introduced at a later date, and users who join during beta retain founding pricing upon that transition.
Who Each Tool Is Built For
| Feature | TrendSpider | ChartMath |
|---|---|---|
| Primary use case | Chart analysis and strategy testing | Proactive trade discovery and alerts |
| Discovery workflow | You bring the ticker | The app surfaces the setup to you |
| Screen setup | Build your own conditions | 200+ curated, ready-made screens |
| Coding required | Optional but helpful | None |
| Alert type | Price/indicator alerts (manual setup) | Explainable push and email alerts |
| Backtest data per alert | Requires separate strategy test | Win Rate and Avg. Return on every card |
| Mobile-first | No | Yes (iOS and Android) |
| Pricing | Paid tiers | Open beta, full access |
Where TrendSpider Falls Short for the Busy Swing Trader
None of this is a knock on TrendSpider as a product. It does what it's designed to do very well. The issue is that what it's designed to do doesn't match the workflow of a trader who has four hours a week to spend on the market.
The first problem is the starting-point assumption. TrendSpider assumes you already have a ticker in mind. Every feature, from automated trendlines to multi-timeframe analysis, is applied to a chart you've already opened. If you don't know which 10 stocks to look at today, TrendSpider can't tell you. You're still doing that work manually.
Alert setup is the second issue. TrendSpider's alerts are powerful, but they require you to configure conditions for specific tickers. That means you need to know which stocks to watch, then set up the alert logic for each one. For a trader with a 50-stock watchlist and limited time, that's a maintenance burden that compounds over time.
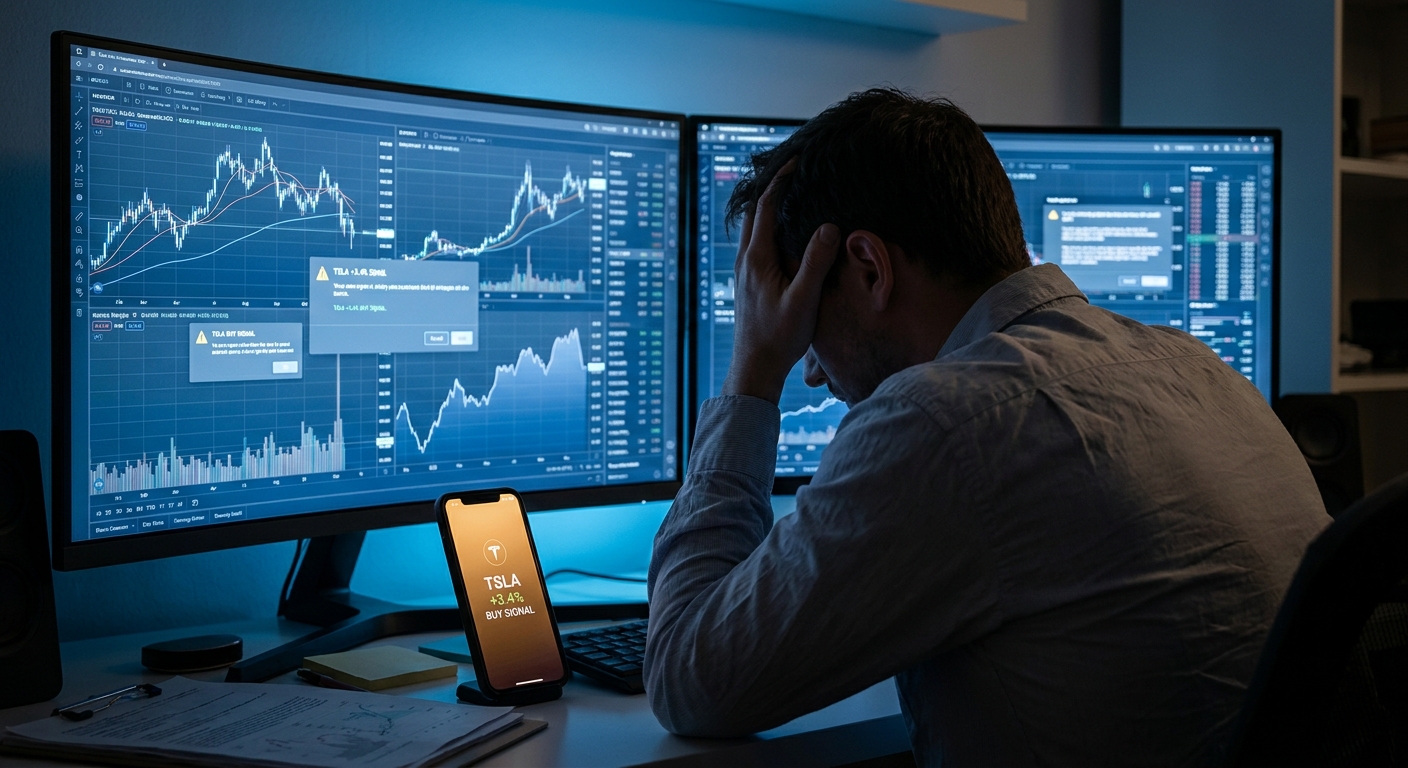
Third, there's no plain-English explanation. When a TrendSpider alert fires, it tells you that a condition was met. It doesn't explain why that condition matters, what the historical edge looks like, or what the setup implies about near-term price action. That context gap forces you to do additional research before you can evaluate the trade.
Finally, the desktop-first design works against you. TrendSpider's most powerful features are built for a large screen. If your trading window is a 15-minute lunch break or a quick check between meetings, the platform's depth becomes friction rather than an asset.
For a full breakdown of how to build a workflow that actually fits a day-job schedule, the post on building an efficient trading workflow in 2026 is worth reading alongside this comparison.
How ChartMath Fills the Discovery Gap
ChartMath is built around a single premise: the market should come to you, not the other way around. Every design decision in the app flows from that idea.
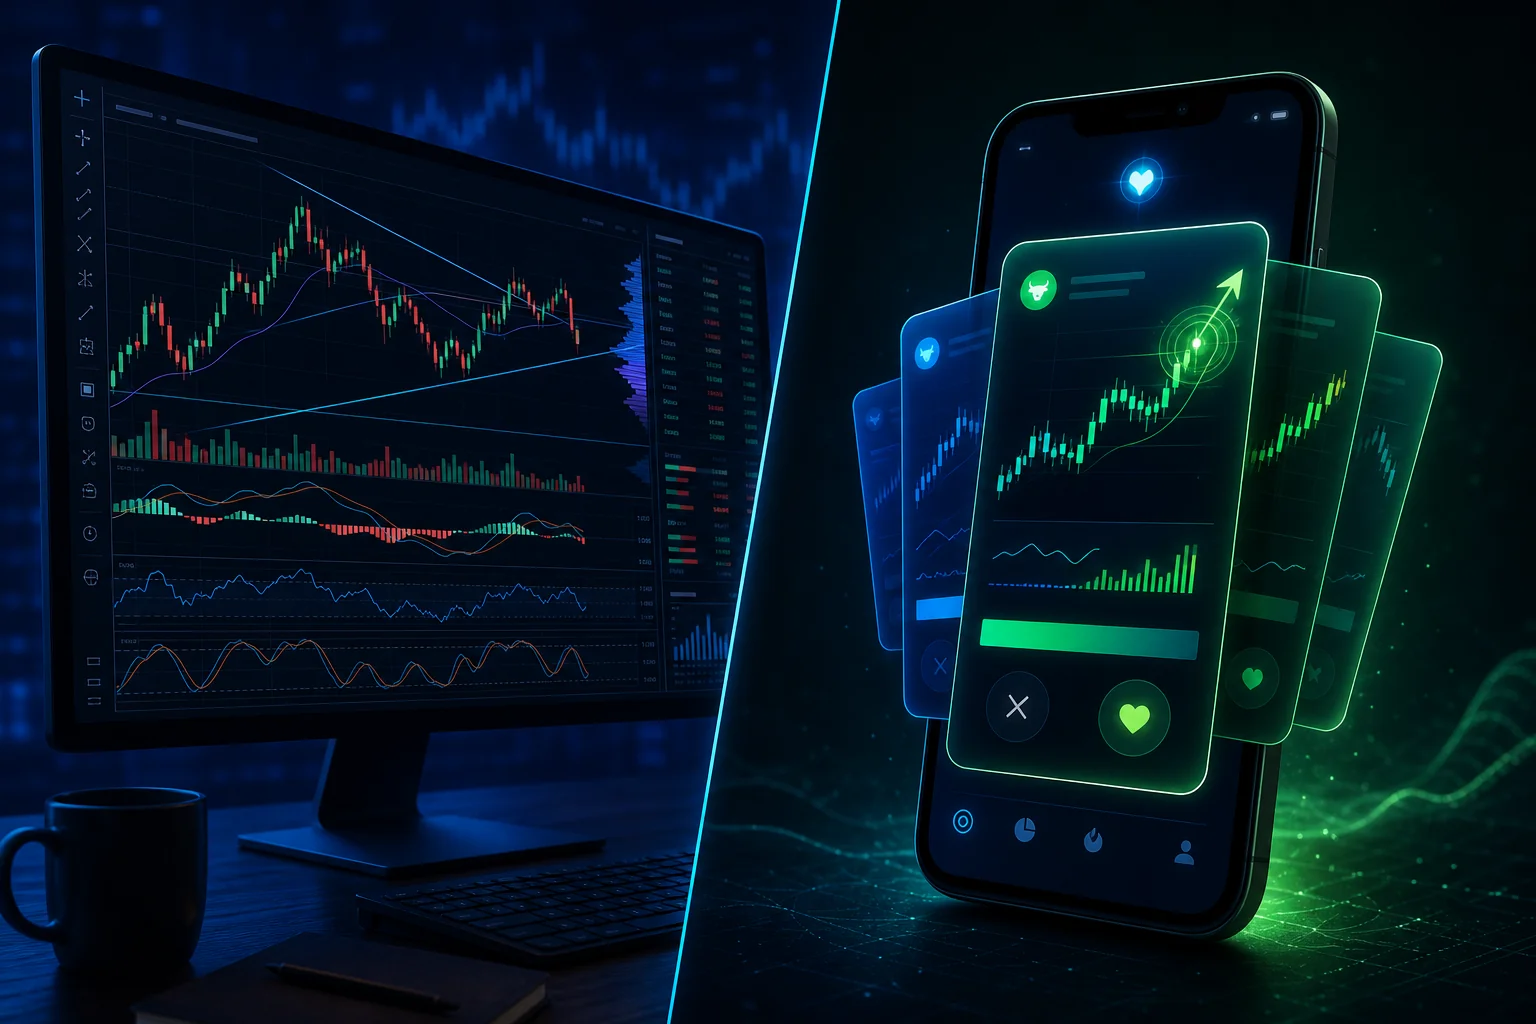
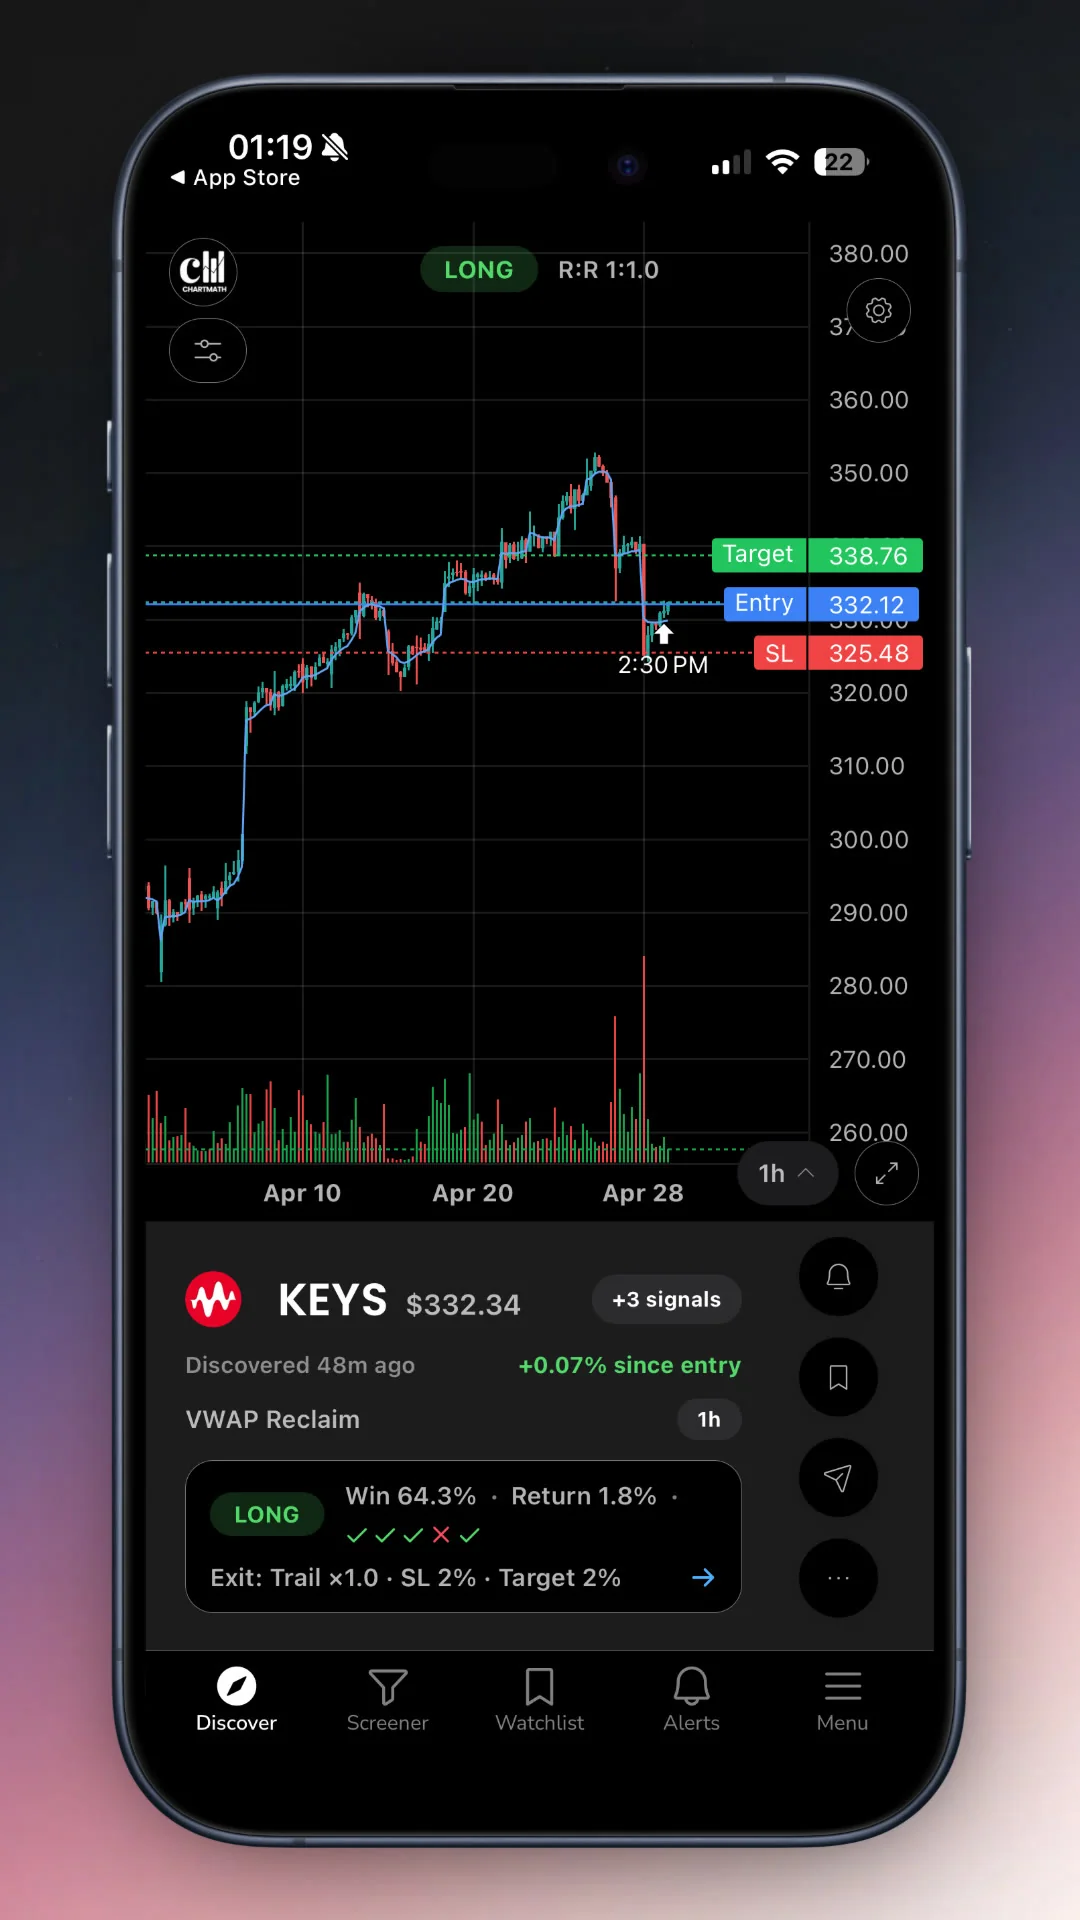
The Discover Feed
The primary surface in ChartMath is the Discover tab: a swipe-first feed of explainable entry cards. Each card represents a specific combination of symbol, screen, and strategy. The card tells you what the setup is, why it triggered right now, and what the historical Win Rate and Average Return look like for that screen. You're not staring at a list of tickers and wondering which ones to investigate. The investigation has already been done.
The feed is ranked by backtested reliability and recency, so the setups at the top are the ones with the strongest historical edge that fired most recently. That's a meaningful filter when you only have 15 minutes to review candidates.
200+ Curated Screens, No Setup Required
ChartMath's Screener tab gives you access to all 200+ curated technical screens. These cover a wide range of setups: breakouts, VWAP reclaims, momentum signals, volume spikes, candlestick patterns, and more, across 30+ technical indicators. None of them require configuration. You open a screen, and you see which stocks in the universe currently match it.
There's no screen builder, and that's intentional. Every screen in the app was proposed by internal AI agents and then backtested before it shipped. Only screens with a verified historical edge make it into the app. The result is a library of ready-to-use setups that have already passed a quality bar, rather than a blank canvas that requires you to build your own.
For traders who want to understand what's inside those screens, the post on 15 proven technical setups every day trader should know covers the underlying patterns in detail.
Alerts That Explain Themselves
When a stock in ChartMath's universe enters a screen you've favorited, you get a push alert and an email. The alert carries the ticker, the timeframe, the screen name, a plain-English explanation of why it fired, and a deep link back into the app. You don't need to open a chart to understand what happened. The alert tells you.
ChartMath also handles notification hygiene seriously: de-duplication, throttling, per-bar caps, and timezone-aware quiet hours. You won't get the same alert 12 times in a row, and you won't get woken up at 3 AM by a futures signal you don't care about. That matters for traders who've experienced alert fatigue from noisy screeners before.
Copilot, Not Autopilot
ChartMath surfaces setups and explains them. It does not place trades, connect to a broker, or make decisions for you. You evaluate the setup, verify it on your charting platform, and execute in your own brokerage. That's the copilot model: the app does the scanning and the explaining, you do the deciding and the trading.
This is worth stating clearly because it's a meaningful design choice. A tool that places trades automatically removes your judgment from the process. ChartMath keeps you in the loop at every step, which is the right model for a retail trader who wants to build systematic habits rather than outsource their decisions to an algorithm.
The Ideal Stack: TrendSpider + ChartMath Together
Here's a framing that might be counterintuitive: TrendSpider and ChartMath aren't necessarily competing for the same job. They solve different problems in the same workflow.
ChartMath handles discovery. It scans 500+ US equities, 100 crypto pairs, and 11 US futures across 200+ screens, surfaces the setups that match, and explains why they triggered. That's the front end of the workflow.
TrendSpider (or TradingView, or any charting platform you prefer) handles verification. Once ChartMath surfaces a candidate, you pull it up on your charting platform, draw your levels, check the multi-timeframe context, and decide whether the setup holds up under scrutiny. That's the middle of the workflow.
Your broker handles execution. You place the trade, set your stops, and manage the position. That's the back end.
The ChartMath brand mantra captures this cleanly: "See it. Trust it. Trade it." See it in the Discover feed. Trust it after verifying on your chart. Trade it in your broker. Each tool does one job well, and they stack together without overlap.
For traders who use TradingView as their charting layer, the post on integrating trading alerts with your charting platform covers how to connect the alert workflow to your existing setup.
Other TrendSpider Alternatives Worth Knowing
ChartMath isn't the only tool in this space. Here's a quick rundown of the other options traders typically consider when looking for a TrendSpider alternative focused on discovery.
Trade Ideas
Trade Ideas is a powerful real-time scanner with an AI assistant called Holly. It's genuinely capable, but it's also expensive, desktop-heavy, and built for professional day traders who sit at a monitor all day. If you're a swing trader with a day job, the cost-to-workflow fit is a real question. The post on switching from Trade Ideas to a cheaper scanner covers that tradeoff in detail.
Finviz
Finviz is a widely used static screener. It's free at the basic level, covers a large universe, and has a clean interface. The gaps: no push alerts, no plain-English explanations, no backtested win rates attached to signals, and no mobile-first experience. It's a solid research tool for traders who have time to sit at a desktop and manually review results. For traders who need the market to come to them, it falls short.
TradingView
TradingView is the most popular charting platform among retail traders, and for good reason. The charts are excellent, the community is large, and the screener is functional. But like TrendSpider, TradingView is a charting and analysis tool, not a discovery engine. Its screener requires you to build conditions, and its alerts require you to configure them per ticker. There's no proactive discovery layer that surfaces setups to you without prior setup.
Discord and Telegram Signal Groups
Signal groups are the informal alternative that many traders try before finding a systematic solution. The appeal is obvious: someone else does the work and posts the setups. The problem is equally obvious: there's no backtested win rate, no systematic criteria, and no way to verify whether the person posting has a real edge or is just promoting their own positions. ChartMath replaces that with algorithmically backtested setups that have a documented historical Win Rate and Average Return, free of human bias or promotion.
Quick Comparison: Discovery Capability by Tool
| Tool | Proactive Discovery | Backtested Metrics | Mobile Push Alerts | Plain-English Explanations | No Coding Required |
|---|---|---|---|---|---|
| ChartMath | Yes | Win Rate + Avg. Return | Yes (push + email) | Yes | Yes |
| TrendSpider | Limited | Strategy tester (manual) | Limited | No | Mostly |
| Trade Ideas | Yes | Partial (Holly AI) | Limited | Partial | Mostly |
| Finviz | No | No | No | No | Yes |
| TradingView | Limited | No (per signal) | Limited | No | Mostly |
| Signal Groups | Yes (manual) | No | Yes (Telegram/Discord) | Varies | Yes |
Frequently Asked Questions
Is ChartMath a replacement for TrendSpider?
Not exactly. ChartMath and TrendSpider solve different problems. TrendSpider is a chart analysis platform: it helps you analyze stocks you've already identified. ChartMath is a trade discovery app: it identifies which stocks are forming high-probability setups right now and surfaces them to you. Many traders use both, with ChartMath handling discovery and TrendSpider (or another charting platform) handling verification.
Does ChartMath require coding or Pine Script?
No. ChartMath requires no Pine Script and no coding of any kind. The 200+ screens are pre-built, curated, and ready to use. You pick the screens you want to follow, and the app handles the rest.
What markets does ChartMath cover?
ChartMath is US-first. The live universe covers 500+ US equities (NYSE and Nasdaq), 100 crypto pairs, and 11 US futures, across 7 timeframes from 1-minute to monthly. All session references align to Eastern Time.
How does ChartMath send alerts?
Alerts go out via push notification and email. There are two alert types: screen-enter alerts (which fire when any ticker in the universe enters a screen you've favorited) and a symbol-level alert builder for specific tickers you're watching. ChartMath does not send SMS alerts.
What does ChartMath cost?
ChartMath is currently in open beta, with full access to the screen library, backtests, and alerts while the platform is in its early stage. Paid plans will be introduced at a later date, and users who join during beta keep founding pricing when those plans become available.
Does ChartMath place trades automatically?
No. ChartMath is a copilot, not an autopilot. It surfaces setups and explains them. You decide whether to act, and you execute in your own brokerage. ChartMath has no broker connection and does not place orders.
If TrendSpider is part of your current stack, it's probably doing its job well. The question is whether you have a system for the step that comes before it: finding which stocks deserve a closer look in the first place. For swing traders with a day job, that discovery layer is the piece that most often goes missing, and it's the piece that costs the most entries.
ChartMath is built to fill exactly that gap. It scans 500+ US equities, 100 crypto pairs, and 11 US futures across 200+ curated screens, fires an explainable push alert the moment a setup forms, and gives you the Win Rate and Average Return to evaluate it before you risk a dollar. No coding, no manual scanning, no signal groups with unknown track records.
ChartMath is in open beta, with the full screen library open while it's early. Use the web-based screener to explore available screens, or download the iOS or Android app for the full Discover feed and push alerts. The market is moving whether you're watching or not, and ChartMath makes sure you don't miss the setups that matter.

Ankush Jindal
LinkedInSee these setups live in ChartMath
200+ curated screens with backtest data. 14-day free trial.