9/20 EMA Crossover: Test It Before You Trade It
A 9/20 EMA crossover is not a buy signal by itself. It is a snapshot of two averages swapping positions, and whether that swap makes money depends entirely on the timeframe, the market condition, and the confirmation rules you attach to it. The only way to know if the 9 ema cross 20 ema setup is worth trading is to run it as a fixed rule against real price history and read the resulting win rate.
Key Takeaways
- Hit rate depends on timeframe: the same 9/20 EMA cross behaves very differently on a 5-minute chart than on a 1-hour chart, mostly because chop density changes with timeframe.
- Chop is the main enemy: in sideways markets, the 9 EMA and 20 EMA cross back and forth constantly, generating signals that resolve to noise more often than trend.
- Confirmation filters matter more than the cross itself: volume, a longer-term trend filter, and a volatility floor (like ATR) each change the outcome distribution, sometimes sharply.
- Three trades tell you nothing: a rule needs dozens of trades across different market conditions before its win rate means anything.
- A fixed rule is recomputable: unlike a chart screenshot shared on social media, a deterministic screen with a stated entry, stop, and exit can be re-tested by anyone, on any ticker, at any time.
9/20 EMA Crossover At a Glance
| Element | What It Means |
|---|---|
| The signal | 9-period EMA crosses above (or below) the 20-period EMA |
| Cross-up meaning | Short-term price momentum is outrunning the intermediate trend |
| Cross-down meaning | Short-term momentum is fading below the intermediate trend |
| Worst timeframe for raw signal | 1-minute and 5-minute, due to high chop frequency |
| Better fit for a day-job trader | 1-hour and daily, fewer but more decisive crosses |
| Key confirmation filters | Volume above average, price above a longer trend MA, ATR floor to skip low-volatility chop |
| What to check before trading it | Win rate, average return, profit factor, and sample size on the exact timeframe you plan to trade |
| Minimum sample size to trust a win rate | Generally 30+ trades across more than one market regime |
What the 9/20 EMA Crossover Actually Means
Strip away the marketing language and the mechanics are simple. The 9-period exponential moving average reacts fast to recent price. The 20-period EMA reacts slower and represents the intermediate trend. When the 9 EMA crosses above the 20 EMA, short-term demand is outrunning the intermediate trend, at least for that moment. That is the entire definition of a cross-up. A cross-down is the mirror image: short-term momentum has faded below where the intermediate trend sits.
This is exactly why the 9/20 ema strategy shows up in nearly every beginner trading course. It is visually obvious, easy to code, and easy to explain in one sentence. None of that makes it profitable. A pattern being easy to see is not the same thing as a pattern being reliable, and the two get confused constantly in retail trading content.
EMAs weight recent price more heavily than a simple moving average, which is why they cross sooner than SMA pairs. That speed is the whole appeal, and also the whole problem: a fast-reacting average crosses back and forth far more often when a stock is going nowhere, not just when it's trending.
Why Almost Nobody Knows Its Real Hit Rate
Search any trading forum and you'll find the 9/20 EMA cross recommended dozens of times a day. Ask the person recommending it what percentage of those crosses actually worked, over how many trades, on which stocks, and you'll usually get silence or a chart with three green arrows on it. Three winning trades on a chart is not a sample. It is a highlight reel, and highlight reels are built by omission.
The gap between "this looks good on a chart" and "this rule won a documented percentage of the time" is the entire difference between trading on a hunch and trading systematically. If you've read how to use backtested win rate to pick trades, you already know this distinction. Applying it to the 9/20 cross specifically just means treating the crossover as a rule to be measured, not a story to be believed.
1. Define the Rule Before You Backtest It
Before you run any test, write the rule down exactly. Vague rules produce vague results. A usable definition looks like this:
- Entry: 9 EMA closes above the 20 EMA on the chosen timeframe (cross-up), or below it (cross-down).
- Stop: a fixed percentage or ATR-based distance below the entry bar's low.
- Target: a fixed percentage or a trailing exit once price extends.
- Exit type: stop loss, take profit, end-of-day, or an N-bar time exit. Pick one and hold it constant across every trade in the test.
- Timeframe: 5-minute, 15-minute, or 1-hour changes the entire behavior of the rule, so lock this in before you look at any results.
Without this written down, you can't run a fair test, and you definitely can't compare results across tickers or time periods.
2. Run the Backtest and Read the Right Numbers
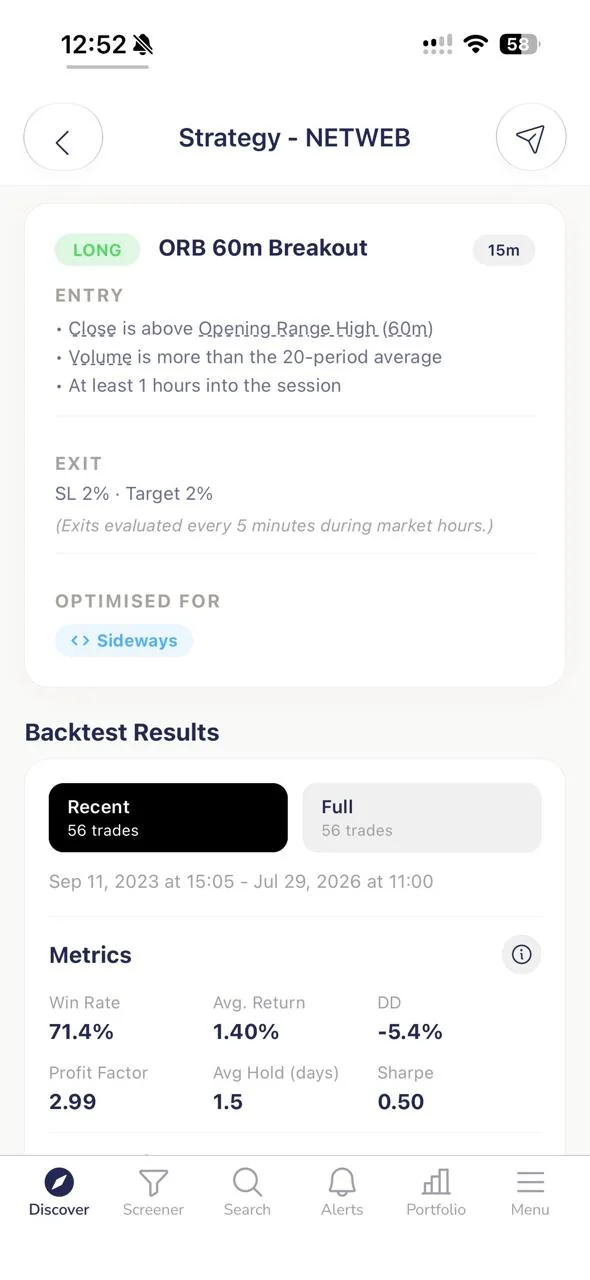
Once the rule is fixed, the backtest needs to answer four questions: how often did it hit target versus stop (win rate), what was the average return per trade, how big were the winners relative to the losers (profit factor), and how many trades made up that sample. Skip any one of these and you're missing part of the picture. A high win rate with a tiny sample size and a short date range means very little. A modest win rate with a strong profit factor across hundreds of trades can still be a workable edge.
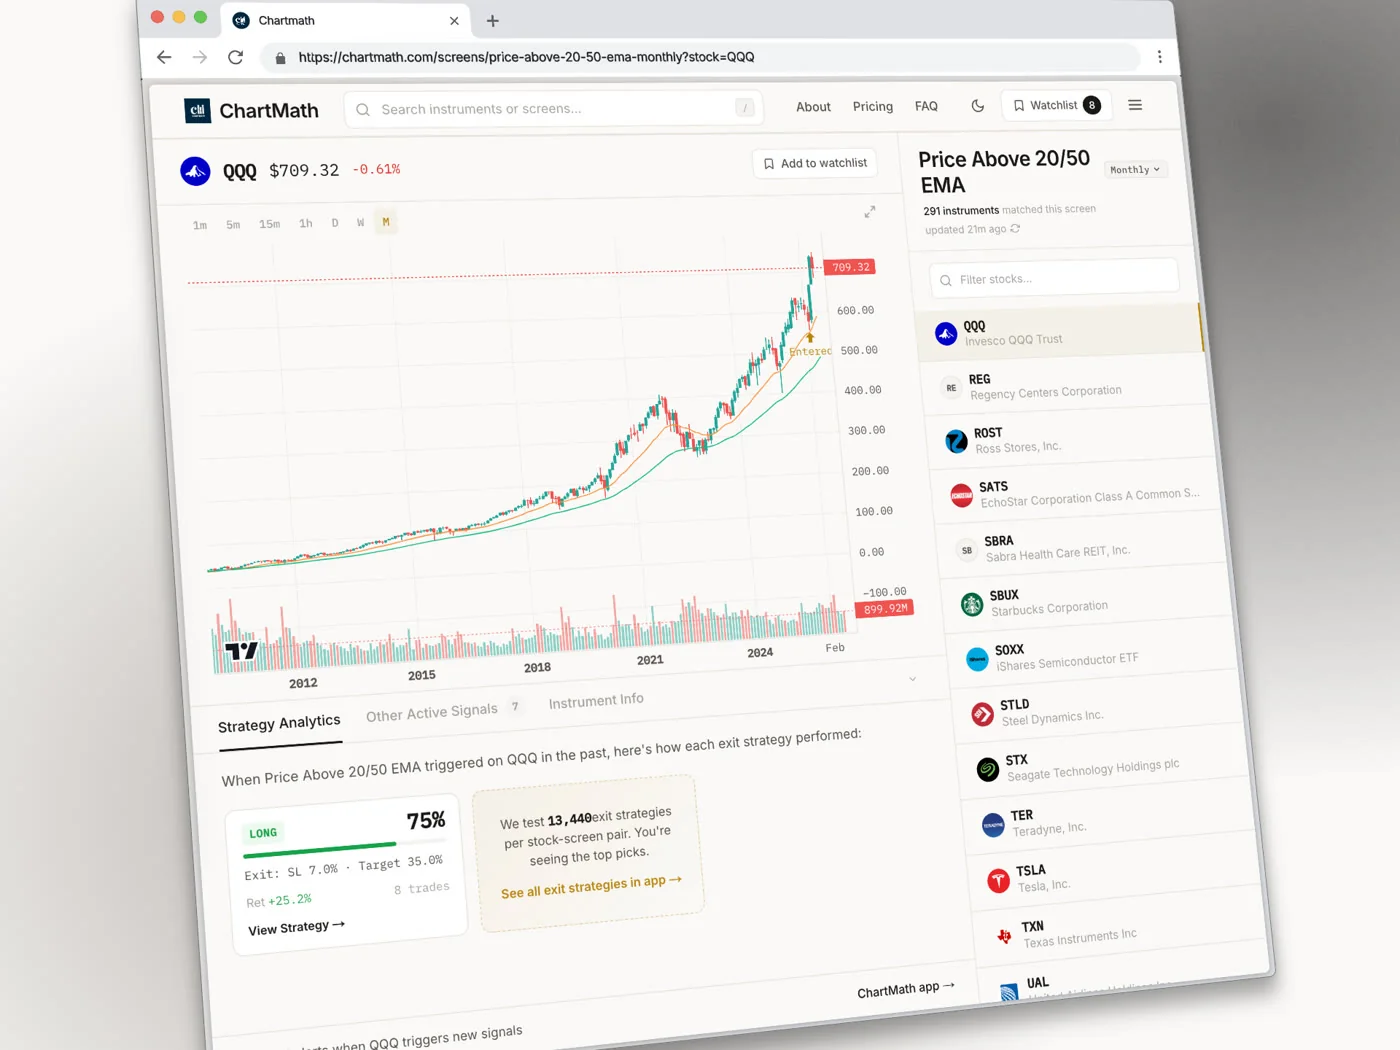
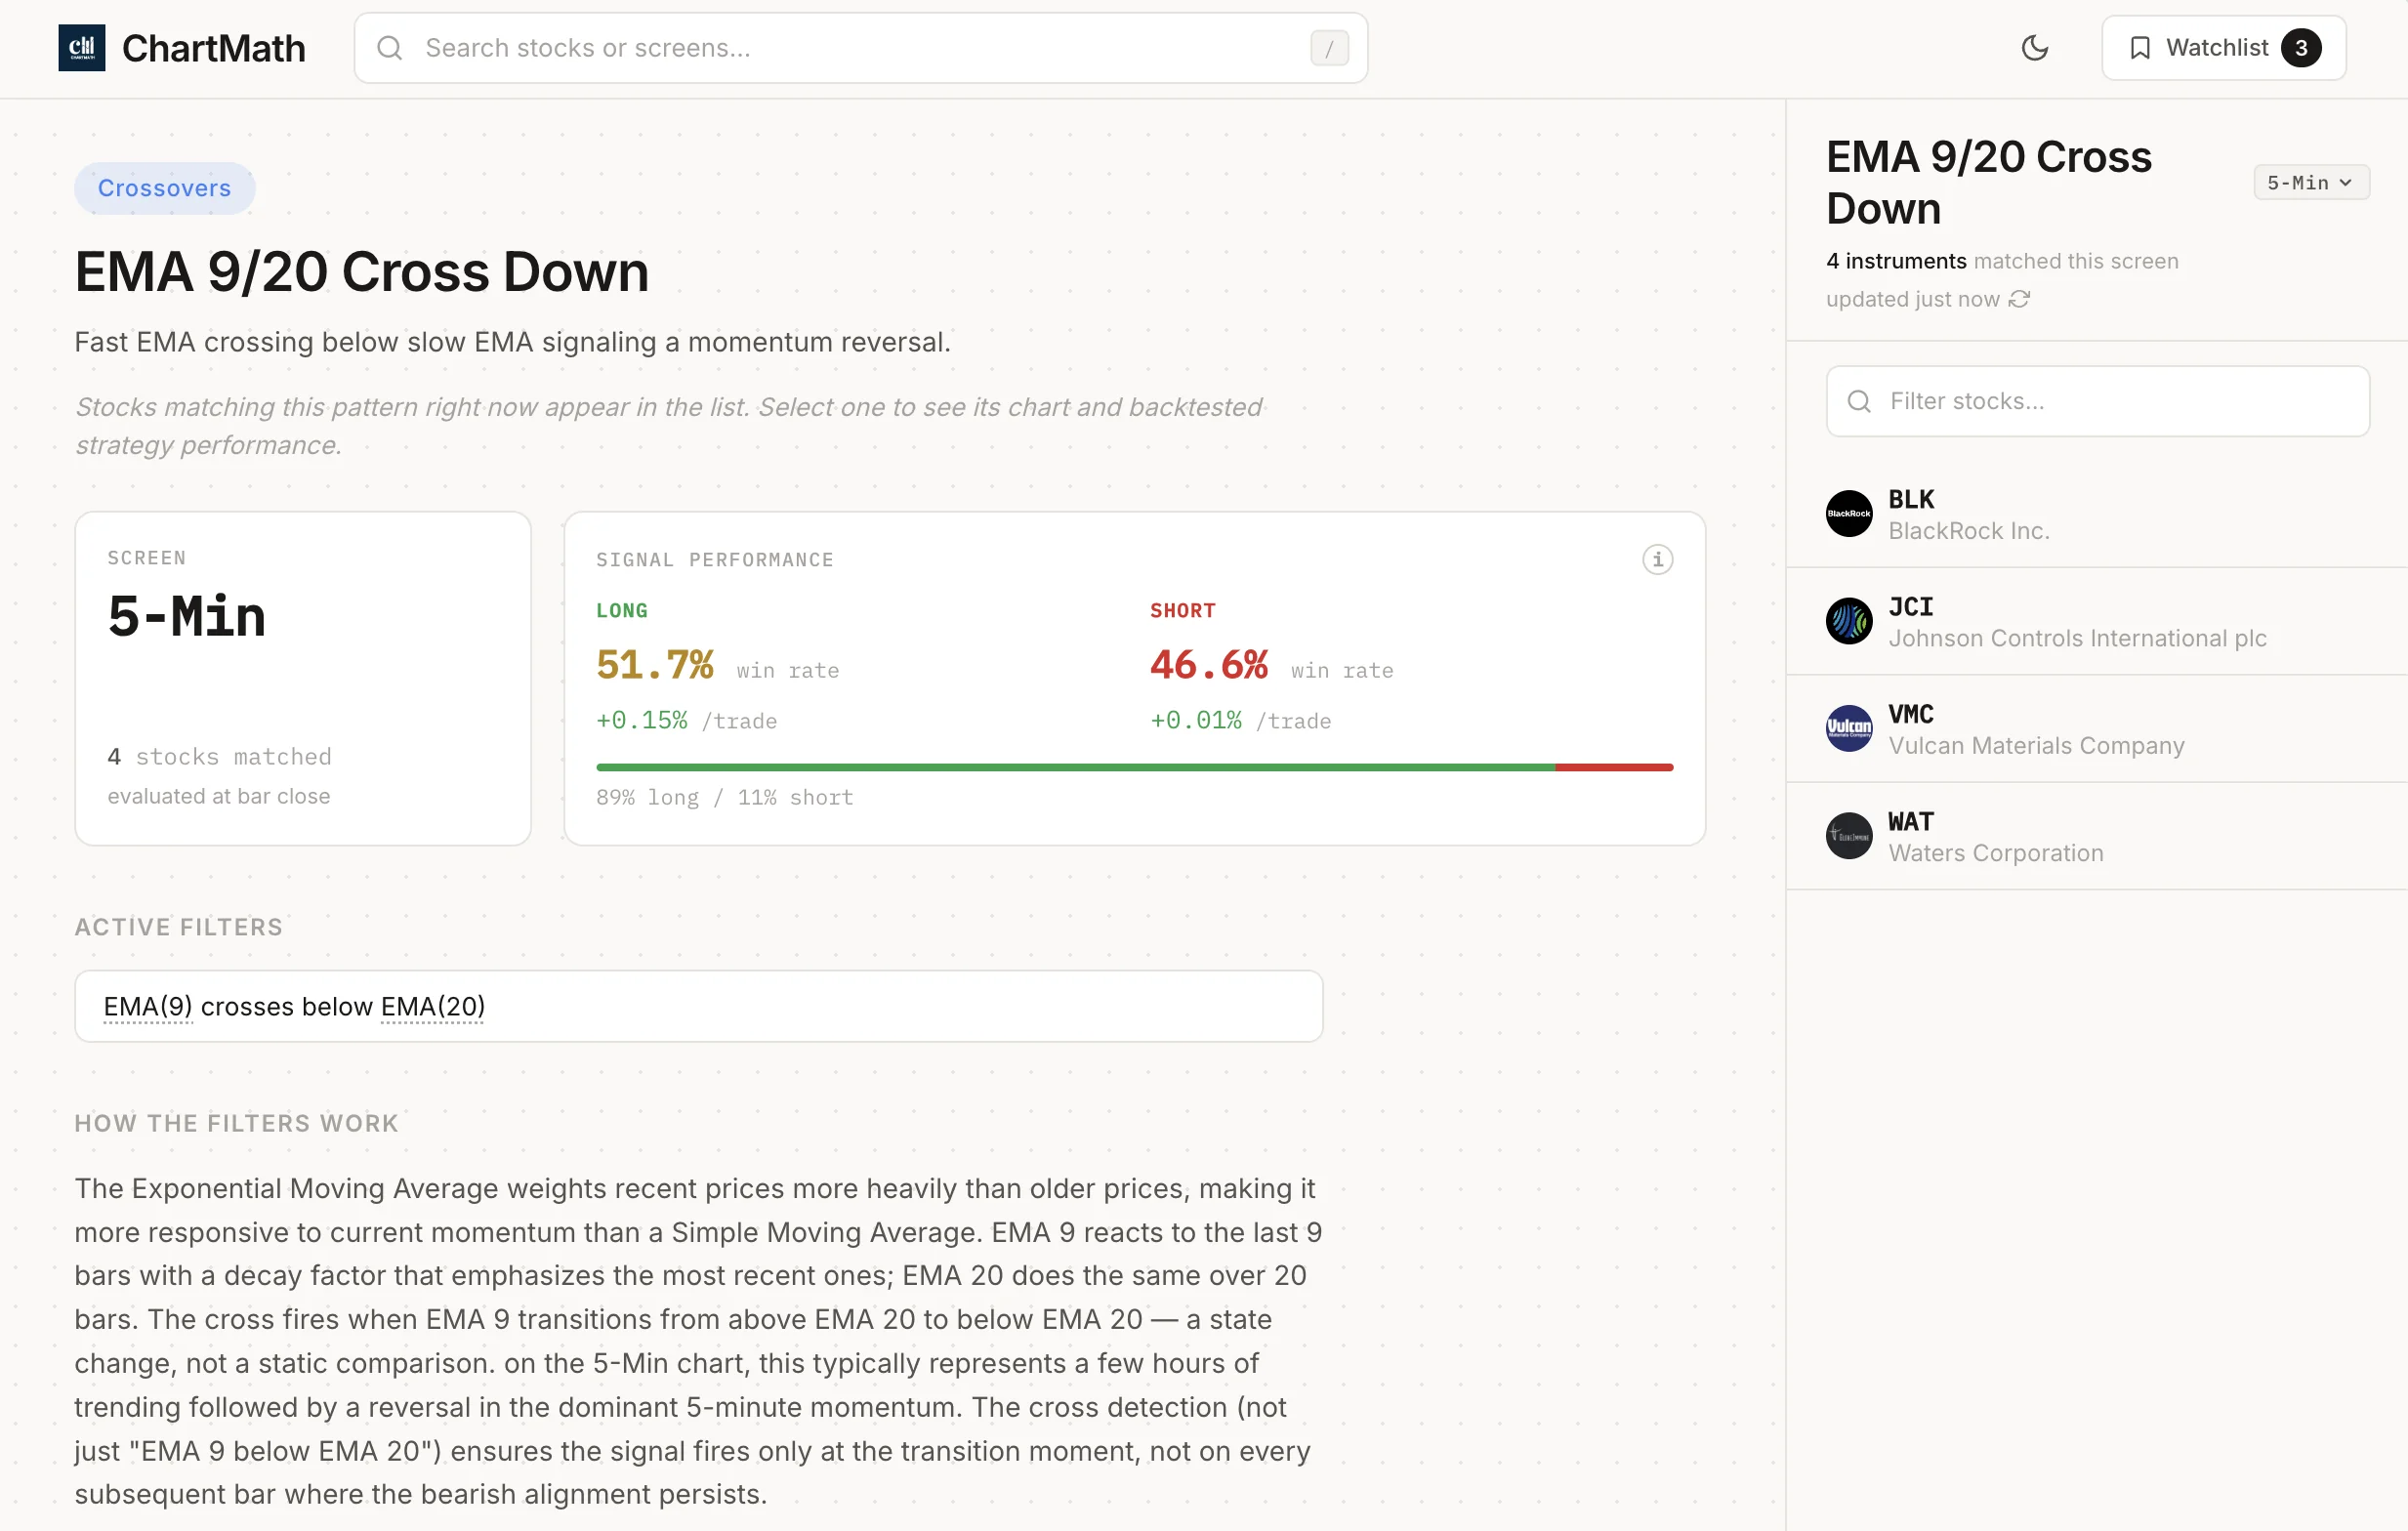
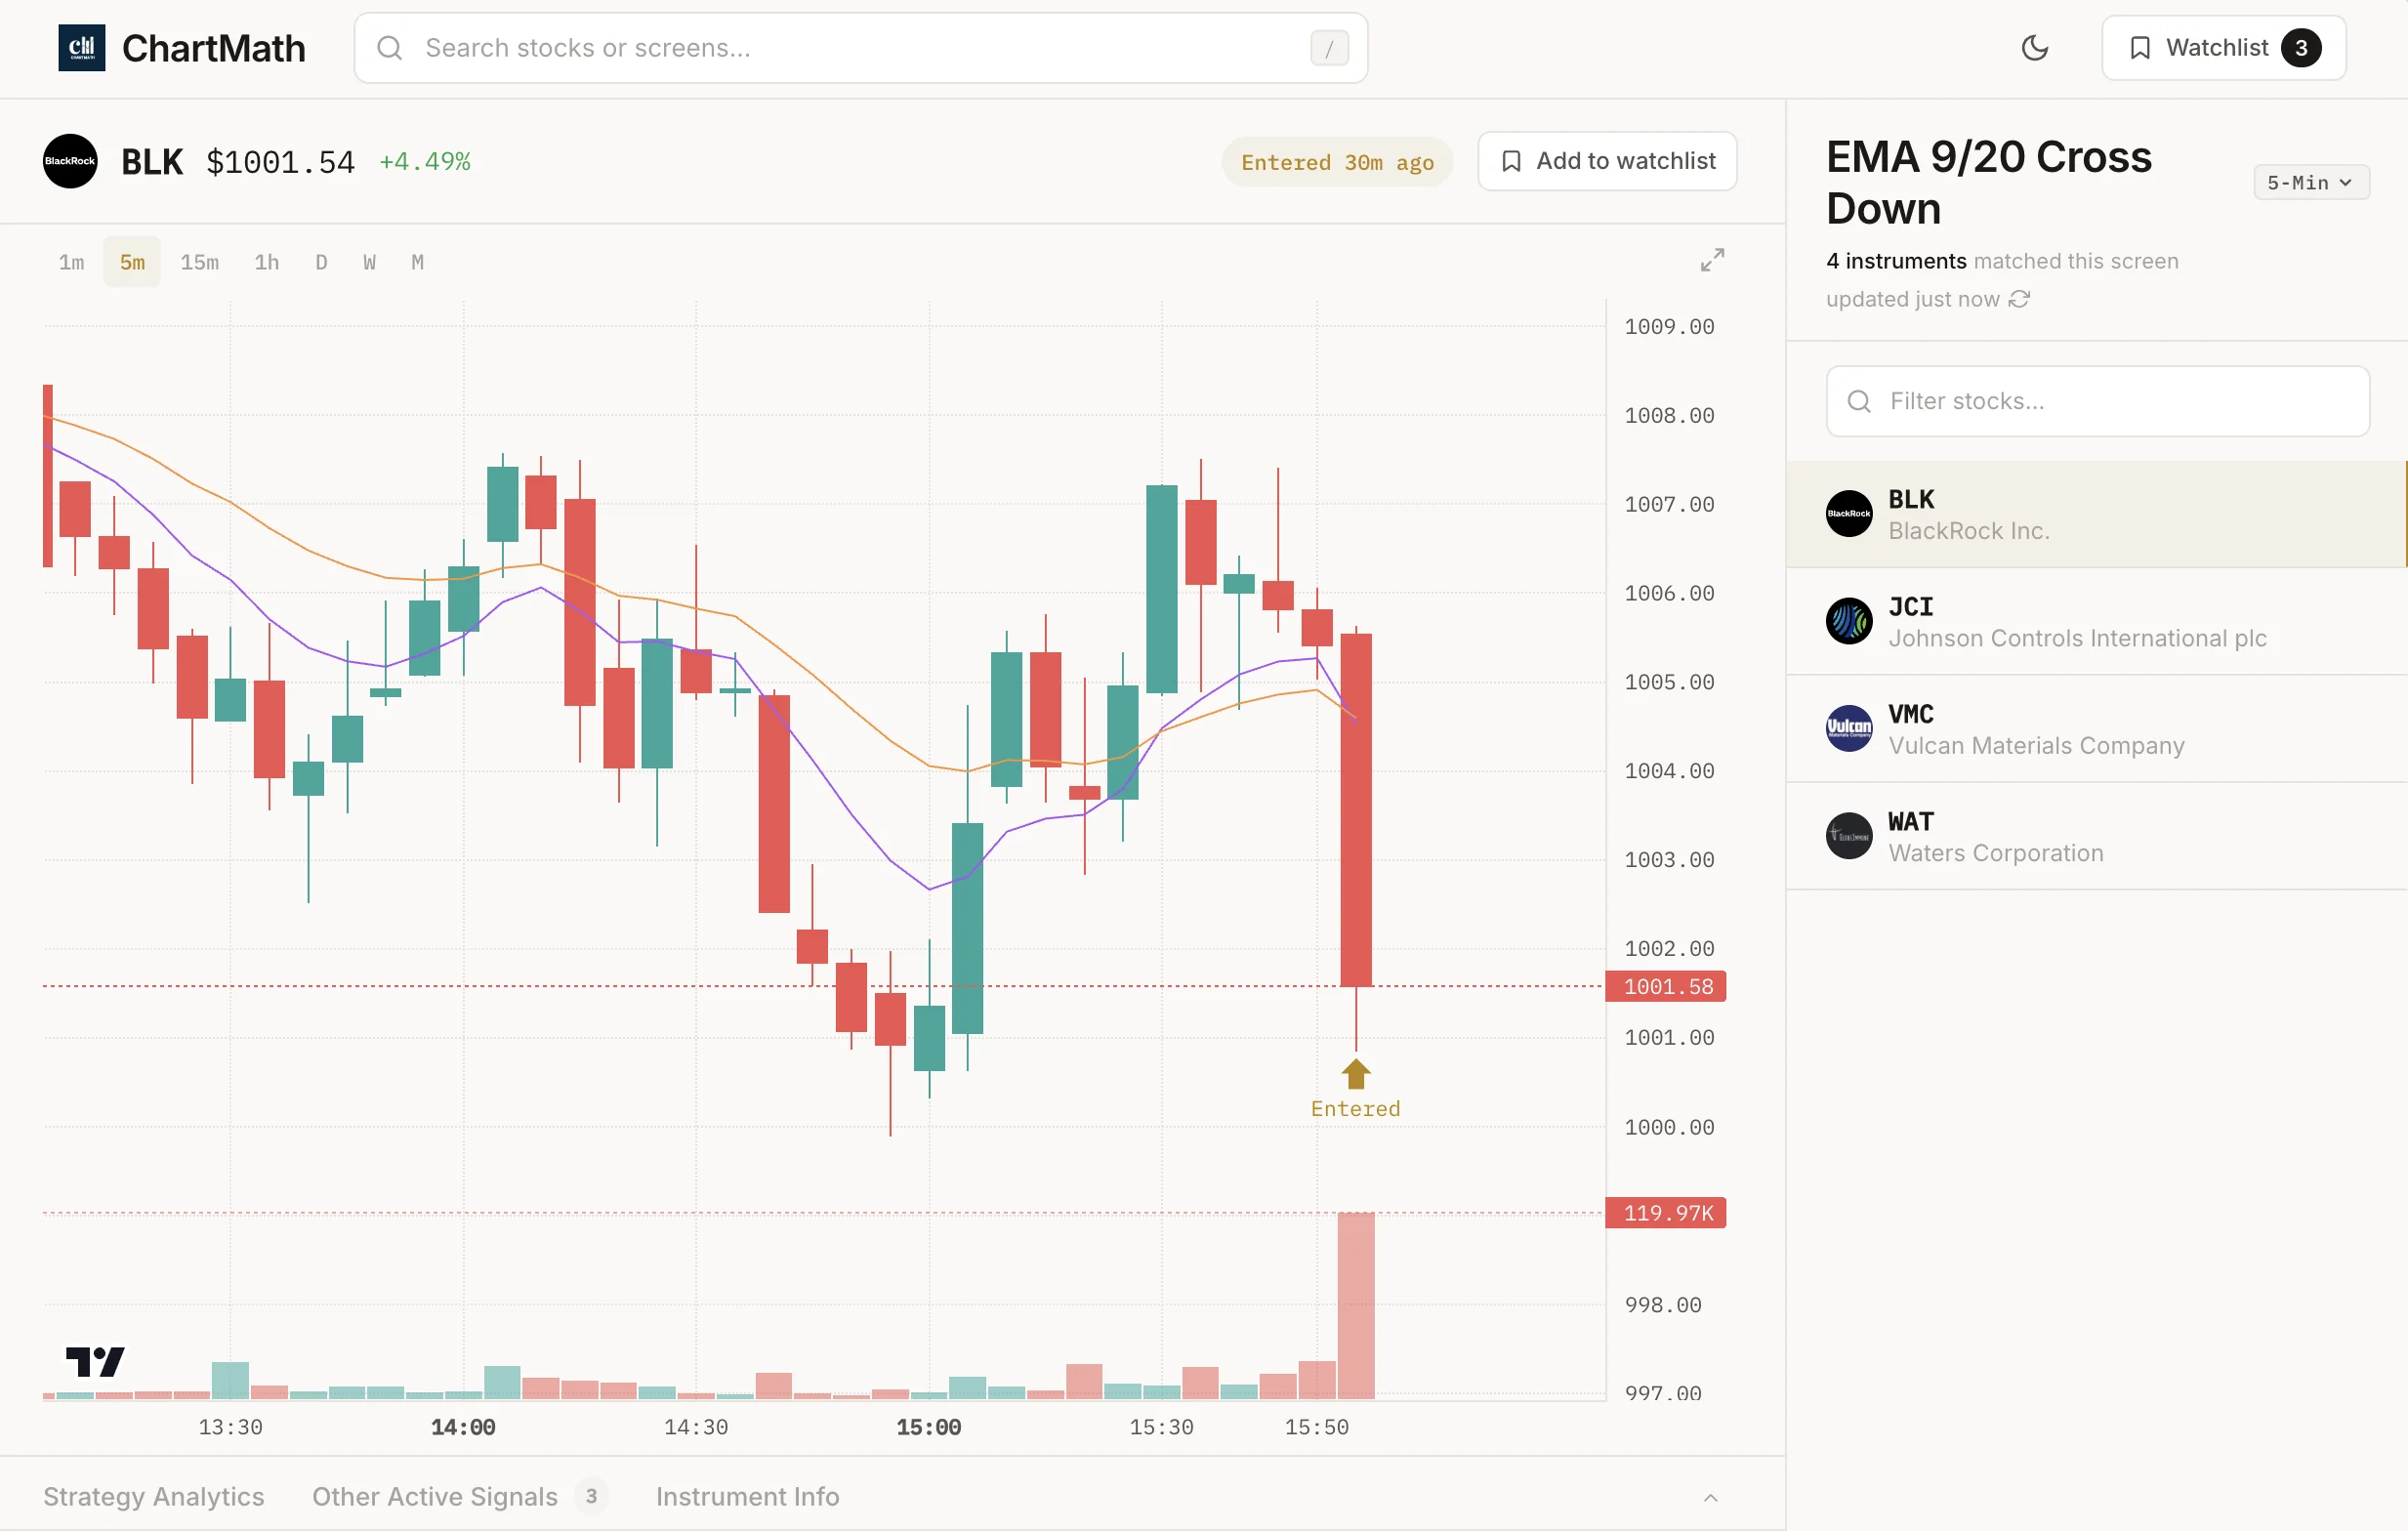
This is the exact reason ChartMath runs the 9/20 EMA cross as a set of deterministic screens rather than a single one-size-fits-all signal. Because the entry, universe, and timeframe are all fixed in advance, the win rate and average return are recomputable by anyone, on demand, instead of taken on faith from a screenshot. You can check the live numbers on the EMA 9/20 Cross Up 5m screen, the EMA 9/20 Cross Up 15m screen, or the EMA 9/20 Cross Up 1h screen, each of which reports its own historical hit rate, average return, and sample size against a fixed 500+ US-equity universe.
3. Timeframe-by-Timeframe: How the Same Cross Behaves Differently
The 9/20 EMA cross is not one signal. It is at least four different signals depending on which chart you're looking at, because the frequency of chop scales directly with how granular the timeframe is.
On a 5-minute chart, the cross fires constantly. Intraday price action whipsaws around the averages dozens of times a session, and most of those crosses resolve to nothing before a real move develops. This is why a 5-minute cross-up screen needs tighter confirmation to be usable at all, and why the 5m screen exists as its own recomputable record rather than a guess.
On a 15-minute chart, the signal count drops and the quality generally improves, since a cross needs more sustained buying or selling pressure to actually happen. It's a middle ground: still frequent enough to catch multiple setups a week, but with fewer false starts than the 5-minute version.
On a 1-hour chart, crosses become rarer and tend to represent more decisive shifts in short-term momentum. For a trader who holds positions for days and checks charts once or twice outside work hours, the EMA 9/20 Cross Up 1h screen fits the actual schedule better than anything faster.
Cross-down deserves its own treatment, not just as "the opposite of cross-up." A cross-down after a strong uptrend behaves differently than a cross-down inside a range that's already chopping sideways. The EMA 9/20 Cross Down 1h screen carries its own separate backtested record for exactly this reason: don't assume the downside signal mirrors the upside one just because the math looks symmetrical.
4. Confirmation Filters That Separate Noise From Setups
The raw crossover, tested alone, usually underperforms a version of itself with even one sensible filter attached. Three filters do most of the heavy lifting.
Volume confirmation checks that the cross happened on above-average volume, not on a quiet, low-participation bar. A cross on thin volume is often just noise finding its way through indifferent price action.
A trend filter requires price to already be above a longer moving average, such as the 50-period, before taking a cross-up signal. This filters out crosses that happen inside a larger downtrend, where the short-term bump rarely survives contact with the bigger picture.
An ATR-based volatility floor skips crosses that happen when the stock isn't moving enough to make the trade worth the risk. In dead-quiet conditions, the 9 and 20 EMA sit close together and cross on almost nothing, producing signals with tiny expected payoff even when they technically "work."
One warning here: stacking too many filters at once collapses your sample size. If you require volume confirmation, a trend filter, and an ATR floor simultaneously, you might end up with five trades a year on a given ticker, which isn't enough to trust the resulting win rate no matter how good it looks. Add filters one at a time and watch what each one actually does to both the win rate and the number of trades left in the sample.
5. Judge It By Sample Size, Not Your Last Three Trades
Recency bias is the trap that swallows most retail traders who try the 9/20 EMA cross for a week and draw a permanent conclusion from it. Three winning trades feels like proof. Three losing trades feels like proof the strategy is broken. Neither is statistically meaningful. A rule needs enough trades, spread across different market conditions, bull runs, sideways stretches, and pullbacks, before its win rate reflects anything other than luck.
As a rough floor, treat anything under 30 trades as too small to draw conclusions from, and prefer a sample that spans at least a year or more of price history so it isn't accidentally measuring one specific regime. This is the same discipline covered in what a backtest win rate actually measures: the tool matters less than the habit of demanding a real sample before you trust a number.
This is also the practical difference between a deterministic screen and a chart screenshot passed around on social media or a Discord channel. A screenshot shows you one outcome, cherry-picked by definition, because nobody posts their losers. A fixed rule with a stated entry, stop, and exit can be re-run against fresh data at any time by anyone, which is the entire point of treating a signal as a rule instead of a story. For more on why that distinction matters when you're choosing between a scanner and a chat group, see how to add screener alerts to your trading workflow.
The 9/20 EMA Rules Recap
- Write the exact entry, stop, target, and exit type before you test anything.
- Pick one timeframe and test it in isolation; don't average results across 5m, 15m, and 1h.
- Read win rate, average return, profit factor, and sample size together, never just one number alone.
- Add confirmation filters one at a time and check what each does to both win rate and sample size.
- Treat any sample under roughly 30 trades as inconclusive, and prefer at least a year of price history.
- Test cross-down as its own signal, not as the assumed mirror of cross-up.
- Paper trade the rule before committing real capital, so the mechanics feel familiar before the money does.
Run It On Your Own Ticker
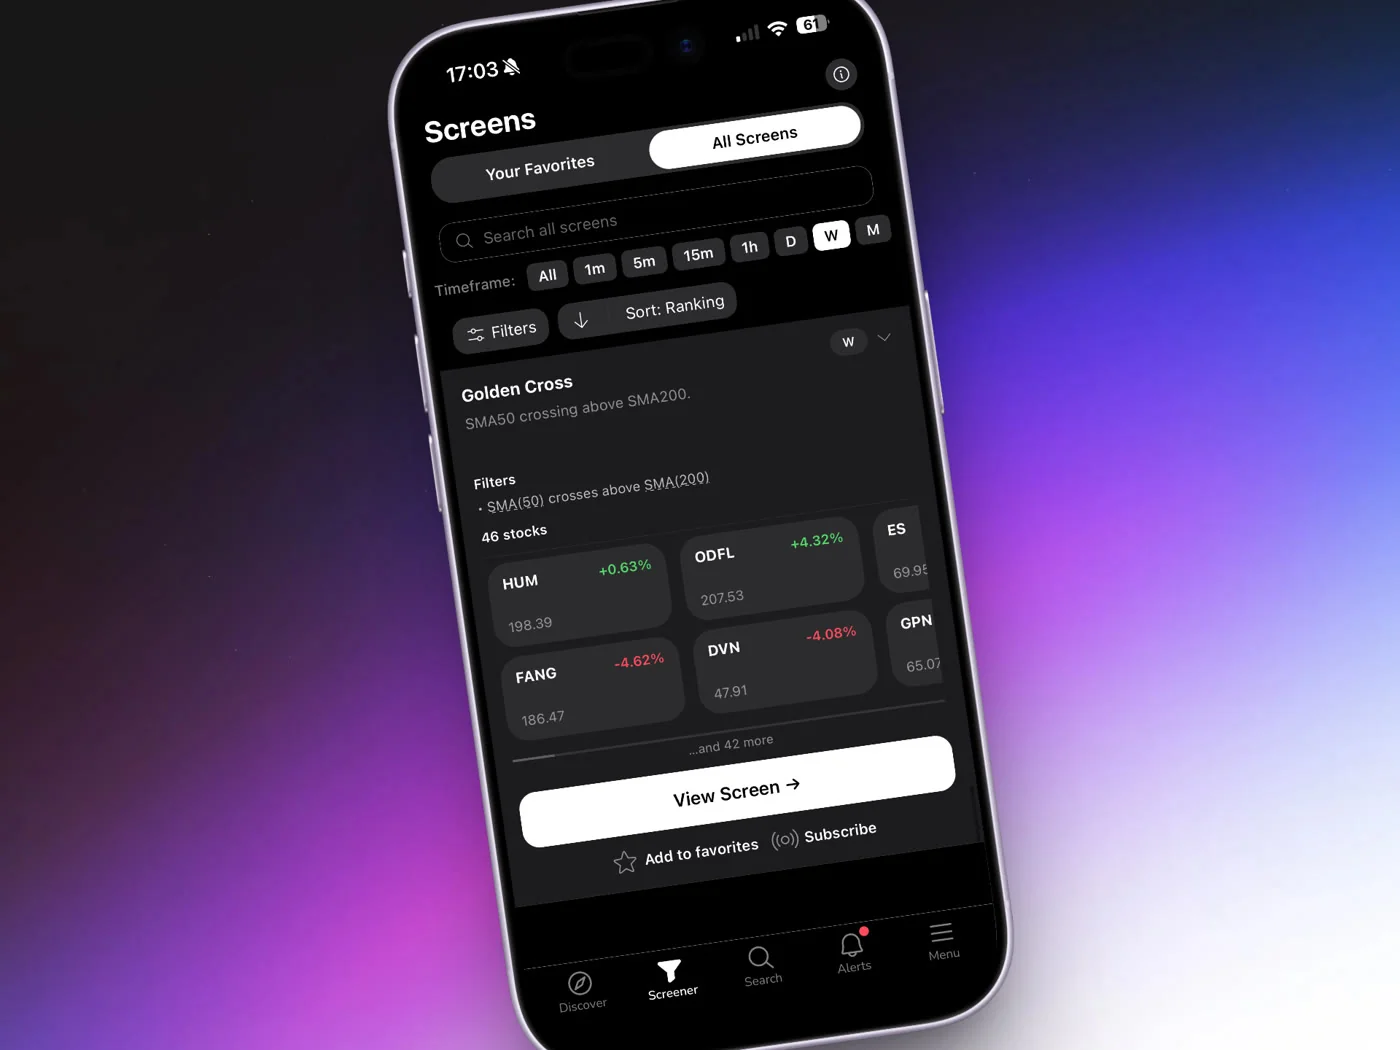
The fastest way to stop guessing about the 9 20 ema crossover is to check its documented history on the exact timeframe you actually plan to trade, then watch it play out on a real ticker before risking money. ChartMath's screens catalog lets you browse the EMA 9/20 Cross Up and Cross Down screens across 5m, 15m, and 1h, each carrying its own recomputable win rate and average return against a fixed 500+ US-equity universe.
When you're ready to test the cross on your own watchlist and rehearse it with a simulated order before it's real money, download the ChartMath app and paper trade the setup with stop, target, and size pre-filled. You'll also want to read swing trading with a full-time job for how to fit this kind of checking into a routine that doesn't require watching charts all day.
The 9/20 EMA cross isn't a bad signal. It's an untested one for most people who trade it. Fix that, and you'll know whether you're trading an edge or trading a habit.

See these setups live in ChartMath
200+ curated screens with backtest data. Free. No credit card required.