Does Your Screener Show the Rules Behind a Signal?
A ticker symbol lands in your inbox at 10:43 AM. "AAPL — buy signal." That's it. No rule. No context. No history. You have no idea whether this alert fired because of a 200-day moving average cross, a volume spike, someone's gut feeling, or a Discord moderator who just bought the stock. You're supposed to risk real money on that?
This is the daily reality for traders who rely on screeners and signal groups that treat transparency as optional. The signal arrives. The explanation doesn't. And without the explanation, you can't evaluate the setup — you can only follow it blindly or ignore it entirely.
A stock screener with plain English signal explanations solves this at the source. Instead of a ticker and a directive, you get the exact rule that triggered the alert, a description of what the setup is trying to catch, and a backtested track record so you can judge the edge before you act. This post walks through what that looks like, why most tools don't deliver it, and how to use it when they do.
1. The Alert That Tells You Nothing
Signal groups and basic screeners share a common design flaw: they optimize for delivery speed and ignore explanation entirely. The alert fires fast. The reasoning never arrives.
Think about what you actually need to make a decision. You need to know what triggered the alert (the specific rule or condition), why that pattern matters (what market behavior it's trying to capture), and whether it has any historical edge (how often it's worked and what the average outcome looked like). Without all three, you're not evaluating a setup. You're just reacting to a notification.
The problem compounds when you're a swing trader with a day job. You can't sit at a terminal and research every alert the moment it fires. By the time you have five minutes to look at a signal, you need the context already attached to it. If the alert doesn't carry the rule and the track record, you're starting from scratch every time, and that's a workflow that breaks down fast.
Alert fatigue is the predictable result. When signals arrive without explanation, traders either act on all of them (dangerous) or start ignoring them (pointless). The fix isn't fewer alerts. It's better information attached to each one. For more on managing signal noise, see how to avoid alert fatigue from stock screeners.
2. What "Plain English Signal Explanations" Actually Means
The phrase gets used loosely, so it's worth being precise about what it should mean in practice.
A plain English signal explanation is not a marketing label like "momentum breakout" or "bullish setup." Those are category names, not rules. A real explanation tells you the exact conditions that had to be true for this alert to fire.
Compare these two descriptions of the same setup:
- Vague: "RSI bounce signal on KEYS"
- Plain English rule: "RSI(14) crosses above 30 on the 15-minute chart, with price above the 20-period EMA"
The second version tells you something you can verify. You can pull up the chart and confirm whether the condition is actually met. You can decide whether you agree with the logic. You can look at historical instances and see how the setup has performed. The first version gives you none of that.
One important distinction: a plain English rule definition is not the same as a live, per-trade AI narrative. A rule definition describes the screen's filter logic, the same conditions apply to every stock that enters that screen. It's not a real-time explanation of why this specific ticker is interesting right now beyond the fact that it matched the rule. Both are useful, but they're different things, and conflating them leads to inflated expectations.
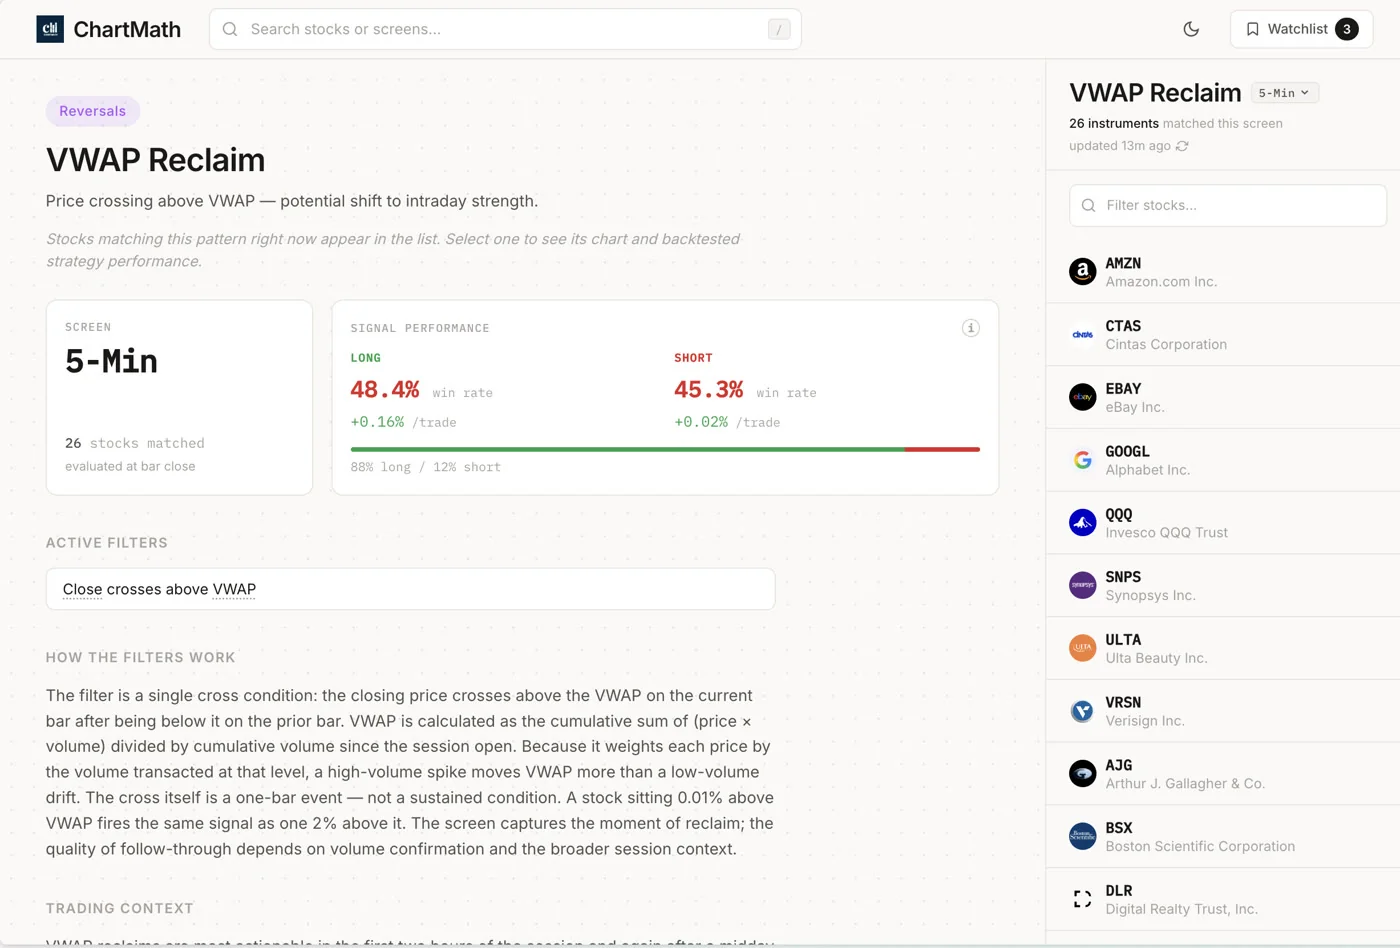
What you want from a screener is the rule definition clearly stated, a short description of what the setup is designed to catch, and the backtested statistics that tell you whether the rule has historically produced an edge. That combination is what makes a signal evaluable rather than just actionable.
3. Three Things Every Signal Should Show You
Before you act on any screener alert, you should be able to answer three questions from the alert itself. If the tool can't answer all three, you're missing critical information.
The Rule Logic in Plain Language
What exact conditions triggered this alert? Not a category label, the actual filter logic. "Price closes above the upper Bollinger Band on the daily chart" is a rule. "Breakout signal" is not. The rule tells you what to verify on the chart and whether the setup logic makes sense to you.
A Description of What the Setup Is Trying to Catch
Every technical setup is built around a market behavior hypothesis. A VWAP reclaim setup is trying to catch stocks where institutional buyers are stepping in after a morning dip. An RSI oversold bounce is trying to catch mean reversion after a short-term selloff. Understanding the hypothesis helps you decide whether the current market environment is one where that behavior is likely to play out. For a deeper look at one of these setups, see how to use VWAP in trading.
The Backtested Track Record
This is the piece most tools skip entirely. You want to see:
- Win Rate: What percentage of historical instances resulted in a profitable outcome
- Average Return: The average gain or loss per trade across all historical instances
- Expected Value (EV): The probability-weighted average outcome, which combines win rate and average return into a single number
- Sample Size: How many historical instances the statistics are based on, a 70% win rate on 12 trades means something very different from 70% on 300 trades
These four numbers let you compare screens against each other and size your conviction appropriately. They don't predict the future, but they give you a historical base rate to work from. That's far better than acting on a signal with no data at all.
4. Why Most Screeners Fall Short
The gap between what traders need and what most tools provide is surprisingly wide. Here's where the main options break down.
TradingView
TradingView is a genuinely excellent charting platform. The screener is functional and the Pine Script environment is powerful for traders who want to build custom strategies. But the screener doesn't explain why a signal triggered in plain English, and there's no built-in per-signal backtest attached to each screen result. You get the output, a list of tickers matching your filters, without the rule description or the historical track record. You also need Pine Script to build anything custom, which is a real barrier for traders who aren't coders. For more on using TradingView alongside a discovery tool, see how to use a stock scanner alongside TradingView.
Finviz
Finviz is a solid static screener for end-of-day research. It has a wide range of filters and a clean interface. What it doesn't have: push alerts, plain-English rule explanations, or per-signal backtest data. You can filter for stocks meeting certain criteria, but the screener won't tell you what the setup means, whether it has historical edge, or notify you when a new match appears during the trading day.
Discord and Telegram Signal Groups
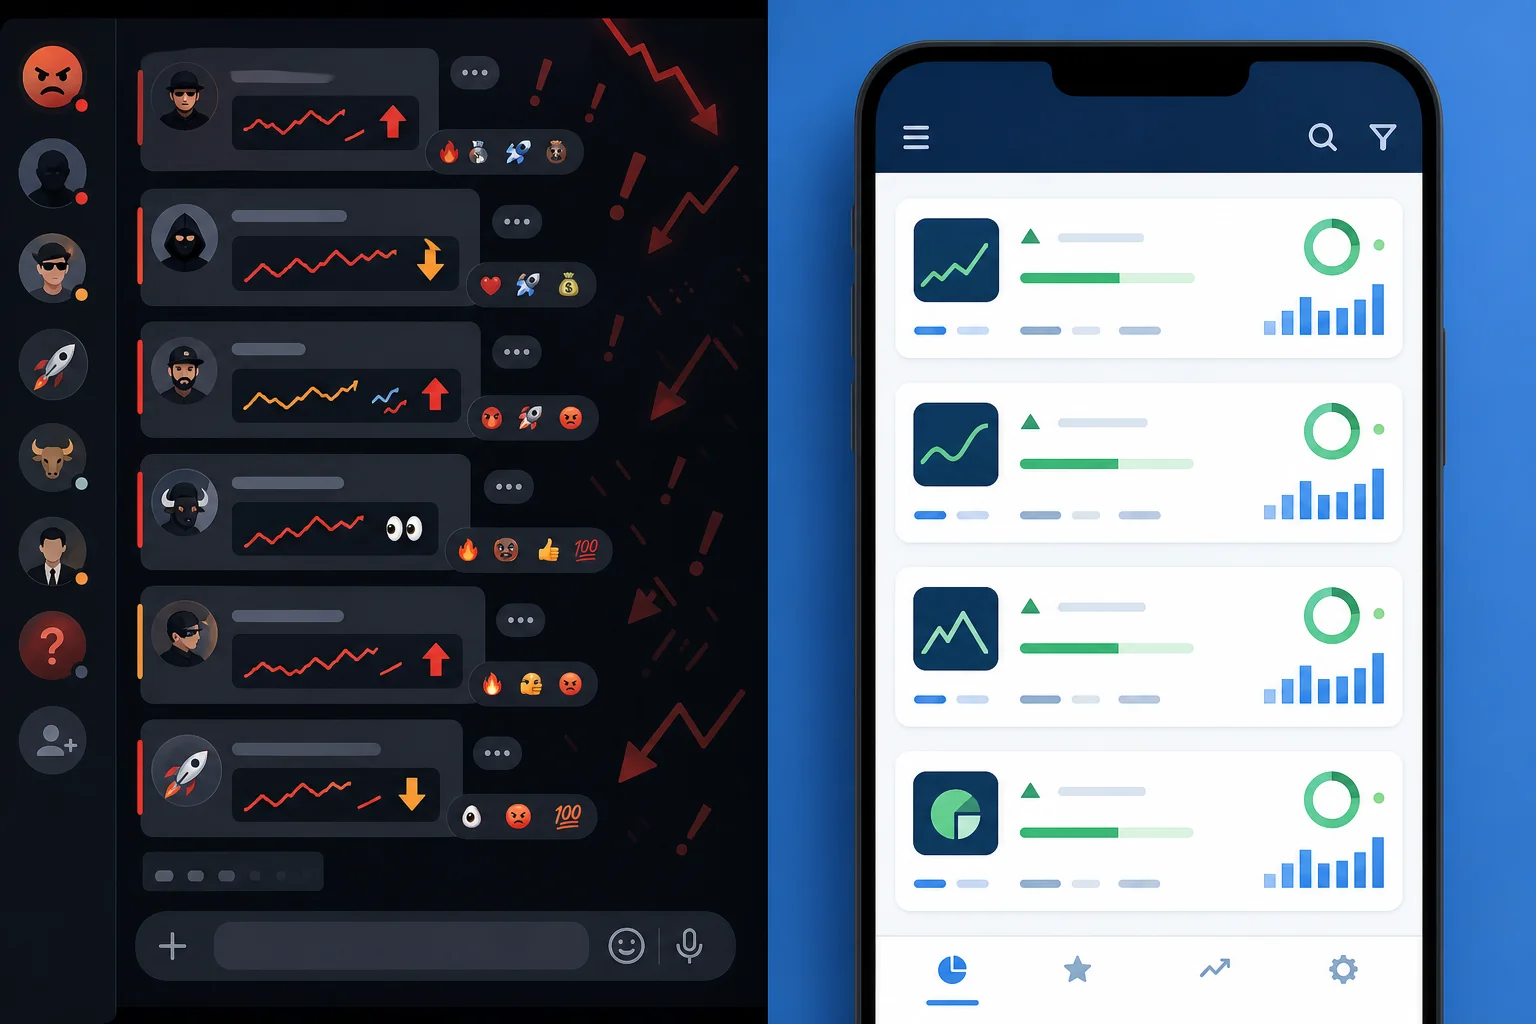
Signal groups have a transparency problem that's structural, not incidental. A human moderator posts a call. You have no way to verify the rule that triggered it, no documented win rate, and no way to distinguish a well-reasoned setup from a position the moderator already holds. Even well-intentioned signal groups can't provide the systematic, backtested track record that makes a signal evaluable. The edge is undocumented by design.
The common thread across all three: you get the output without the reasoning. A stock screener with plain English signal explanations inverts that, the reasoning is the product.
5. How ChartMath Shows the Rules Behind Every Screen
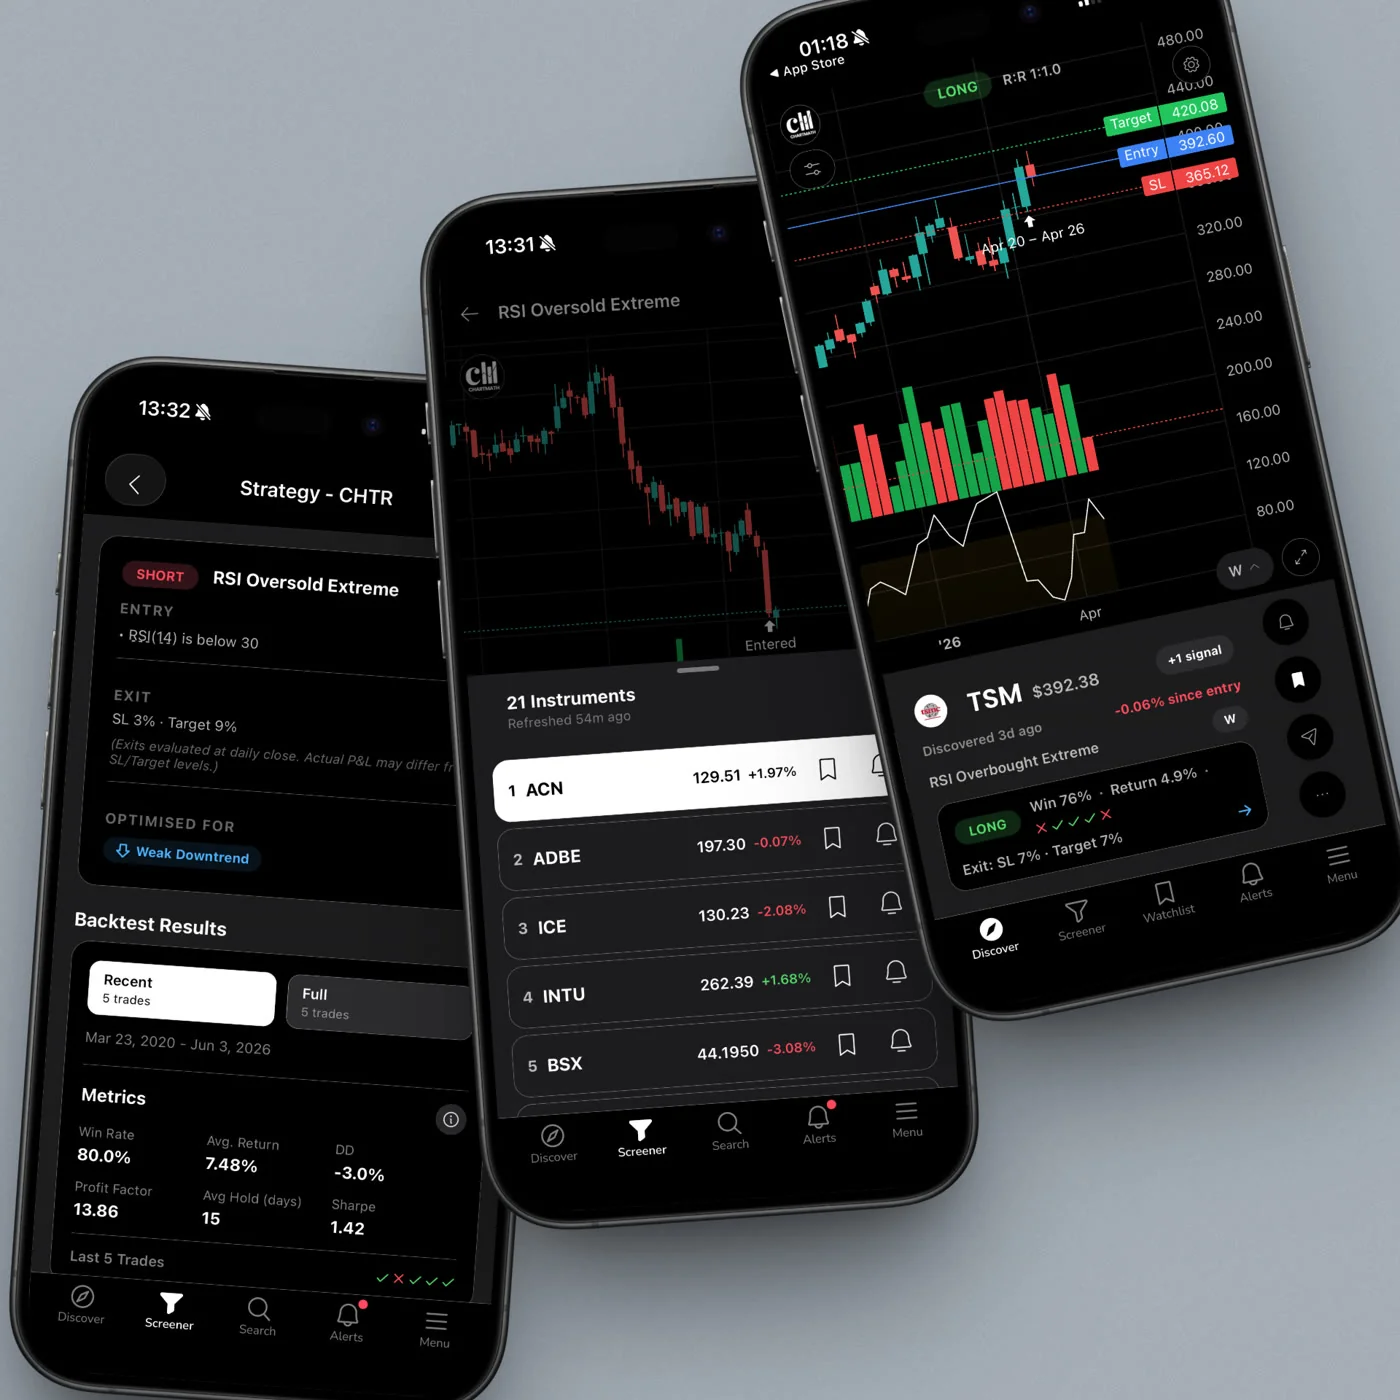
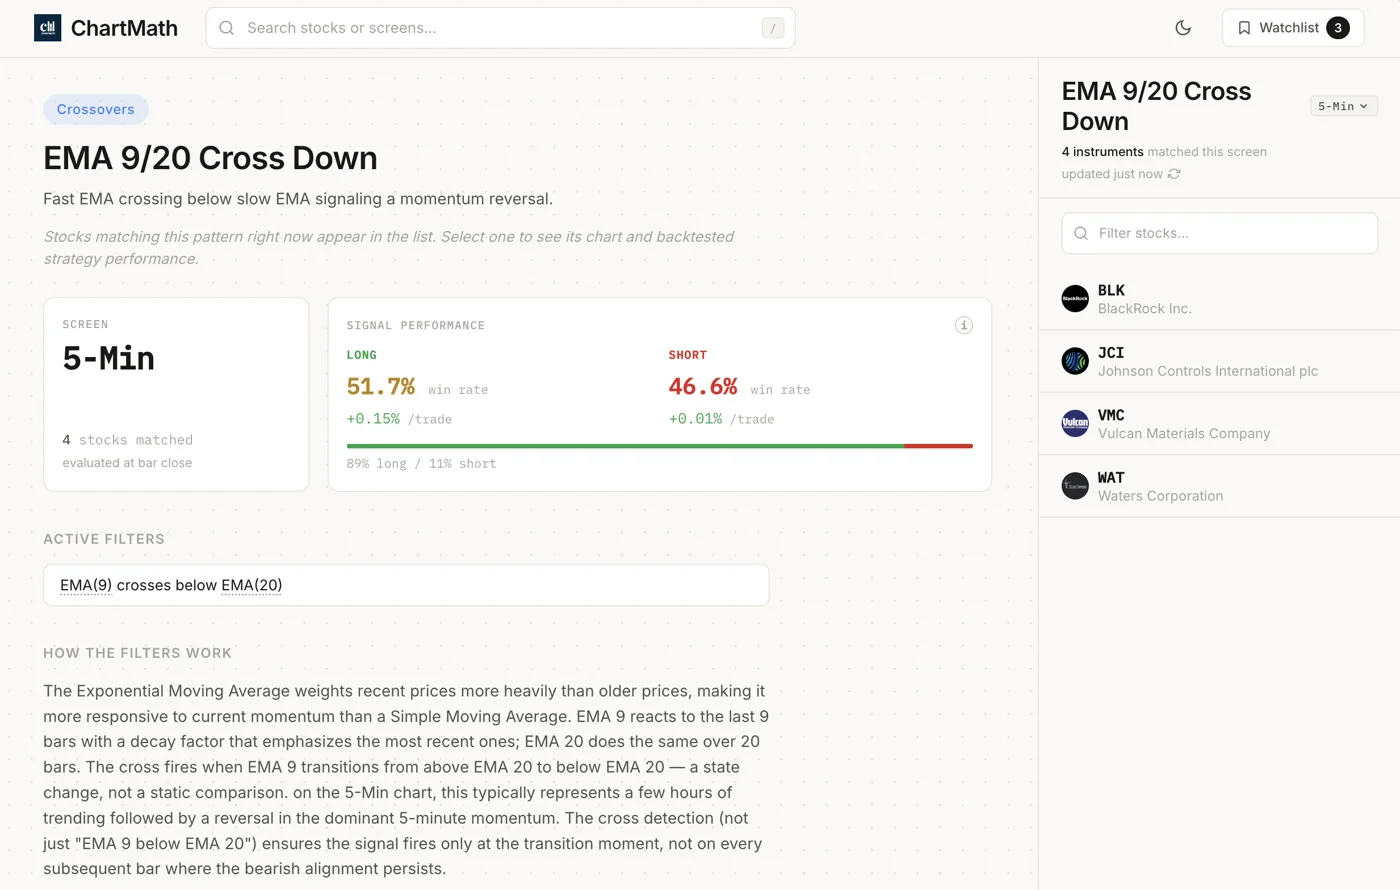
ChartMath is built around a specific idea: every screen in the app should be readable, not just runnable. That means the rule logic is displayed in plain language, the setup has a human-written description, and the backtested statistics are attached to the screen itself.
The app ships with 200+ curated, read-only, backtested technical screens. These screens are not user-built, they're pre-validated by an internal process where AI agents propose candidate screens and every one is backtested before it ships. Only screens with a verified historical track record make it into the app. No Pine Script, no coding required on your end.
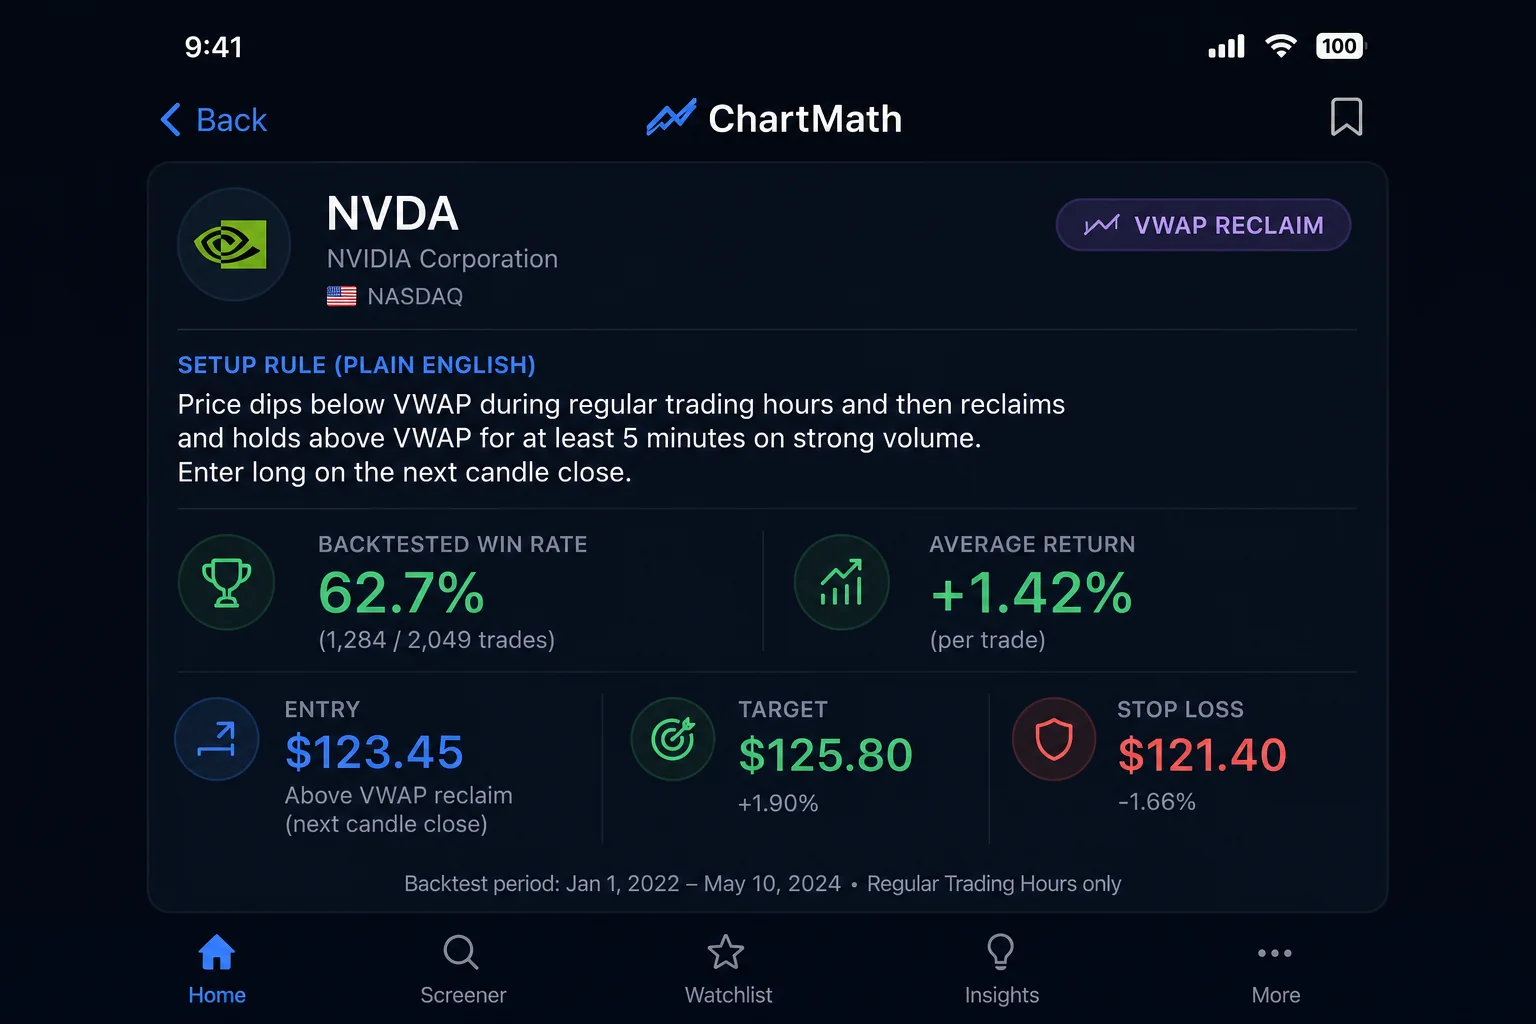
Each screen in ChartMath shows:
- The screen name, a clear label like "VWAP Reclaim" or "RSI Oversold Bounce" or "Opening Range Breakout"
- The rule definition, the exact filter conditions in plain English, the same for every stock that enters that screen
- A human-written description, what the setup is designed to catch and the market behavior hypothesis behind it
- Win Rate and Average Return, the historical statistics across all instances in the backtest
- Expected Value (EV) and sample size, so you can assess the quality of the edge and the reliability of the statistics
One thing to be clear about: ChartMath shows the screen's rule definition, which is the same for every stock that enters that screen. It does not generate a live, per-trade AI narrative explaining why this specific ticker is interesting right now beyond the fact that it matched the rule. The rule is the explanation. That's a meaningful distinction, and it's worth understanding before you use the app.
The universe ChartMath scans is 500+ US equities, 100 crypto pairs, and 11 US futures, across 7 timeframes: 1-minute, 5-minute, 15-minute, 1-hour, Daily, Weekly, and Monthly. US equities are the primary focus. Crypto and futures are live and available for traders who want that coverage.
ChartMath is a copilot, not autopilot. It surfaces setups and shows you the rule and the track record. You decide whether to act, and you execute in your own brokerage. There's no broker connection and no order placement in the app.
6. Reading a ChartMath Screen Card: A Walkthrough
Here's how to use ChartMath's screen transparency in practice, from opening the app to setting an alert.
Step 1: Open the Screener Tab
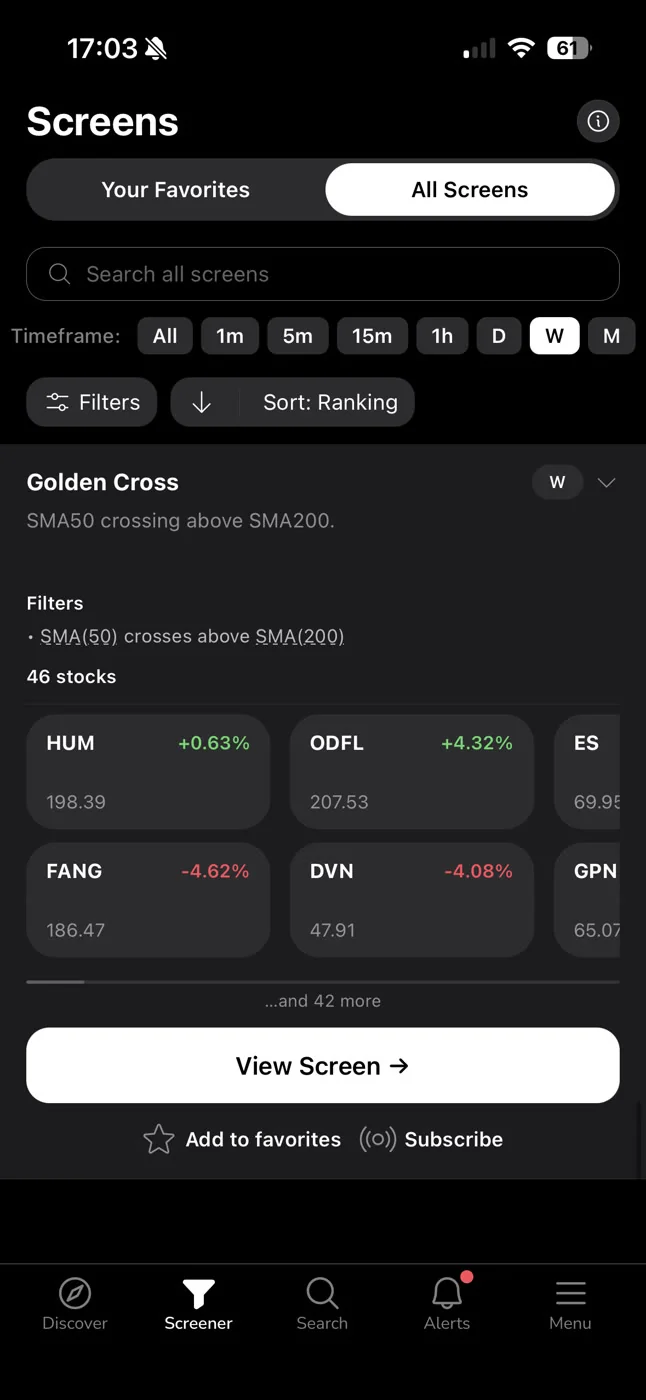
The Screener tab shows the full library of 200+ curated screens. You can browse by category, momentum, mean reversion, breakout, volume-based setups, and more. Each screen is listed with its name and a summary of its historical performance. Browse the full library at chartmath.com/screens.
Step 2: Tap a Screen to See Its Rule and Description
Tapping any screen opens its detail view. This is where you see the rule definition in plain English, the exact conditions a stock must meet to appear in this screen. Below the rule, there's a human-written description of what the setup is designed to catch. Read both before you look at the statistics. Understanding the logic first helps you evaluate whether the setup makes sense in the current market environment.
Step 3: Check the Backtested Statistics
The screen detail shows Win Rate, Average Return, Expected Value, and sample size. These are historical statistics from the backtest, not forecasts. A higher sample size means the statistics are more reliable. EV combines win rate and average return into a single number, a positive EV means the setup has historically produced more in wins than it has lost in losses, on average. For a deeper understanding of how to use backtest data, see how to build winning backtesting strategies.
Step 4: See Which Tickers Currently Match
Below the statistics, you'll see the list of instruments currently matching the screen. These are the stocks (or crypto pairs, or futures) that meet the rule conditions right now. You can tap any ticker to see its chart and decide whether the setup looks clean.
Step 5: Use the Discover Feed for Fresh Matches
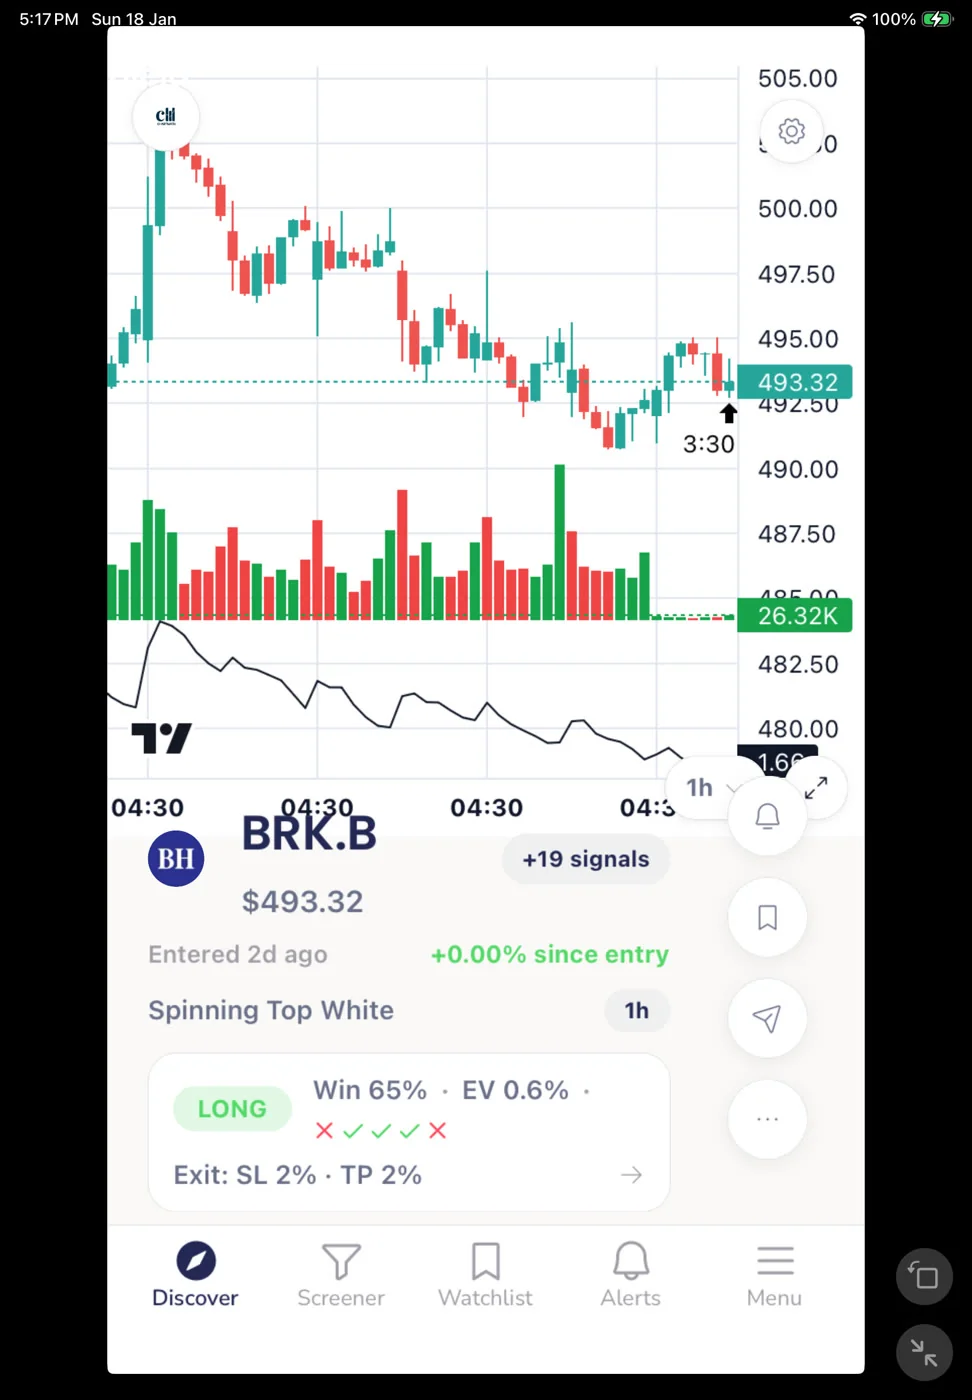
The Discover tab is a swipe-first feed of the freshest setup matches across all screens. Each card shows the ticker, the screen name, the timeframe, and the backtested Win Rate and Average Return. The feed surfaces setups by recency and backtested reliability, so the most actionable matches rise to the top. This is the fastest way to scan across all 200+ screens without opening each one individually.
Step 6: Set an Alert on Screens You Want to Track
If you want to be notified when a new ticker enters a screen, you can favorite the screen and enable alerts. ChartMath sends push notifications when a ticker enters a favorited screen. The alert carries the ticker, the timeframe, the screen name, and a timestamp. You get the context with the notification, not just the ticker symbol. Alerts are push and in-app only. For a broader look at building this into a daily routine, see how to build an efficient trading workflow.
The iOS and Android apps are available at chartmath.com/app. The web layer at chartmath.com/screens is a free, read-only browse layer, no sign-in required to explore the screen library.
7. Backtests Are a Track Record, Not a Guarantee
The backtested statistics in ChartMath are historical data. They tell you how a screen's rule has performed across past instances in the covered universe. They do not predict future performance, and they do not account for commissions, slippage, or spread. ChartMath's backtests use bar-close entries with no look-ahead bias, but they are not net-of-fees calculations.
The right way to use this data is as a historical base rate. A screen with a high Win Rate and positive EV across a large sample size has demonstrated an edge in the past. That's meaningful information. It's not a guarantee that the next trade will be profitable, but it's a far better starting point than acting on a signal with no documented history at all.
Use the statistics to compare screens against each other. A screen with 200 historical instances and a positive EV is more reliable than one with 15 instances and the same win rate. Use sample size as a filter for confidence, not just win rate in isolation. And use the rule definition to decide whether the setup logic makes sense to you before you look at the numbers, a setup you understand is one you can manage when it doesn't go as expected.
This is the systematic approach that separates evidence-based trading from gut-feel trading. You're not following a signal blindly. You're evaluating a rule, checking its historical track record, and making a decision with your eyes open. For more on building this kind of systematic process, see how to trade stocks without watching the screen all day.
A signal without a rule is just noise. A rule without a track record is just a hypothesis. You need both to trade with any real confidence.
8. Frequently Asked Questions
Does ChartMath explain why a specific stock triggered right now?
ChartMath shows the screen's rule definition, the exact conditions a stock must meet to enter that screen. That rule is the same for every stock that enters the screen. The app does not generate a live, per-trade AI narrative explaining why this specific ticker is interesting beyond the fact that it matched the rule. The rule definition, combined with the backtested statistics, is the explanation.
Can I build my own screens?
No. ChartMath's screens are curated and read-only. There is no screen builder. The 200+ screens in the app are pre-validated through an internal process, AI-proposed and backtested before they ship. This is a deliberate design choice: every screen in the app has a documented track record, which wouldn't be possible with user-built screens. If you want to explore the full library, browse it at chartmath.com/screens.
What markets does ChartMath cover?
ChartMath covers 500+ US equities (NYSE and Nasdaq), 100 crypto pairs, and 11 US futures, across 7 timeframes from 1-minute to monthly. It is a US-first product. All session references align to Eastern Time.
Is ChartMath free?
Yes. ChartMath is free. No credit card required. The web screen library at chartmath.com/screens is free to browse with no sign-in.
Does ChartMath place trades automatically?
No. ChartMath is a copilot, not autopilot. It surfaces setups and shows you the rule and the track record. You decide whether to act, and you execute in your own brokerage. There is no broker connection and no order placement in the app.
What technical indicators do the screens use?
ChartMath's screens are built on 30+ technical indicators, covering momentum, volume, volatility, trend, and pattern-based setups. The rule definitions for each screen tell you exactly which indicators and conditions are involved, no guesswork required.
Start With the Rules, Not the Ticker
The next time a screener sends you an alert, ask one question before you do anything else: does this tool show me the rule that triggered it? If the answer is no, you're trading blind. You're acting on someone else's output without the ability to evaluate whether it makes sense.
A stock screener with plain English signal explanations changes that dynamic. The rule is visible. The track record is attached. You can evaluate the setup on its merits before you risk a dollar. That's not a luxury, it's the minimum standard for systematic trading.
ChartMath's full screen library is free to browse right now, no sign-in required. Every screen shows its rule definition, its description, and its backtested Win Rate and Average Return. Start with the screens that match your style, check the statistics, and decide for yourself whether the edge is there.
Browse the full library at chartmath.com/screens, or download the app at chartmath.com/app to get push alerts when a setup you're tracking fires.

See these setups live in ChartMath
200+ curated screens with backtest data. Free. No credit card required.