How to Trade Breakouts Without Missing the Entry

You spotted the setup three days ago. Price had been coiling under a key resistance level for two weeks, volume was drying up, and the chart looked exactly like the textbook breakout pattern you've been studying. You added it to your watchlist. You told yourself you'd watch it closely.
Tuesday at 10:47 AM, it broke out. Clean, high-volume, exactly what you'd been waiting for. You found out at 5:30 PM when you finally opened your brokerage app. The stock was already up 6%. The entry was gone.
That's not a research failure. The analysis was right. The setup was real. The problem was purely mechanical: you had no way to know the moment it happened. That's the breakout entry problem, and it's the one this post is going to solve.
The Breakout Problem Nobody Talks About
Most trading content focuses on finding breakout setups. Chart patterns, volume confirmation, resistance levels — there's no shortage of material on what a breakout looks like. The part that gets skipped is the timing problem: breakouts are worthless if you can't act on them when they happen.
A breakout is, by definition, a time-sensitive event. The edge is in the first bar, not the third. By the time a breakout has confirmed itself across multiple candles and shown up in your end-of-day scan, the risk/reward has already compressed. The stop is further away, the move has already started, and you're either chasing or sitting it out.
For traders with a day job, this creates a specific and frustrating pattern:
- You do the work in the evening. You find the setups. You build the watchlist.
- The next day, you're in meetings, on calls, or heads-down in work from 9 AM to 5 PM.
- The setups fire during market hours. You miss them.
- You either chase the move after hours (bad), skip it entirely (frustrating), or catch it too late (worse than skipping).
The compounding effect is real. Miss enough entries and you start making worse decisions: sizing up on the ones you do catch to compensate, or abandoning setups that were actually good because you've been burned by late entries too many times. The problem isn't your analysis. It's the infrastructure gap between "I see the setup" and "I can act on it."
If you're dealing with this, the post on how to trade stocks without watching the screen all day covers the broader workflow. This post goes deeper on the specific breakout entry problem.
Why Breakout Entries Are So Hard to Time
Static screeners are part of the problem. Tools like Finviz and TradingView's built-in screener are genuinely useful for research. But they show you what has already happened. You run a scan, you get a list of tickers that matched a filter at some point in the recent past, and you go look at the charts manually.
That workflow has two structural problems for breakout trading specifically:
Problem 1: You're always looking backward. A static scan run at 7 PM shows you what was true at market close. It doesn't tell you what happened at 10:47 AM, and it definitely won't tell you what happens at 11:15 AM tomorrow.
Problem 2: No alert means no action. Even if you set up a TradingView price alert on a specific ticker, you're limited to alerts on instruments you've already identified. You can't alert on a condition across a universe of 500+ stocks simultaneously unless you're manually setting up hundreds of individual alerts — which is its own full-time job.
The result is a workflow that's fundamentally reactive. You find out about breakouts after they've moved. You either chase or you don't trade. Neither outcome is good.
What a Breakout Screen Actually Needs to Do
Before getting into the solution, it's worth being precise about what a breakout screen needs to deliver. Not all screens are equal, and the difference matters when you're making real decisions with real money.
A useful breakout screen needs three things:
1. A Clear, Defined Rule Set
A screen that fires on "price looks like it's breaking out" is not a screen. It's a guess. A real breakout screen has specific, testable filter rules: price closes above the 52-week high, volume is at least 1.5x the 20-day average, the close is within 2% of the high of the day. Those rules are repeatable. You can look at a chart and know exactly why the screen fired.
2. A Backtested Track Record
The rule set tells you what the screen looks for. The backtest tells you whether it has historically worked. Win Rate and Average Return are the two metrics that matter here. Win Rate tells you how often the setup resolved in the expected direction. Average Return tells you how much it moved when it did work.
These are historical figures, not forecasts. A screen with a 60% Win Rate doesn't guarantee the next trade works. But it gives you a baseline for whether the setup has a real edge, which is more than you get from a gut-feel alert or a Discord call. For a deeper look at how to use these numbers, the post on building winning backtesting strategies is worth reading.
3. Sample Size That Means Something
A screen with 8 historical occurrences and a 75% Win Rate is not the same as a screen with 200+ occurrences and a 62% Win Rate. Small samples produce misleading statistics. Before you trust a Win Rate, check how many trades it's based on. The larger the sample, the more the number means.
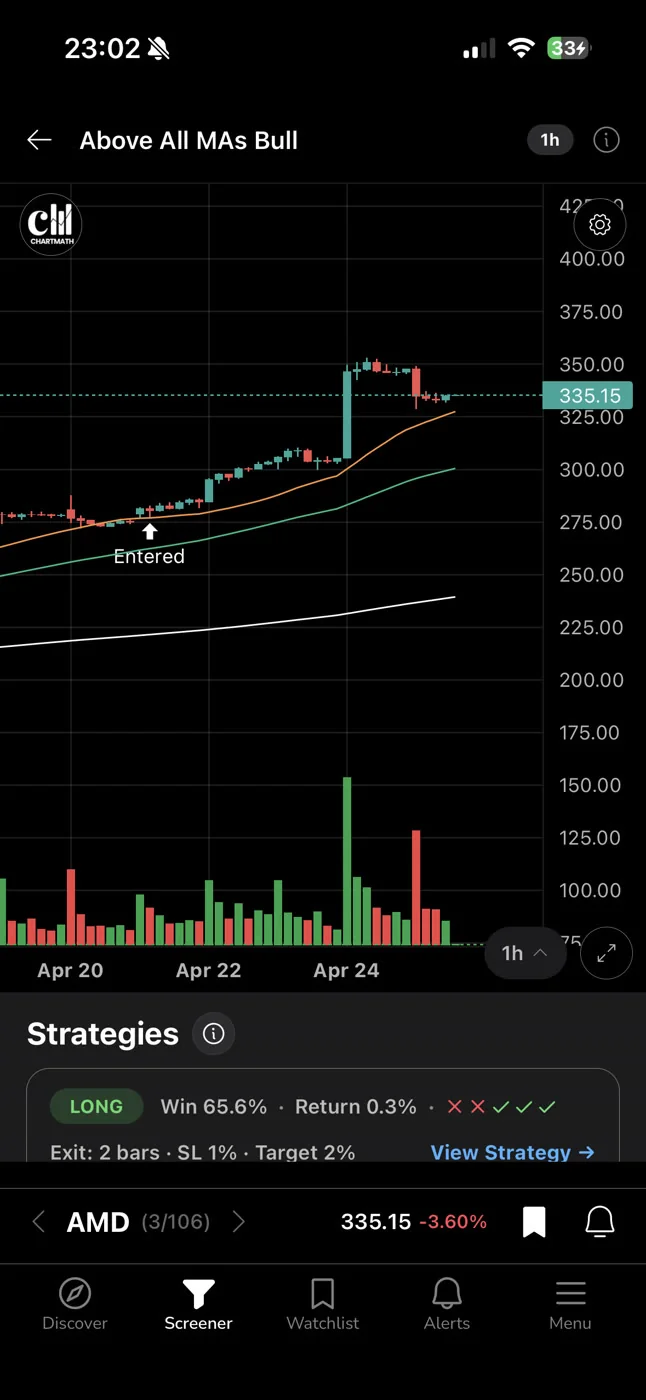
Most retail tools don't give you any of this. They give you a list of tickers. ChartMath's 200+ curated screens each carry their own Win Rate, Average Return, and sample size, so you can compare track records before you commit to a setup.
The Fix: A Real-Time Scanner With Push Alerts
The mechanical solution to missing breakout entries is straightforward: you need a scanner that watches the screens for you and fires a push alert the moment a ticker qualifies. Not a daily digest. Not an end-of-day email. A push notification to your phone, in real time, the moment the condition is met.
That's what ChartMath is built to do. It's a mobile-first trade-discovery app that scans 500+ US equities (plus 100 crypto pairs and 11 US futures) across 200+ curated, backtested technical screens, across 7 timeframes from 1-minute to monthly. When a ticker enters a screen you've favorited, you get a push notification and an in-app alert.
A few things worth being clear about:
- No Pine Script, no coding. The screens are pre-built and read-only. You don't build them. You browse them, find the ones that match your strategy, and favorite the ones you want to track.
- Copilot, not autopilot. ChartMath surfaces the setup. You decide whether to trade it. You execute in your own broker. The app has no broker connection and places no orders.
- 14-day free trial. Every screen, every backtest, every alert, no card to start. After the trial it's $24.99/mo founding pricing (locked 12 months) or $149/yr.
The screens are available to browse on the web at chartmath.com/screens without signing in. The alerts and the Discover feed require the mobile app, available at chartmath.com/app.
How the Workflow Actually Looks
Here's what using ChartMath for breakout trading looks like in practice, step by step.
Step 1: Browse the Screen Library for Breakout-Type Setups
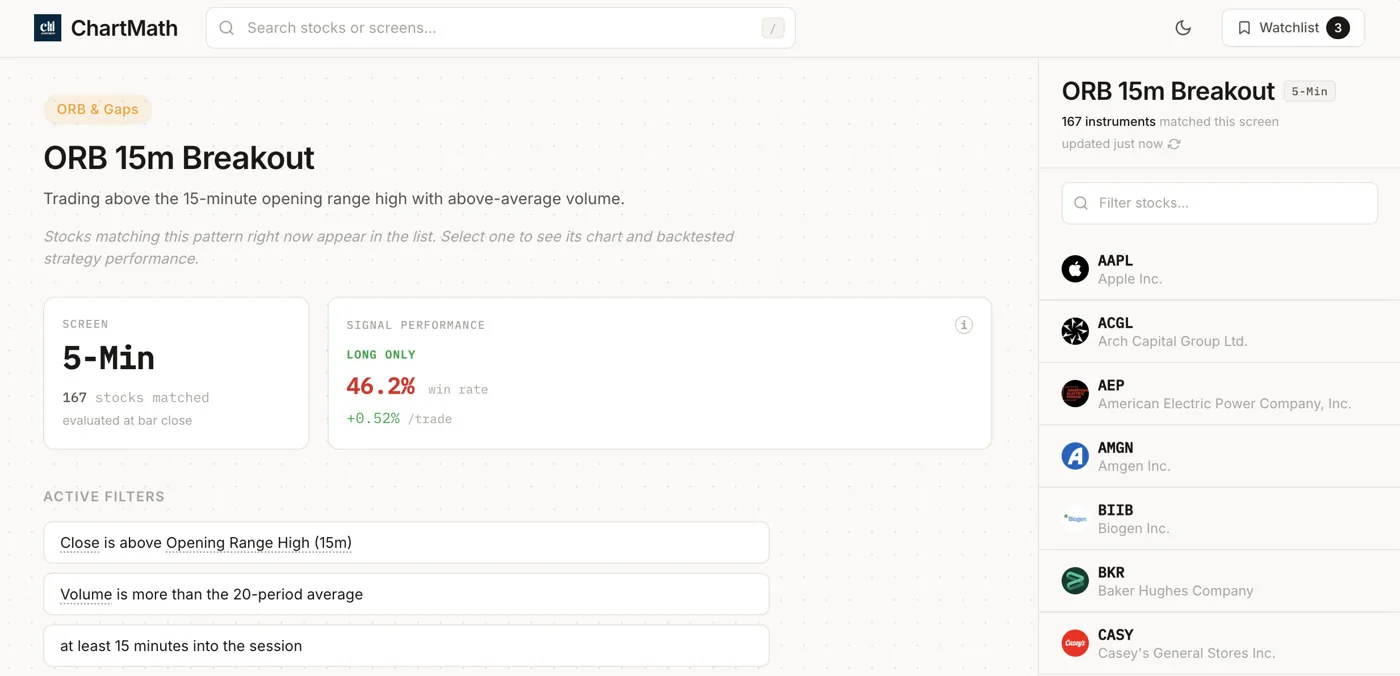
Open the Screener tab in the app (or browse at chartmath.com/screens). You'll see 200+ pre-built screens organized by setup type. For breakout trading, you're looking at screens like 52-Week High Breakout, Opening Range Breakout, VWAP Reclaim, and Low Volatility Compression. Each screen shows its filter rules in plain English and its backtested Win Rate and Average Return.
Spend time here. Read the rules. Check the Win Rate and the sample size. You're not just picking screens that sound good, you're picking screens whose rules match your trading plan and whose track record you're willing to trust.
Step 2: Favorite the Screens You Want to Track
Once you've identified the breakout screens that fit your strategy, favorite them. Favoriting a screen is what activates alerts for it. From that point on, ChartMath watches those screens across the full 500+ US equity universe (plus crypto and futures if you want them) and fires a push alert the moment a ticker enters.
Step 3: The Alert Arrives Mid-Day
You're in a meeting at 10:47 AM. Your phone buzzes. The push notification shows the screen name, the ticker, and the timeframe. You don't need to open the app to know what happened: a stock just entered a screen you've been tracking.
This is the moment that used to be a missed entry. Now it's a decision point.
Step 4: Open the App and Check the Setup
When you have 60 seconds, open the app. The Alerts tab shows the full alert detail: which screen fired, which ticker, which timeframe. Tap through to the screen detail to see the filter rules and the backtested stats. Tap through to the ticker to see the chart.
You're not making a blind decision. You're looking at a setup with a documented rule set and a historical track record.
Step 5: Decide and Execute
Does this ticker fit your plan? Is the setup clean? Does the risk/reward work at the current price? If yes, execute in your own broker. If no, skip it and wait for the next alert.
That's the whole workflow. No manual scanning. No refreshing Finviz. No finding out at 5:30 PM that the move already happened.
For a broader look at building this kind of system around your schedule, the post on swing trading with a full-time job covers the full daily and weekly structure.
Breakout Screens Worth Knowing
ChartMath's screen library covers a wide range of setup types. For breakout-focused traders, these are the categories worth spending time in:
52-Week High Breakout
Price clears a major long-term resistance level, often with volume confirmation. This is one of the most studied breakout setups in technical analysis. The logic is straightforward: stocks making new 52-week highs are, by definition, in uptrends. The breakout above the prior high removes overhead supply and can trigger momentum buying.
The 52-week high breakout screener guide goes deeper on how to use this setup and what to look for in the chart context.
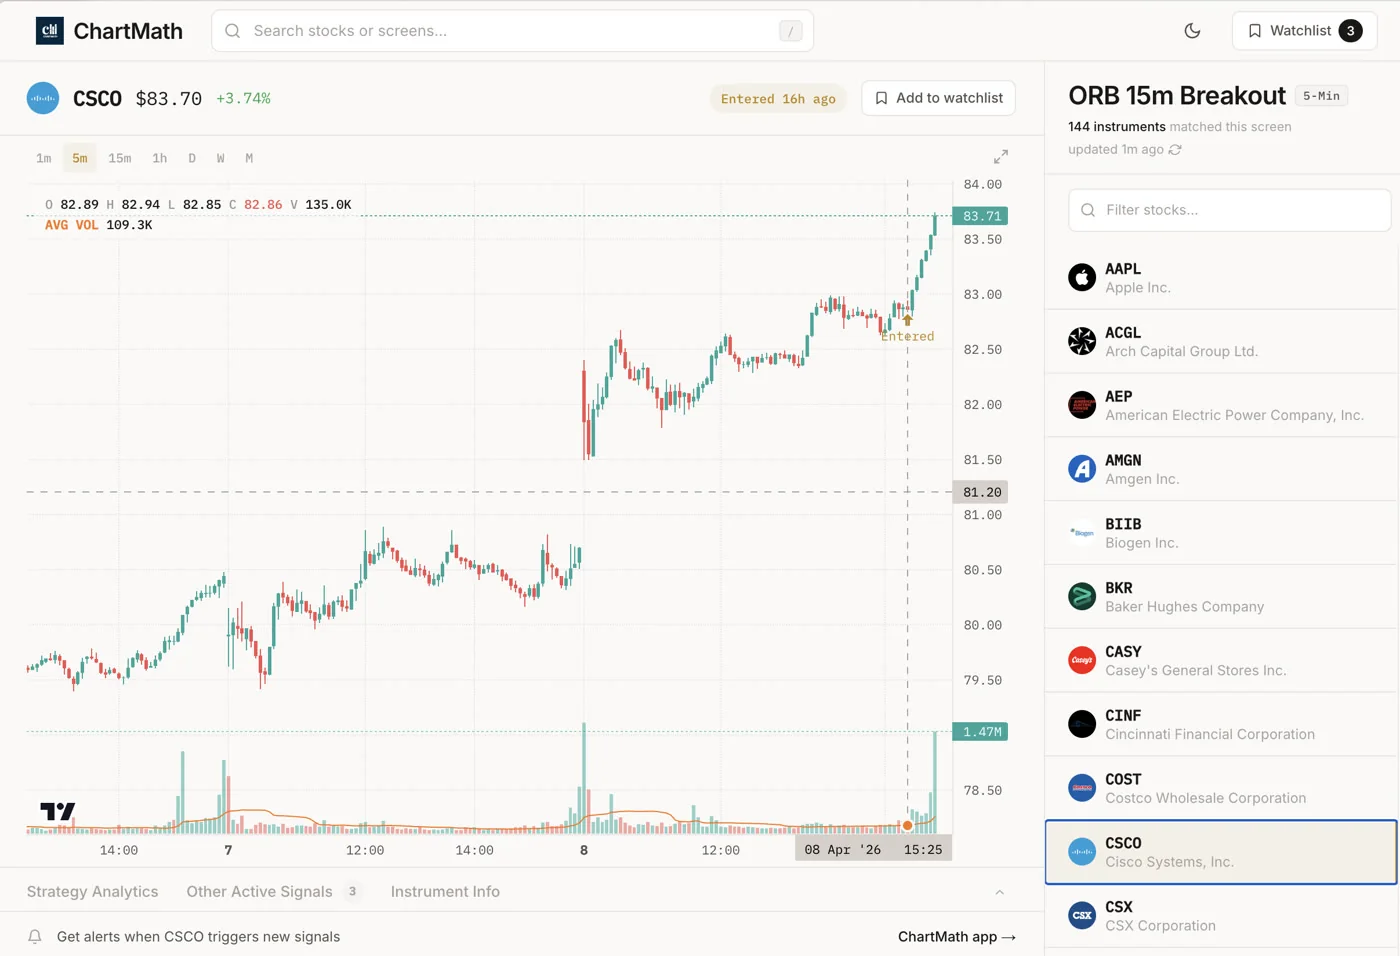
Opening Range Breakout (ORB)
Price breaks above or below the range established in the first 15 or 30 minutes of the trading session. ORB is an intraday setup that works on the 5-minute and 15-minute timeframes. The logic: the opening range represents the market's initial price discovery. A clean break above it, with volume, often signals directional intent for the rest of the session.
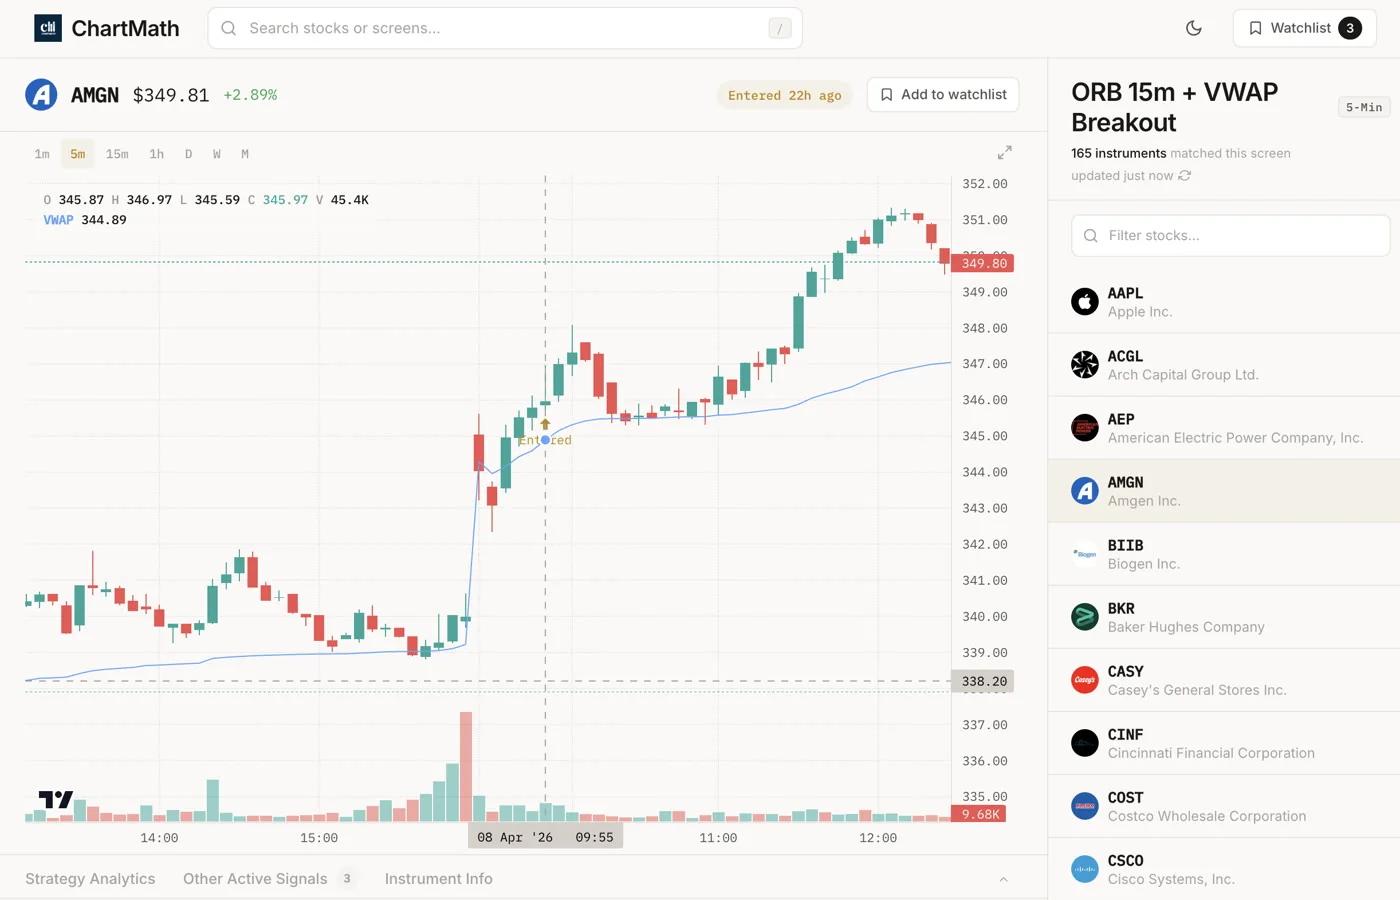
VWAP Reclaim
Price dips below VWAP intraday, then reclaims it. This is a momentum continuation signal: the stock found buyers at VWAP and is resuming its upward move. It's particularly useful for intraday swing entries on stocks that are already in a strong trend. The post on VWAP trading covers the mechanics in detail.
Low Volatility Compression
Price coils in a tight range after a trend move, with declining volume and contracting ATR. This is the setup before the breakout: the stock is building energy before an expansion move. Screening for compression setups lets you get positioned before the breakout fires, rather than chasing it after.
Relative Volume (RVOL) Confirmation
Many of ChartMath's breakout screens incorporate relative volume as a filter. RVOL measures current volume against the historical average for that time of day. A breakout on 2x RVOL is a very different signal from a breakout on 0.5x RVOL. Volume confirms conviction. The post on RVOL and volume analysis explains how to read these numbers.
Each of these screens in ChartMath shows its own Win Rate and Average Return. You can compare them side by side before you decide which ones to track. That's a meaningful advantage over tools that give you a list of tickers with no historical context.
Pre-Setting Your Stop and Size Before the Alert Fires
Getting the alert is only half the problem. The other half is being ready to act on it without freezing or rushing.
Here's a pattern that kills a lot of otherwise good trades: the alert fires, the setup looks clean, but you haven't thought through your stop placement or your position size. So you either skip the trade (because you don't have time to figure it out mid-meeting) or you rush into it without a plan (which is how you end up holding a losing position with no exit rule).
The fix is to pre-set your rules before the alert arrives. For each screen type you're tracking, know in advance:
- Where your stop goes. For a 52-week high breakout, the stop is typically just below the breakout level. For an ORB, it's below the opening range low. Define this rule for each screen type before you start getting alerts.
- How much you're risking. A standard rule is 1% of account per trade. If you know your account size and your stop placement rule, you can calculate your position size in seconds.
- What "clean" looks like. Not every ticker that enters a screen is worth trading. Pre-define what a clean setup looks like for each screen type: minimum volume, price range, chart context. When the alert fires, you're running a checklist, not making a judgment call from scratch.
This is what "copilot, not autopilot" means in practice. ChartMath does the scanning and the alerting. You bring the plan. When the two meet, the decision is fast and rule-based, not emotional.
For the full framework on building this kind of systematic approach, the post on building an efficient trading workflow is a good next read.
Frequently Asked Questions
Does ChartMath place trades automatically?
No. ChartMath is a trade-discovery copilot, not an autopilot. It surfaces setups and sends alerts. You decide whether to trade and execute in your own broker. There is no broker connection and no order placement.
Can I build my own breakout screen?
No. The 200+ screens are curated and read-only. There is no screen builder and no Pine Script. The point is that the screens are already built, backtested, and ready to use. You pick the ones that fit your strategy.
How do I receive alerts?
Alerts are delivered via push notification and in-app only. You get them on your phone the moment a ticker enters a screen you've favorited.
What markets does ChartMath cover?
ChartMath is US-first: 500+ US equities (NYSE/Nasdaq), plus 100 crypto pairs and 11 US futures. All 7 timeframes from 1-minute to monthly are covered across the full universe.
Is ChartMath free?
ChartMath is a paid product with a 14-day free trial. After the trial it's $24.99/month founding pricing (locked for 12 months) or $149/year.
Do I need to know Pine Script or coding?
No. The screens are pre-built. You browse them, read the rules, check the backtested stats, and favorite the ones you want. No coding, no scripting, no setup beyond downloading the app.
Stop Finding Out After the Move
The breakout entry problem is solvable. It's not a skill gap. It's an infrastructure gap. You need a scanner that watches the setups for you and puts the alert in your pocket the moment a ticker qualifies, not at 5:30 PM when the move is already done.
Start with a 14-day free trial, then $24.99/mo founding (locked 12 months) or $149/yr — no card to start. Browse the 200+ screen library at chartmath.com/screens to see what's available, then get the app at chartmath.com/app to start getting push alerts the moment a breakout setup fires.
The next time a stock on your watchlist breaks out at 10:47 AM, you'll know about it at 10:47 AM.

Ankush Jindal
LinkedInSee these setups live in ChartMath
200+ curated screens with backtest data. 14-day free trial.