How to Run a Weekly Trading Review in 20 Minutes

Sunday afternoon. The market is closed, your trades from the week are sitting in your brokerage history, and you have two choices. You can scroll through Twitter for hot takes on next week's movers, or you can spend 20 focused minutes turning last week's trades into a repeatable edge. One of those compounds. The other doesn't.
A short weekly trading review is the single highest-leverage habit for any swing trader who wants to get systematic. Not more screen time. Not a bigger watchlist. Not a fancier scanner. The review is where raw trade data becomes feedback, and feedback is what separates traders who improve from traders who just repeat the same mistakes with more confidence.
This guide walks through a five-step, 20-minute Sunday review you can run every week. It's designed for traders with a day job: no spreadsheet obsession, no hours of journaling, just a clean process that builds over time.

Why a Weekly Trading Review Beats More Screen Time
Most traders who struggle don't lack setups. They lack feedback. They take a trade, it wins or loses, and they move on. Over time, they accumulate experience without accumulating insight. The same mistakes repeat because they were never named, never logged, never examined.
More screen time doesn't fix that. Watching more charts gives you more data points, but data without reflection is just noise. The traders who improve fastest are the ones who close the loop: they trade, they review, they adjust, they trade again.
Twenty minutes on Sunday does that. It's short enough to actually do every week, and structured enough to produce real signal. Over 12 weeks, you'll have a genuine record of what's working, what isn't, and which setups fit your schedule and risk tolerance. That record is worth more than any single trade.
Here's the five-step framework, with a time budget for each step.
1. Log the Week's Trades (5 Minutes)
Start with the facts. Pull up your brokerage history and write down every trade you took this week. Keep the format simple:
- Ticker and setup name (e.g., "AAPL, VWAP Reclaim")
- Timeframe (Daily, 1h, 15m)
- Entry price and exit price
- Stop level (where you planned to exit if wrong)
- Position size (shares or contracts)
- Result (dollar P&L or percentage)
A notes app works. A spreadsheet works. A physical notebook works. The format doesn't matter; the habit does. The goal at this stage is a factual record, not a narrative. Don't write "I felt good about this one" or "the market was weird." Just the numbers.
If you took zero trades this week, log that too. "No trades taken" is a valid data point. It tells you whether you're being selective or whether you're avoiding the market for the wrong reasons.
This step takes five minutes if you do it every week. It takes 45 minutes if you skip three weeks and try to reconstruct everything from memory.
2. Separate Process from Outcome (4 Minutes)
Here's the trap most traders fall into: they judge their decisions by whether they made money. A winning trade feels like a good decision. A losing trade feels like a mistake. That logic sounds reasonable, but it's wrong, and it will quietly wreck your development as a trader.
Poker players call this "resulting": evaluating the quality of a decision based on its outcome rather than the quality of the decision itself. A good decision can produce a losing trade. A bad decision can produce a winning trade. If you only learn from outcomes, you'll start repeating bad decisions that happened to work and abandoning good ones that happened to lose.
For each trade in your log, ask two questions:
- Was the setup valid before I entered? Did it meet the criteria of the screen I was trading? Was the entry clean, or did I force it?
- Did I follow my rules? Did I place a stop? Did I size correctly? Did I exit at the planned level, or did I move the goalposts mid-trade?
Grade the decision, not the P&L. A trade that lost money but followed the rules is a good trade. A trade that made money but broke your rules is a bad trade, and it's teaching you the wrong lesson.
This is the step most traders skip, and it's the one that matters most. If you only do one thing from this guide, make it this.
For more on building the systematic habits that support this kind of process-first thinking, the guide to building an efficient trading workflow covers the full picture.
3. Compare Your Results Against Backtested Expectancy (4 Minutes)
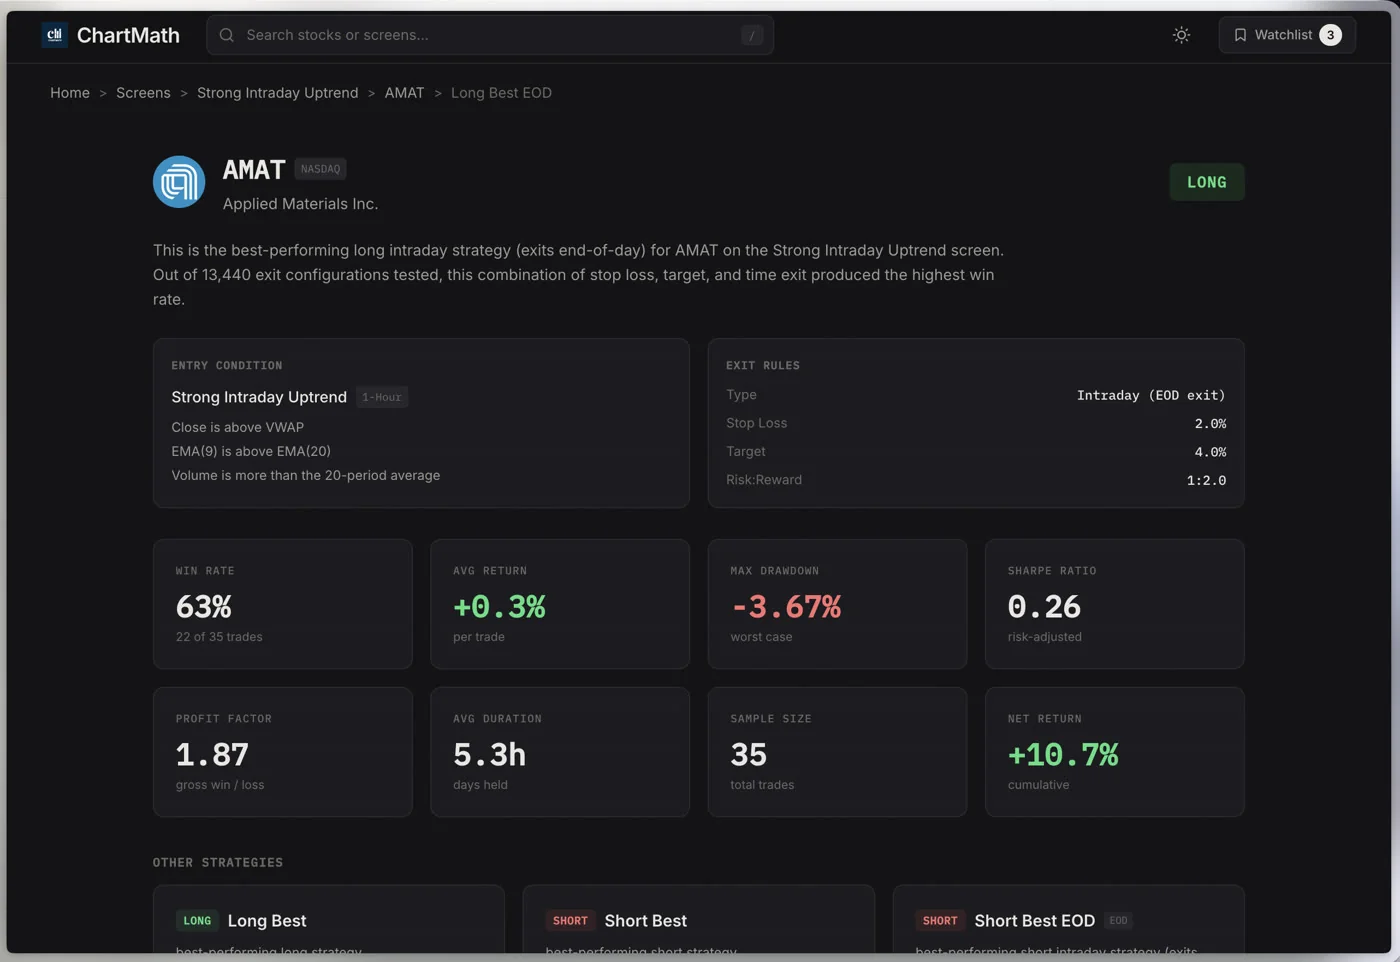
Once you've graded your decisions, compare your actual results to the historical baseline for each setup you traded. This is where having a tool with real backtest data becomes useful.
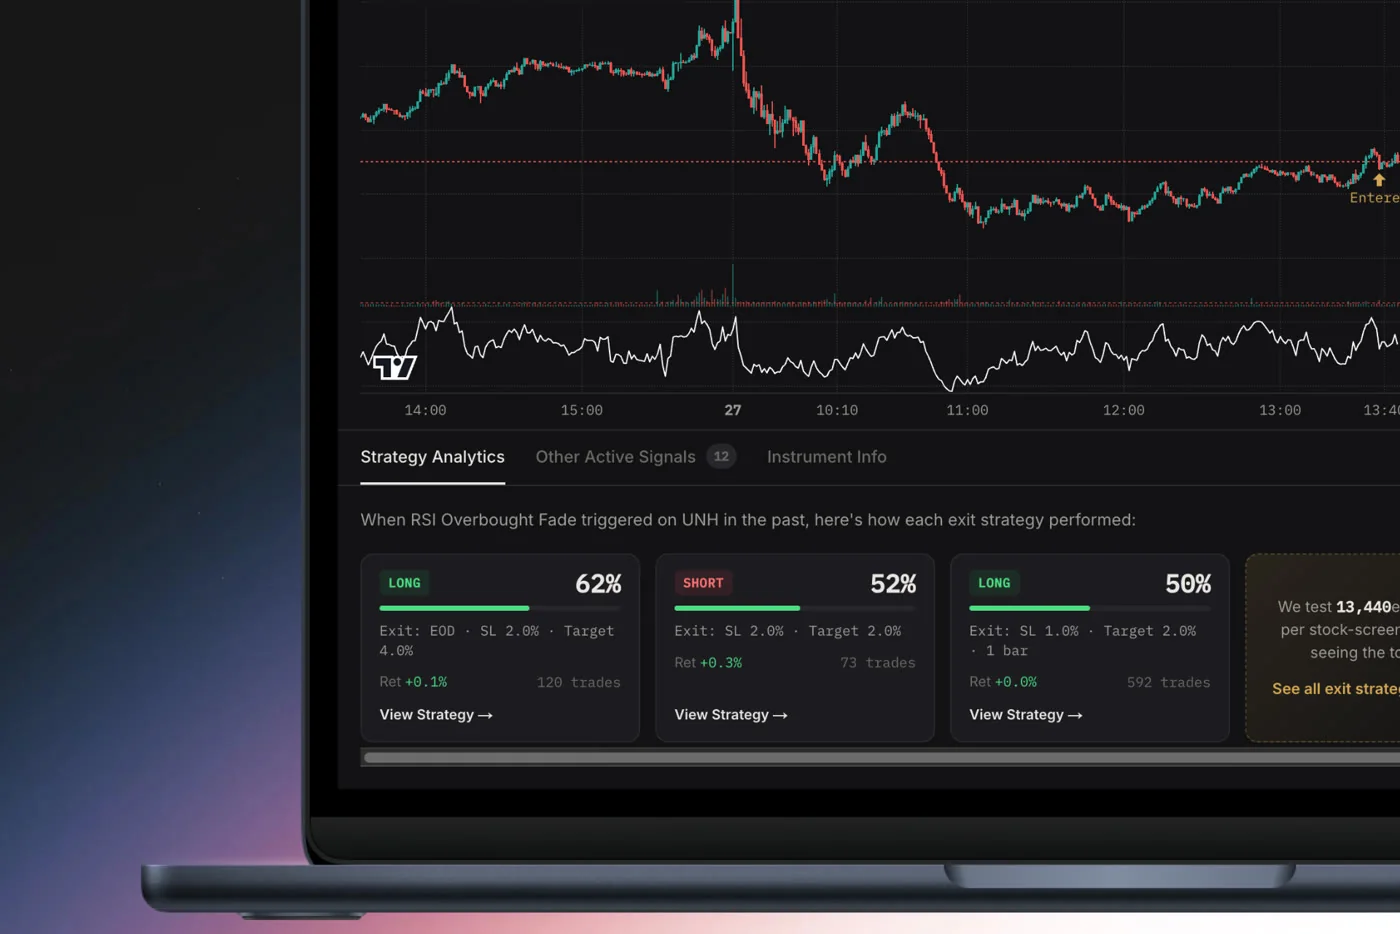
Every screen in ChartMath shows its historical Win Rate and Average Return across the instruments in its universe. Those numbers are the setup's expectancy baseline: what the screen has done historically, across many occurrences, before you ever touched it.
When you compare your trades against that baseline, a few things become clear:
- If your win rate is close to the screen's historical win rate, your execution is roughly in line with the backtest. The variance you're seeing is normal.
- If your win rate is significantly lower, the gap is usually execution: entering late, sizing too large, moving stops, or exiting early on winners.
- If your win rate is higher over a small sample, don't get overconfident. Small samples are noisy. Three to five trades tells you almost nothing.
One important note: backtests are historical track records, not forecasts or guarantees. A screen with a strong historical win rate can go through losing stretches. The baseline is a reference point for measuring your execution, not a promise about future results. ChartMath's backtests use bar-close entries with no look-ahead; they don't model commissions, slippage, or spread.
The comparison step is most useful over time. After 8 to 10 weeks of reviews, you'll have enough data to see whether you're consistently underperforming a setup's baseline, and that pattern is actionable. For a deeper look at how to use backtest data in your process, the complete guide to backtesting strategies is worth reading alongside this.
4. Tag Your Recurring Mistakes (4 Minutes)
Every trader has a short list of mistakes they make repeatedly. The problem is that most traders never name them, so they never fix them. This step is about building that list.
After grading each trade in step two, assign a mistake tag to any trade where you broke your rules. Keep the tags simple and consistent. A short list of common ones:
- No stop placed: entered without a defined exit if wrong
- Oversized: position was too large relative to your account and risk tolerance
- Chased a tip: entered based on a Discord alert, a tweet, or a friend's recommendation rather than a verified setup
- Traded on mood: entered because you were bored, frustrated from a previous loss, or trying to "make back" money
- Moved the stop: widened or removed a stop after entry to avoid being stopped out
- Exited early: closed a winning trade before the planned target because of anxiety
The tags themselves aren't the point. The pattern is. When the same tag appears two or three weeks in a row, that's your priority fix. You can't address a mistake you haven't named, and you can't name a mistake you haven't logged.
Keep the mistake log next to your trade log. Over time, you'll notice that most traders have two or three recurring mistakes, not ten. Fixing those two or three has more impact than any new setup or scanner.
If "chased a tip" keeps showing up, the fix isn't willpower. It's removing the source. Replacing unvalidated Discord alerts with backtested setups from a tool like ChartMath is a structural fix, not a discipline fix. The real system for swing trading with a full-time job covers how to build that kind of structure into your week.
5. Decide Which Screens and Setups to Trust Next Week (3 Minutes)
The last step is forward-looking. Based on your review, decide which setups you'll trade next week and which ones you'll sit out.
This is a planning step, not a trading step. You're not placing orders. You're deciding which screens have earned your trust based on their historical baseline and your own recent execution, and you're queuing up candidates for the week ahead.
A few practical questions to guide this step:
- Which screens have I traded for at least four to six weeks with results close to their historical baseline? Those are the setups to keep.
- Which screens am I consistently underperforming? Either fix the execution issue or pause that screen until you understand why.
- Are there setups I've been watching but haven't traded yet? Add them to your watchlist and let the alerts do the monitoring during the week.
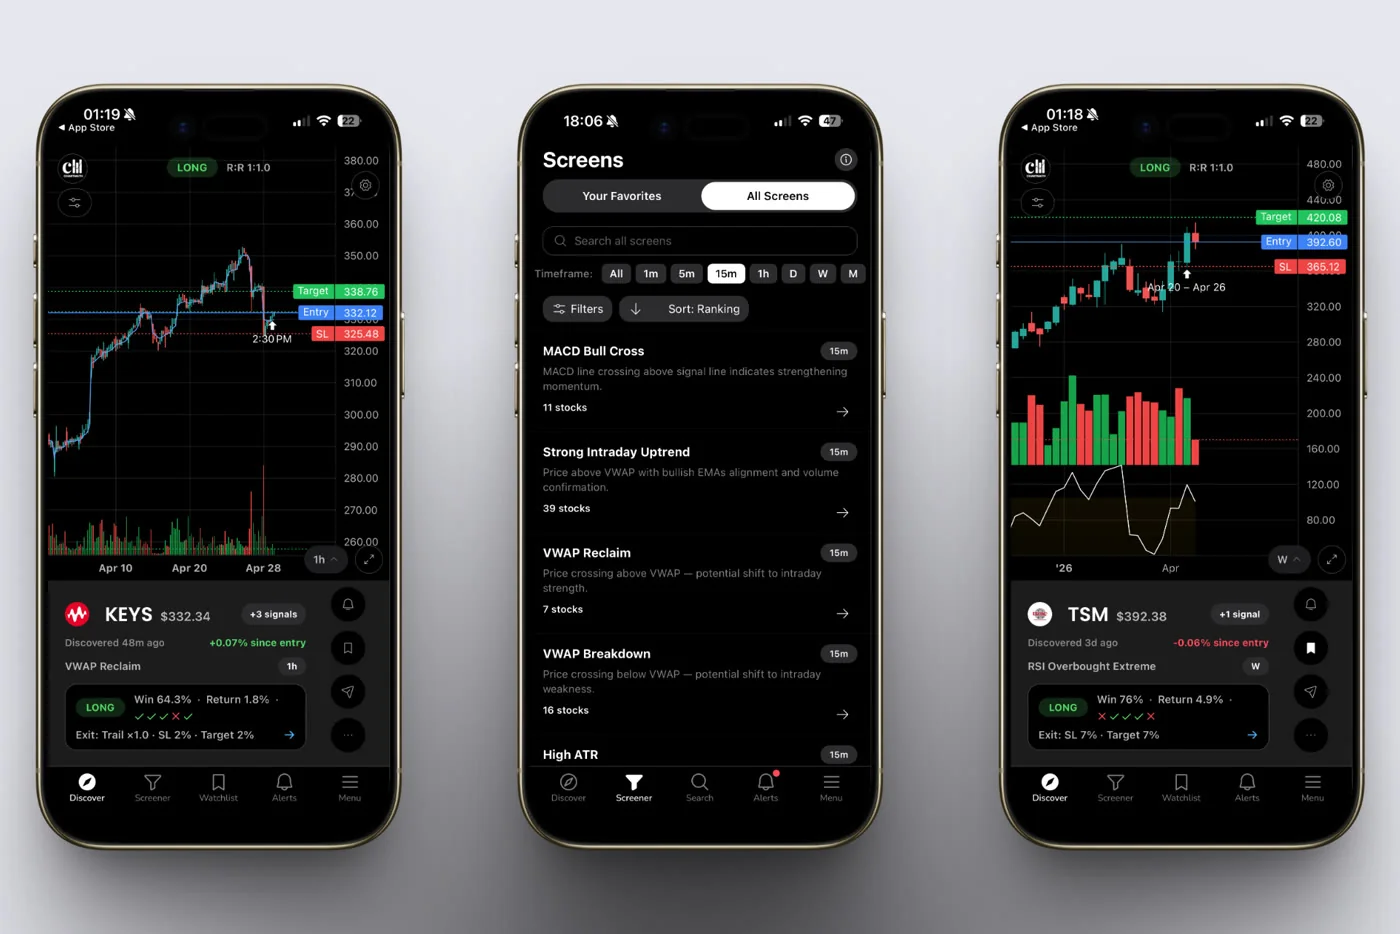
ChartMath's 200+ curated, read-only screens give you a structured library to work from. You're not building screens from scratch or writing Pine Script. You browse the library, identify the setups that fit your timeframe and style, and let the app watch for entries during the week. The guide to using a scanner without Pine Script explains how that library is structured if you're new to it.
By the end of this step, you should have a short list: two to four setups you're actively trading next week, a watchlist of candidates queued up, and a clear sense of what you're looking for. That's the week's plan.
How ChartMath Supports the Weekly Review
The weekly review framework above works with any trade log and any screener. But ChartMath is built in a way that makes each step faster and more grounded.
Here's where it fits into each step:
Expectancy Baseline (Step 3)
Every screen in ChartMath shows its historical Win Rate and Average Return. When you're comparing your actual results against a setup's baseline, those numbers are right there on the screen card. You don't need to calculate them yourself or trust a third-party claim. The backtest is built into the tool.
Setup Library (Step 5)
ChartMath's 200+ curated screens cover a wide range of technical setups across 500+ US equities, plus 100 crypto pairs and 11 US futures, across 7 timeframes from 1-minute to monthly. When you're deciding which setups to trust next week, you're working from a library that's already been backtested and validated. You're not starting from scratch.
Watchlist and Discover Feed
Once you've decided which setups to watch, add the relevant tickers to your watchlist and let ChartMath's Discover feed surface candidates during the week. Push alerts fire when a setup forms, so you don't need to monitor charts intraday. The app does the scanning; you do the deciding.
That last point matters: ChartMath is a copilot, not an autopilot. It surfaces setups and shows you the historical context. You decide whether to trade, and you execute in your own broker. There's no broker connection, no auto-trading, no orders placed on your behalf.
ChartMath starts with a 14-day free trial, no card to start: every screen, every backtest, every alert. After the trial it's $24.99/month founding pricing (locked for 12 months) or $149/year.
If you want to see the screen library before downloading, you can browse it at chartmath.com/screens. The web layer is anonymous and read-only, so you can get a feel for the setup categories without signing up.
For traders who want to understand how ChartMath fits into a broader daily workflow, the guide to trading without watching screens all day covers the full picture.
The Compounding Effect of Consistent Weekly Reviews
One review does almost nothing. Twelve consecutive reviews build something real.
After three months of weekly reviews, you'll have a clear picture of which setups fit your schedule, which mistakes you make under pressure, and whether your execution is improving relative to the setups' historical baselines. That picture is your edge, and it's one that no scanner or alert service can give you directly. You have to build it yourself, one Sunday at a time.
The traders who get systematic aren't the ones who find a better setup. They're the ones who close the feedback loop. The weekly review is that loop.
Twenty minutes. Five steps. Every Sunday. That's the habit.
The review is the mechanism that turns a screener into a systematic edge. Without it, you're just collecting signals. With it, you're building a process.
If you're ready to give the review a structure to work against, start by browsing ChartMath's backtested screen library at chartmath.com/screens. When you're ready to run the full workflow on mobile, including push alerts and the Discover feed, get the app at chartmath.com/app. Start with a 14-day free trial, then $24.99/mo founding (locked 12 months) or $149/yr — no card to start.
This Sunday is a good time to start.

Ankush Jindal
LinkedInSee these setups live in ChartMath
200+ curated screens with backtest data. 14-day free trial.