Part-Time Trading in 2026: How Busy Professionals Are Catching High-Quality Setups in Under 30 Minutes a Day

Three weeks ago, a setup you'd been tracking for a month finally triggered. Clean breakout, elevated volume, textbook entry. You found out at 6:47 PM when you opened your brokerage app to check something else. The move was already 6% done. That's not a strategy failure. That's a workflow failure — and it's the defining frustration of part-time trading.
The good news: the problem is solvable without quitting your job, buying a second monitor, or spending four hours a night staring at charts. What it requires is a system built around the actual constraints of your life — not a full-time trader's workflow crammed into stolen minutes.
This post walks through a practical daily routine that serious part-time traders are using in 2026 to find and act on high-quality swing setups in under 30 minutes of active attention per day. No gut calls. No Discord signals. Just deterministic screens with documented Win Rates and Average Returns, and alerts that fire when something real happens.
The 30-Minute Constraint Is a Feature, Not a Bug
Most part-time traders make the same mistake: they try to replicate a full-time trader's workflow in whatever time they can steal. They open five tabs at 7 AM, scan 80 tickers manually, and then spend the rest of the day anxiously refreshing a browser they can't actually act on. That's not a compressed version of a good system. It's a bad system with extra stress.
Swing trading is structurally compatible with a day job in a way that day trading simply isn't. Setups on the daily and weekly timeframe form over days, not seconds. The entry window for a clean breakout above a multi-week base is measured in hours, not milliseconds. You don't need to be watching at 10:43 AM. You need to know, before 9:30 AM, exactly what you're watching and why, and then let an alert tell you when to look up.
The three-phase routine below is built around that reality. It has a hard time budget: 15 minutes before the open, under 2 minutes at midday (only if something fires), and 10 minutes after the close. That's it. The rest of the day, the scanner works while you don't.
For a deeper look at building a repeatable process around this kind of workflow, the efficient trading workflow guide covers the structural decisions in more detail.
Phase 1: The Premarket Scan (15 Minutes, Before 9:30 AM ET)
This is the most important 15 minutes of your trading day. Everything that happens later depends on the quality of the work you do here. The goal is simple: leave the house knowing exactly which 3 to 5 names you're watching, which setup each one is in, and what price action would confirm the entry.
What to Do in Those 15 Minutes
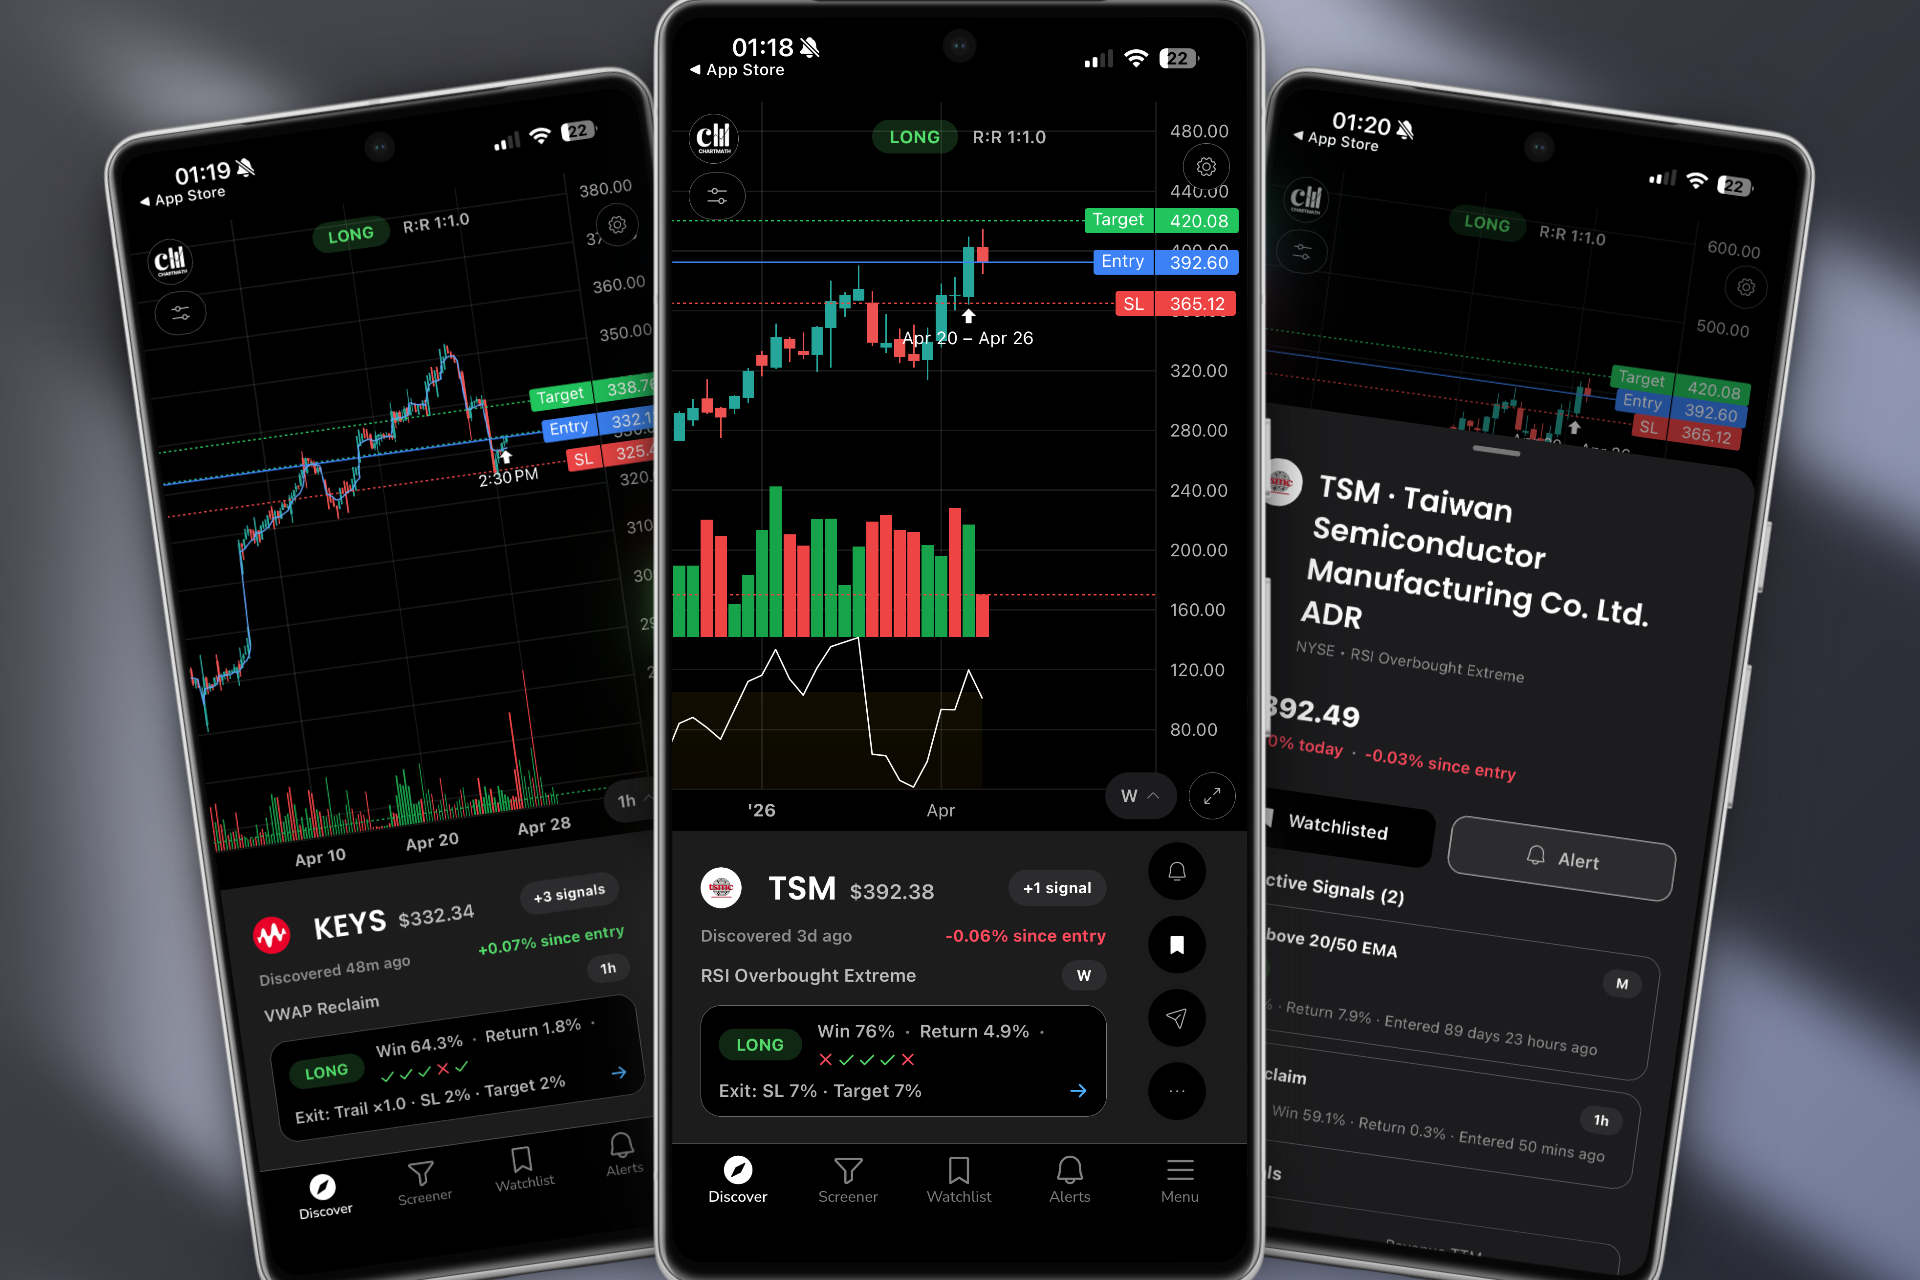
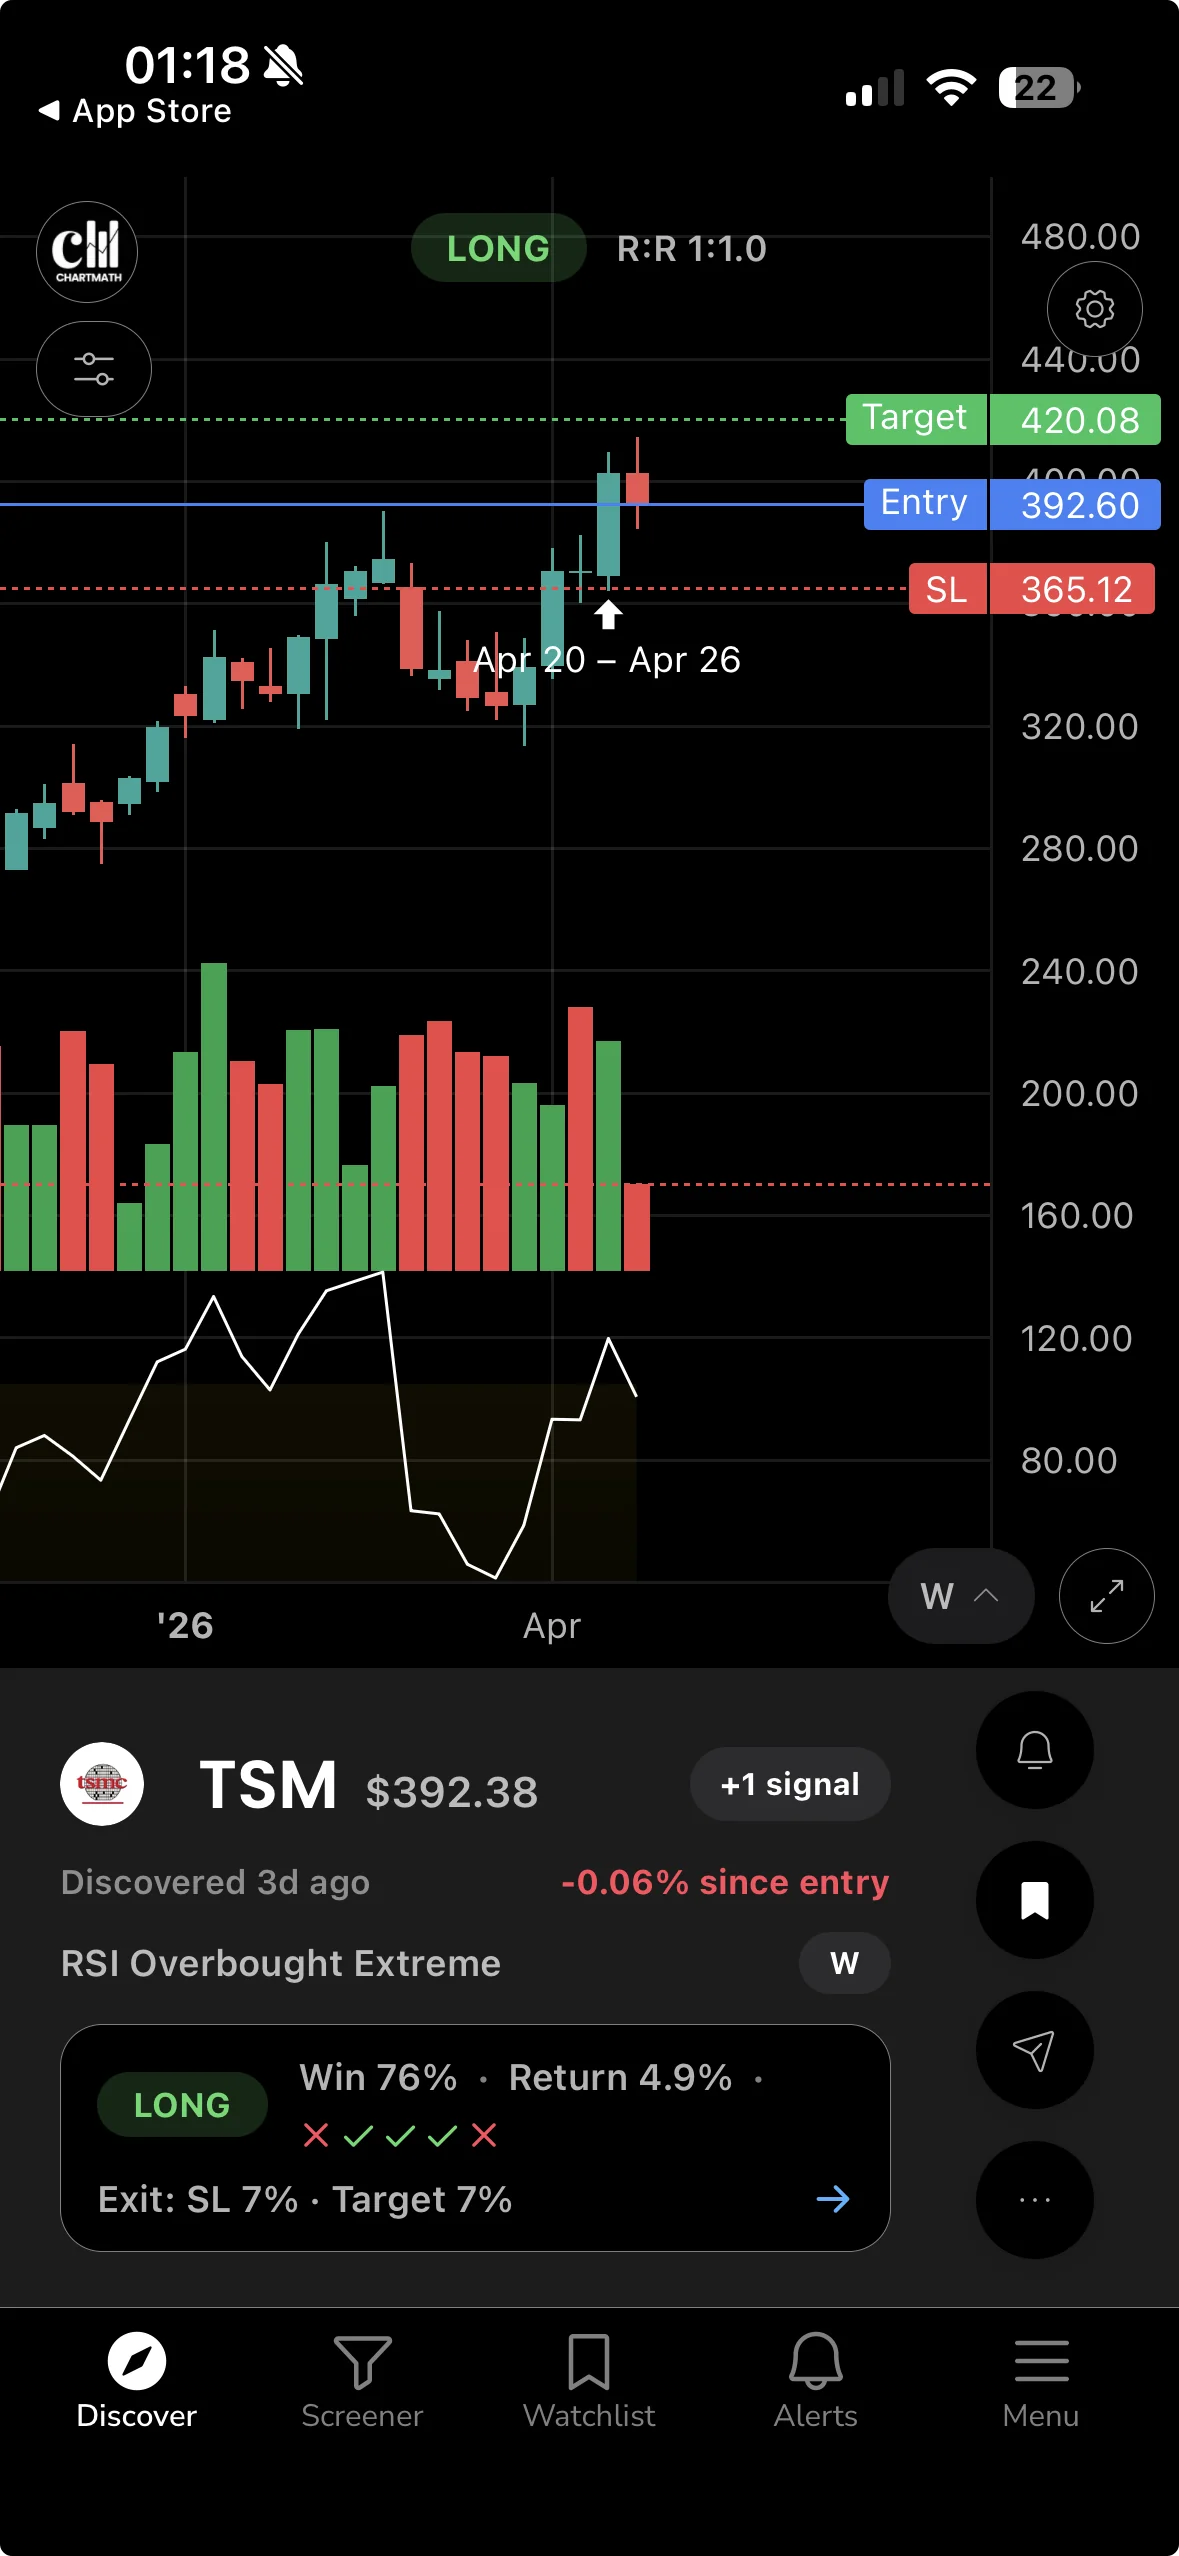
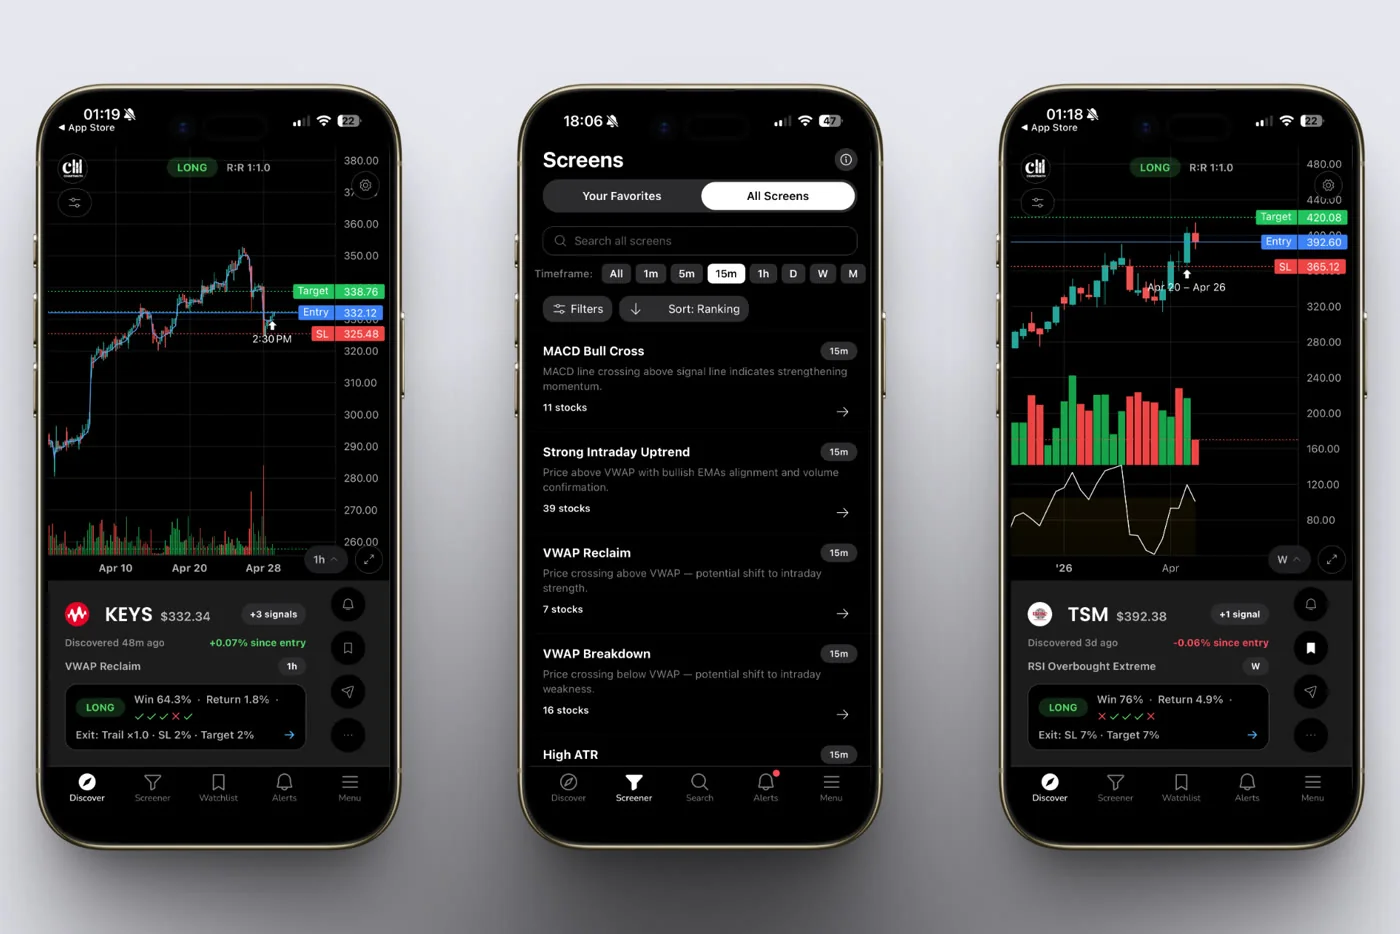
Open the Discover feed. ChartMath's Discover tab is a swipe-first feed of explainable entry cards, each one representing a specific stock matched to a specific screen on a specific timeframe. Each card shows the screen name, the timeframe, the backtested Win Rate, and the Average Return for that setup historically. It also tells you, in plain English, why the setup triggered right now. You're not looking at a raw list of tickers. You're looking at a curated set of reasons to pay attention.
Swipe through the feed. You're looking for setups that match your style, breakouts, VWAP reclaims, RSI bounces, momentum setups, on the daily or weekly timeframe. Ignore the 1-minute and 5-minute cards unless you have a specific reason to trade intraday. As a swing trader with a day job, those timeframes are mostly noise for your purposes.
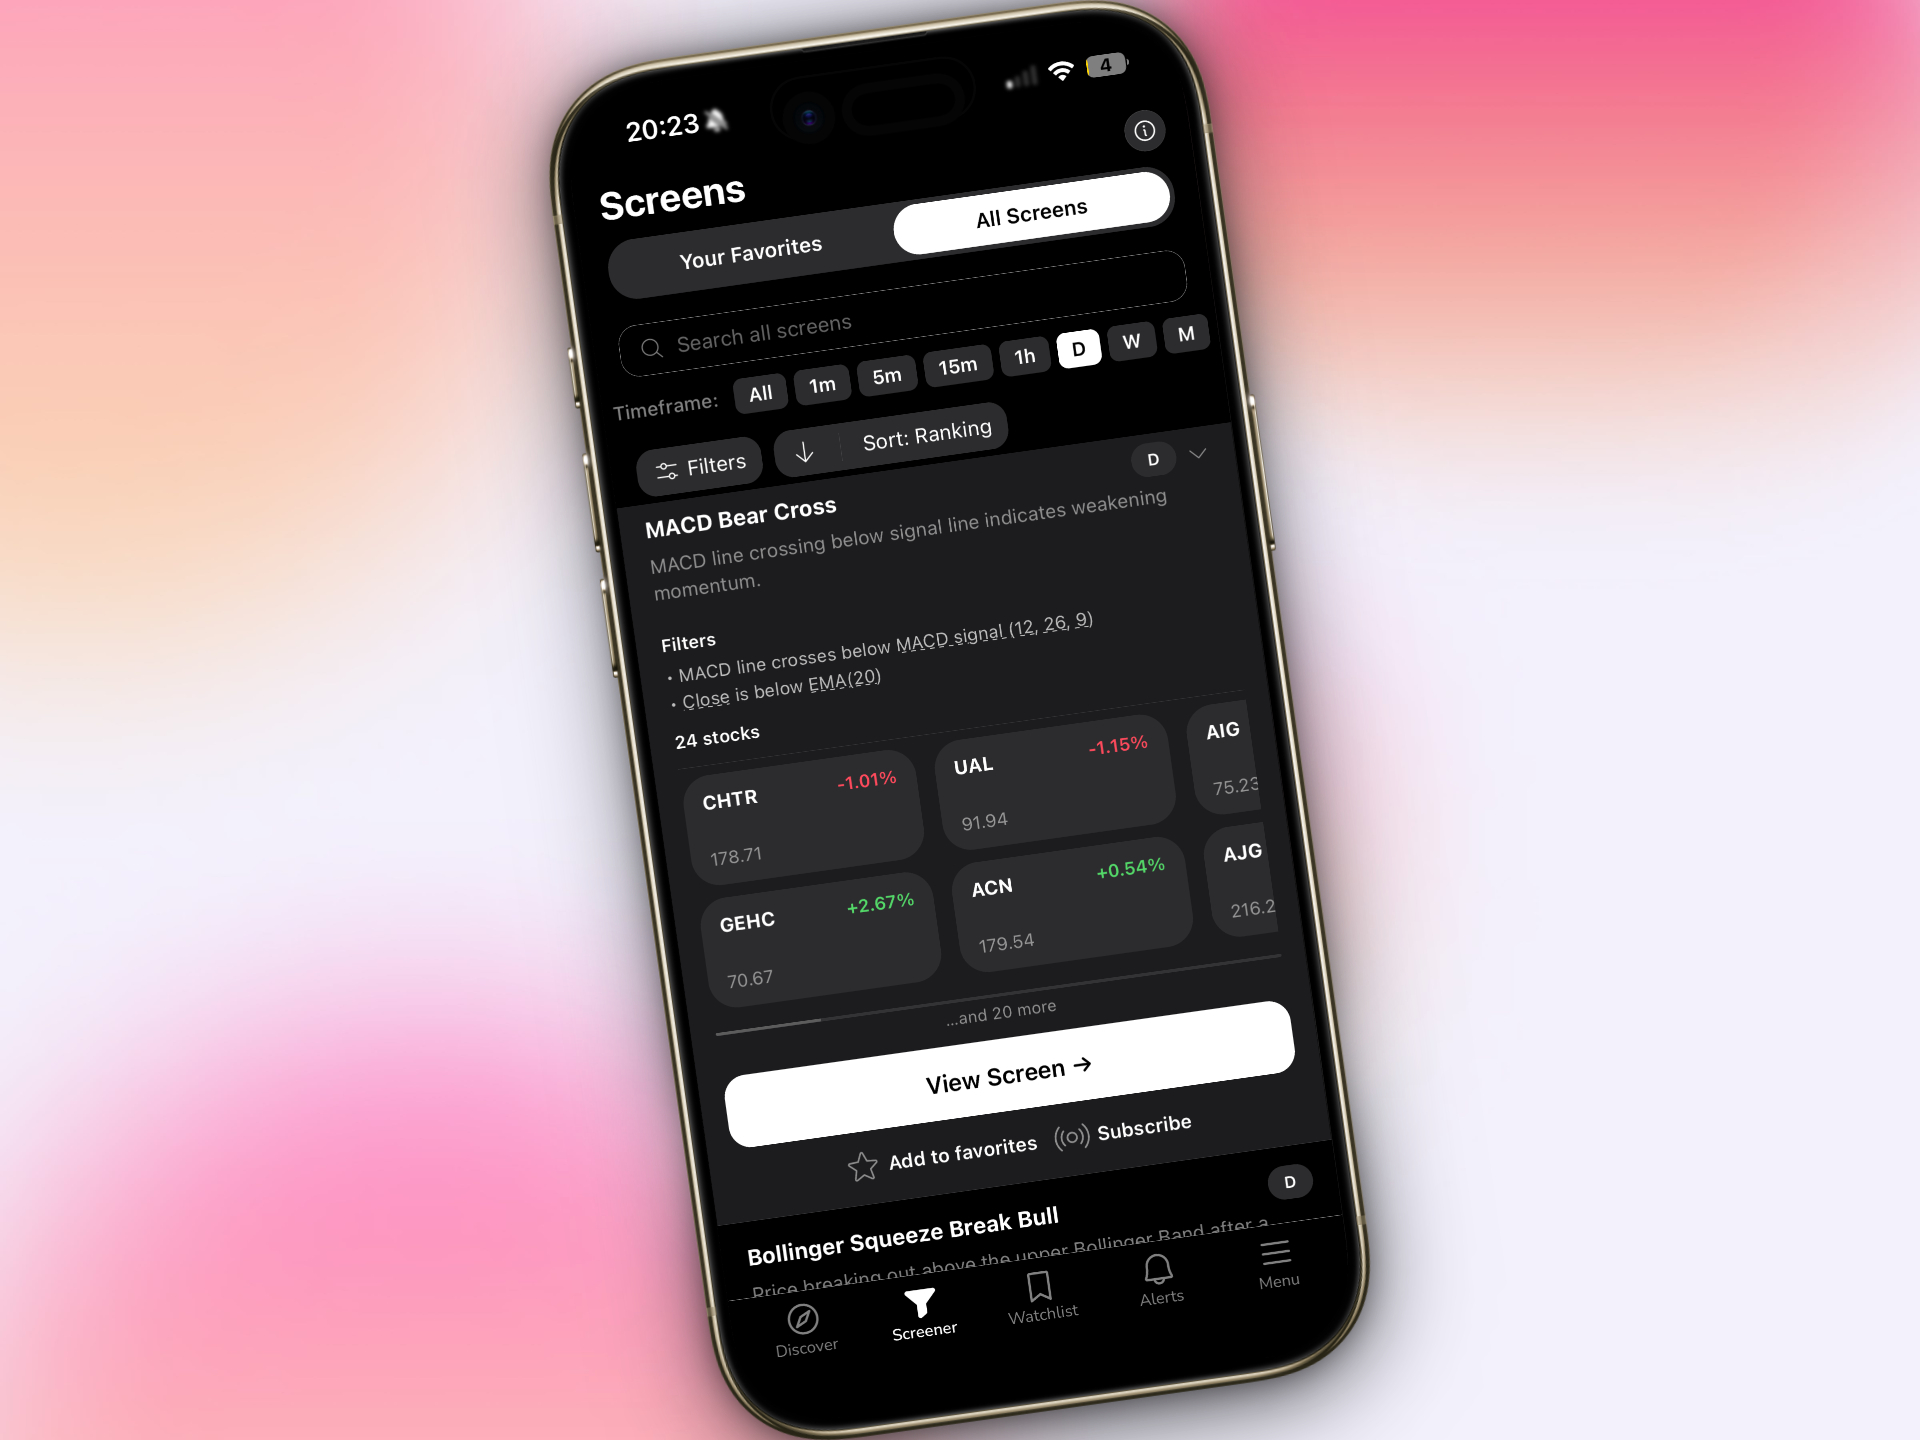
From the Discover feed, move to the Screener tab. Browse the 200+ curated technical screens and open the ones that match your current market thesis. If you're looking for momentum names, open the breakout screens. If the market has been choppy and you're hunting for mean-reversion plays, open the RSI oversold screens. Each screen shows you every stock in the 500+ US equity universe that currently matches that rule.
Add 3 to 5 names to your watchlist. Not 30. The temptation to add everything interesting is real, but a watchlist of 30 names is functionally the same as no watchlist. You can't track 30 setups with 30 minutes a day. Pick the ones with the clearest setup, the strongest backtested metrics, and the most logical risk/reward. Then set alerts on those tickers.
When you walk out the door, you should be able to answer three questions without looking at your phone: What am I watching? What does the entry look like? Where does the trade stop being valid?
Phase 2: The Midday Ping (Under 2 Minutes, If It Fires)
You don't check the market at noon. The market checks in with you.
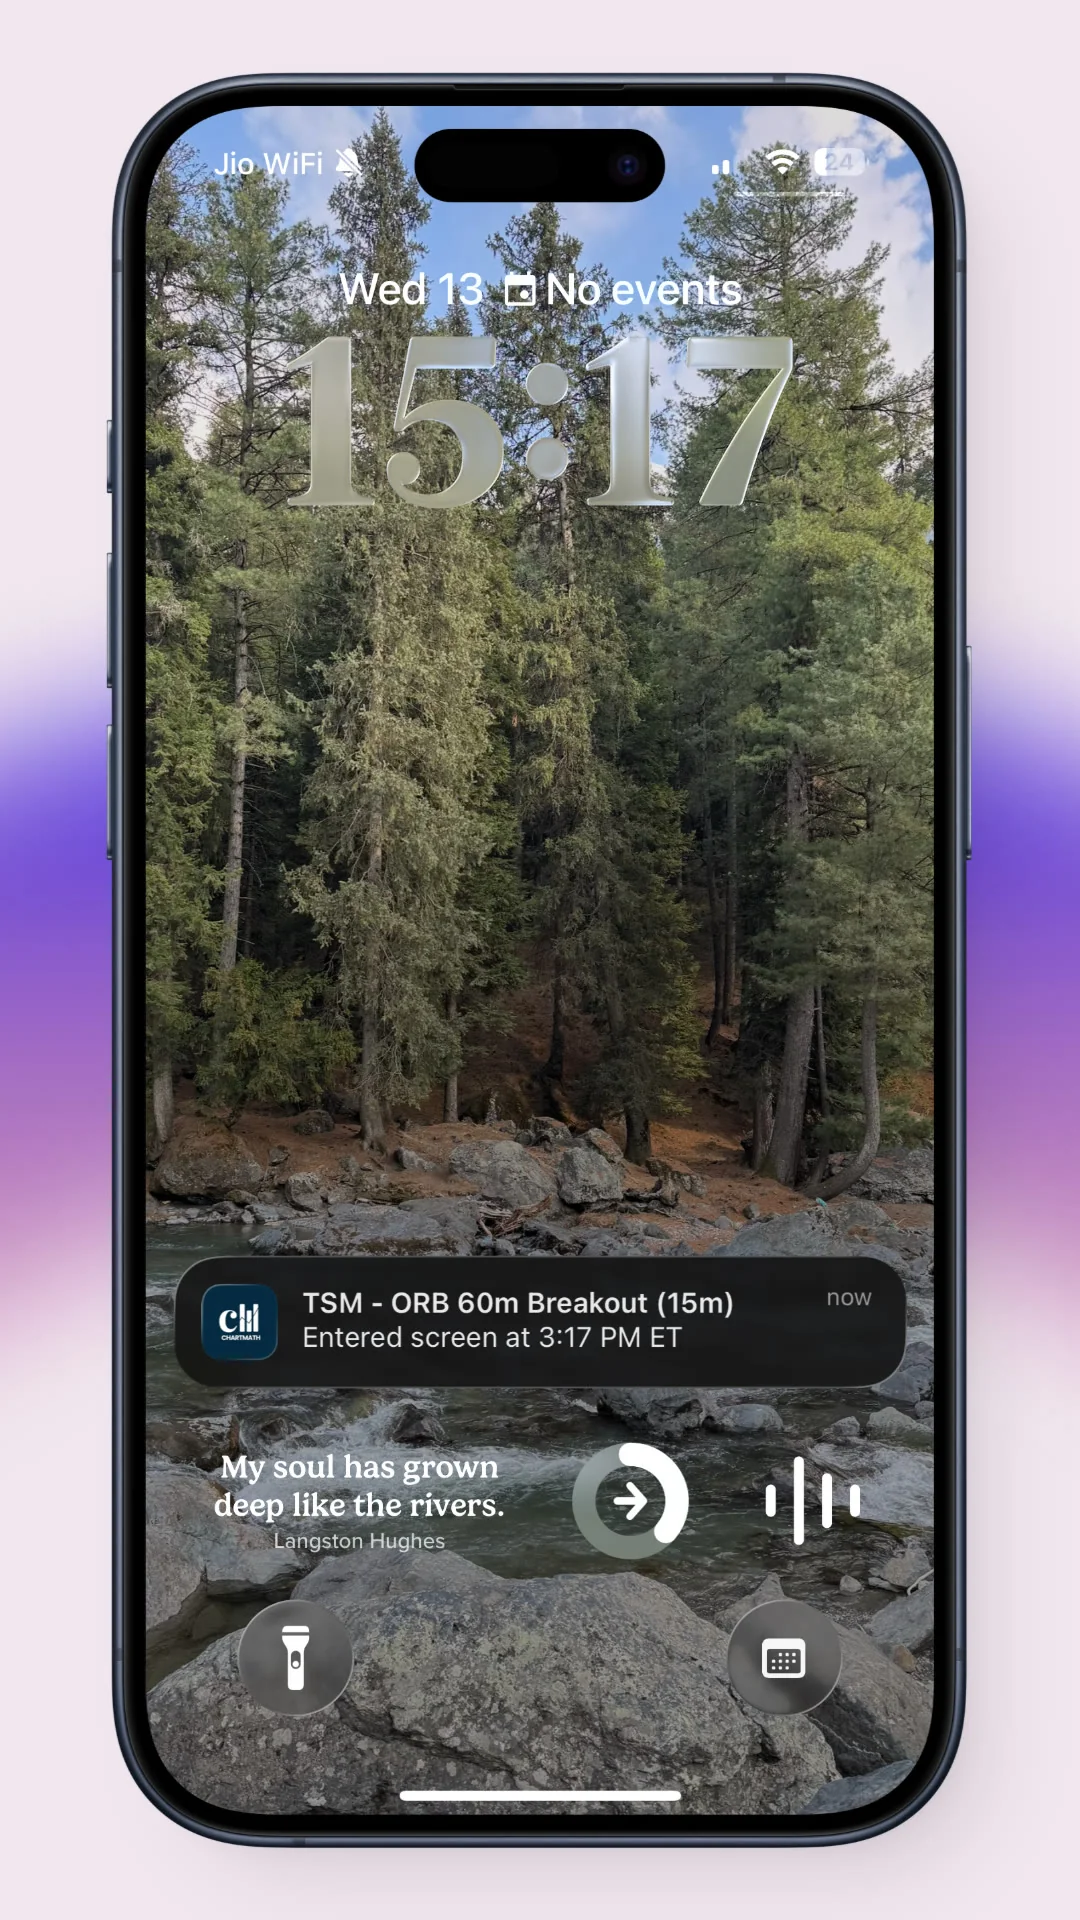
This is the structural shift that makes part-time trading workable. Instead of you monitoring the market, you set up alerts that monitor it for you. ChartMath sends push notifications and emails the moment a ticker enters a screen you've favorited or added to your watchlist. The alert payload carries the ticker, the timeframe, the screen name, a plain-English explanation of why it fired, and a deep link back into the app.
When your phone buzzes at 11:15 AM, the decision tree is short. Does this match what I prepped this morning? If yes, open your broker and execute. If no, put the phone down. That's it. The alert is not a recommendation to trade. It's a notification that something you already decided was worth watching has done something worth looking at.
Why Alert Hygiene Matters More Than Alert Volume
The biggest mistake traders make with alerts is treating more as better. A phone that buzzes 40 times a day trains you to ignore it. ChartMath's alert system is built with de-duplication, throttling, per-bar caps, and timezone-aware quiet hours specifically to prevent that. You want alerts that are rare enough to feel meaningful. One alert that fires on a name you prepped is worth more than 40 alerts on names you've never heard of.
For a full breakdown of how to structure alerts without drowning in noise, the post on trading stocks without watching the screen all day covers the alert setup in detail.
The midday phase has a hard rule: if the alert fires on something you didn't prep, you don't trade it. Not today. You can add it to tomorrow's watchlist and do the work tonight. Chasing an alert you haven't researched is how part-time traders blow up accounts, not because the setup is bad, but because they haven't thought through the risk.
Phase 3: The End-of-Day Review (10 Minutes, After Market Close)
The close is where you do the accounting and set up tomorrow. Ten minutes, no more.
First, review what happened. Did your prepped setups trigger? If yes, did you act? If you acted, was the execution clean? If a setup triggered and you missed it, note why, was it the alert, the timing, or the position size that stopped you? This isn't self-criticism. It's data collection.
Second, check the Discover feed for new setups forming on the daily timeframe. The end of the trading day is when daily candles close, which means new screens fire. A stock that spent the day building a base might have just printed a clean close above resistance. That's a setup for tomorrow, not today.
Third, update your watchlist. Remove names that broke down or hit their stop. Add the new names you found in the Discover feed. Keep the list tight. The goal is to walk into tomorrow's premarket scan with a clean slate, not a graveyard of stale setups.
The end-of-day review is also where you build your edge over time. Traders who log which screens produced and which didn't, over weeks and months, develop a calibrated sense of which setups work in which market conditions. That's not something you can buy. It's something you build by showing up consistently with a system.
What Makes a Screen Worth Trusting?
A screen is a deterministic rule applied to a defined universe of stocks. It either fires or it doesn't. There's no interpretation, no gut feel, no "I think this looks like a breakout." Either the stock meets the criteria or it doesn't.
What separates a trustworthy screen from a random filter is the backtest. Every screen in ChartMath's library has been backtested before it ships. Internal AI agents propose candidate screens; every one is run against historical data before it makes the app. Only screens with a verified Win Rate and Average Return get published. The ones that don't pass don't ship.
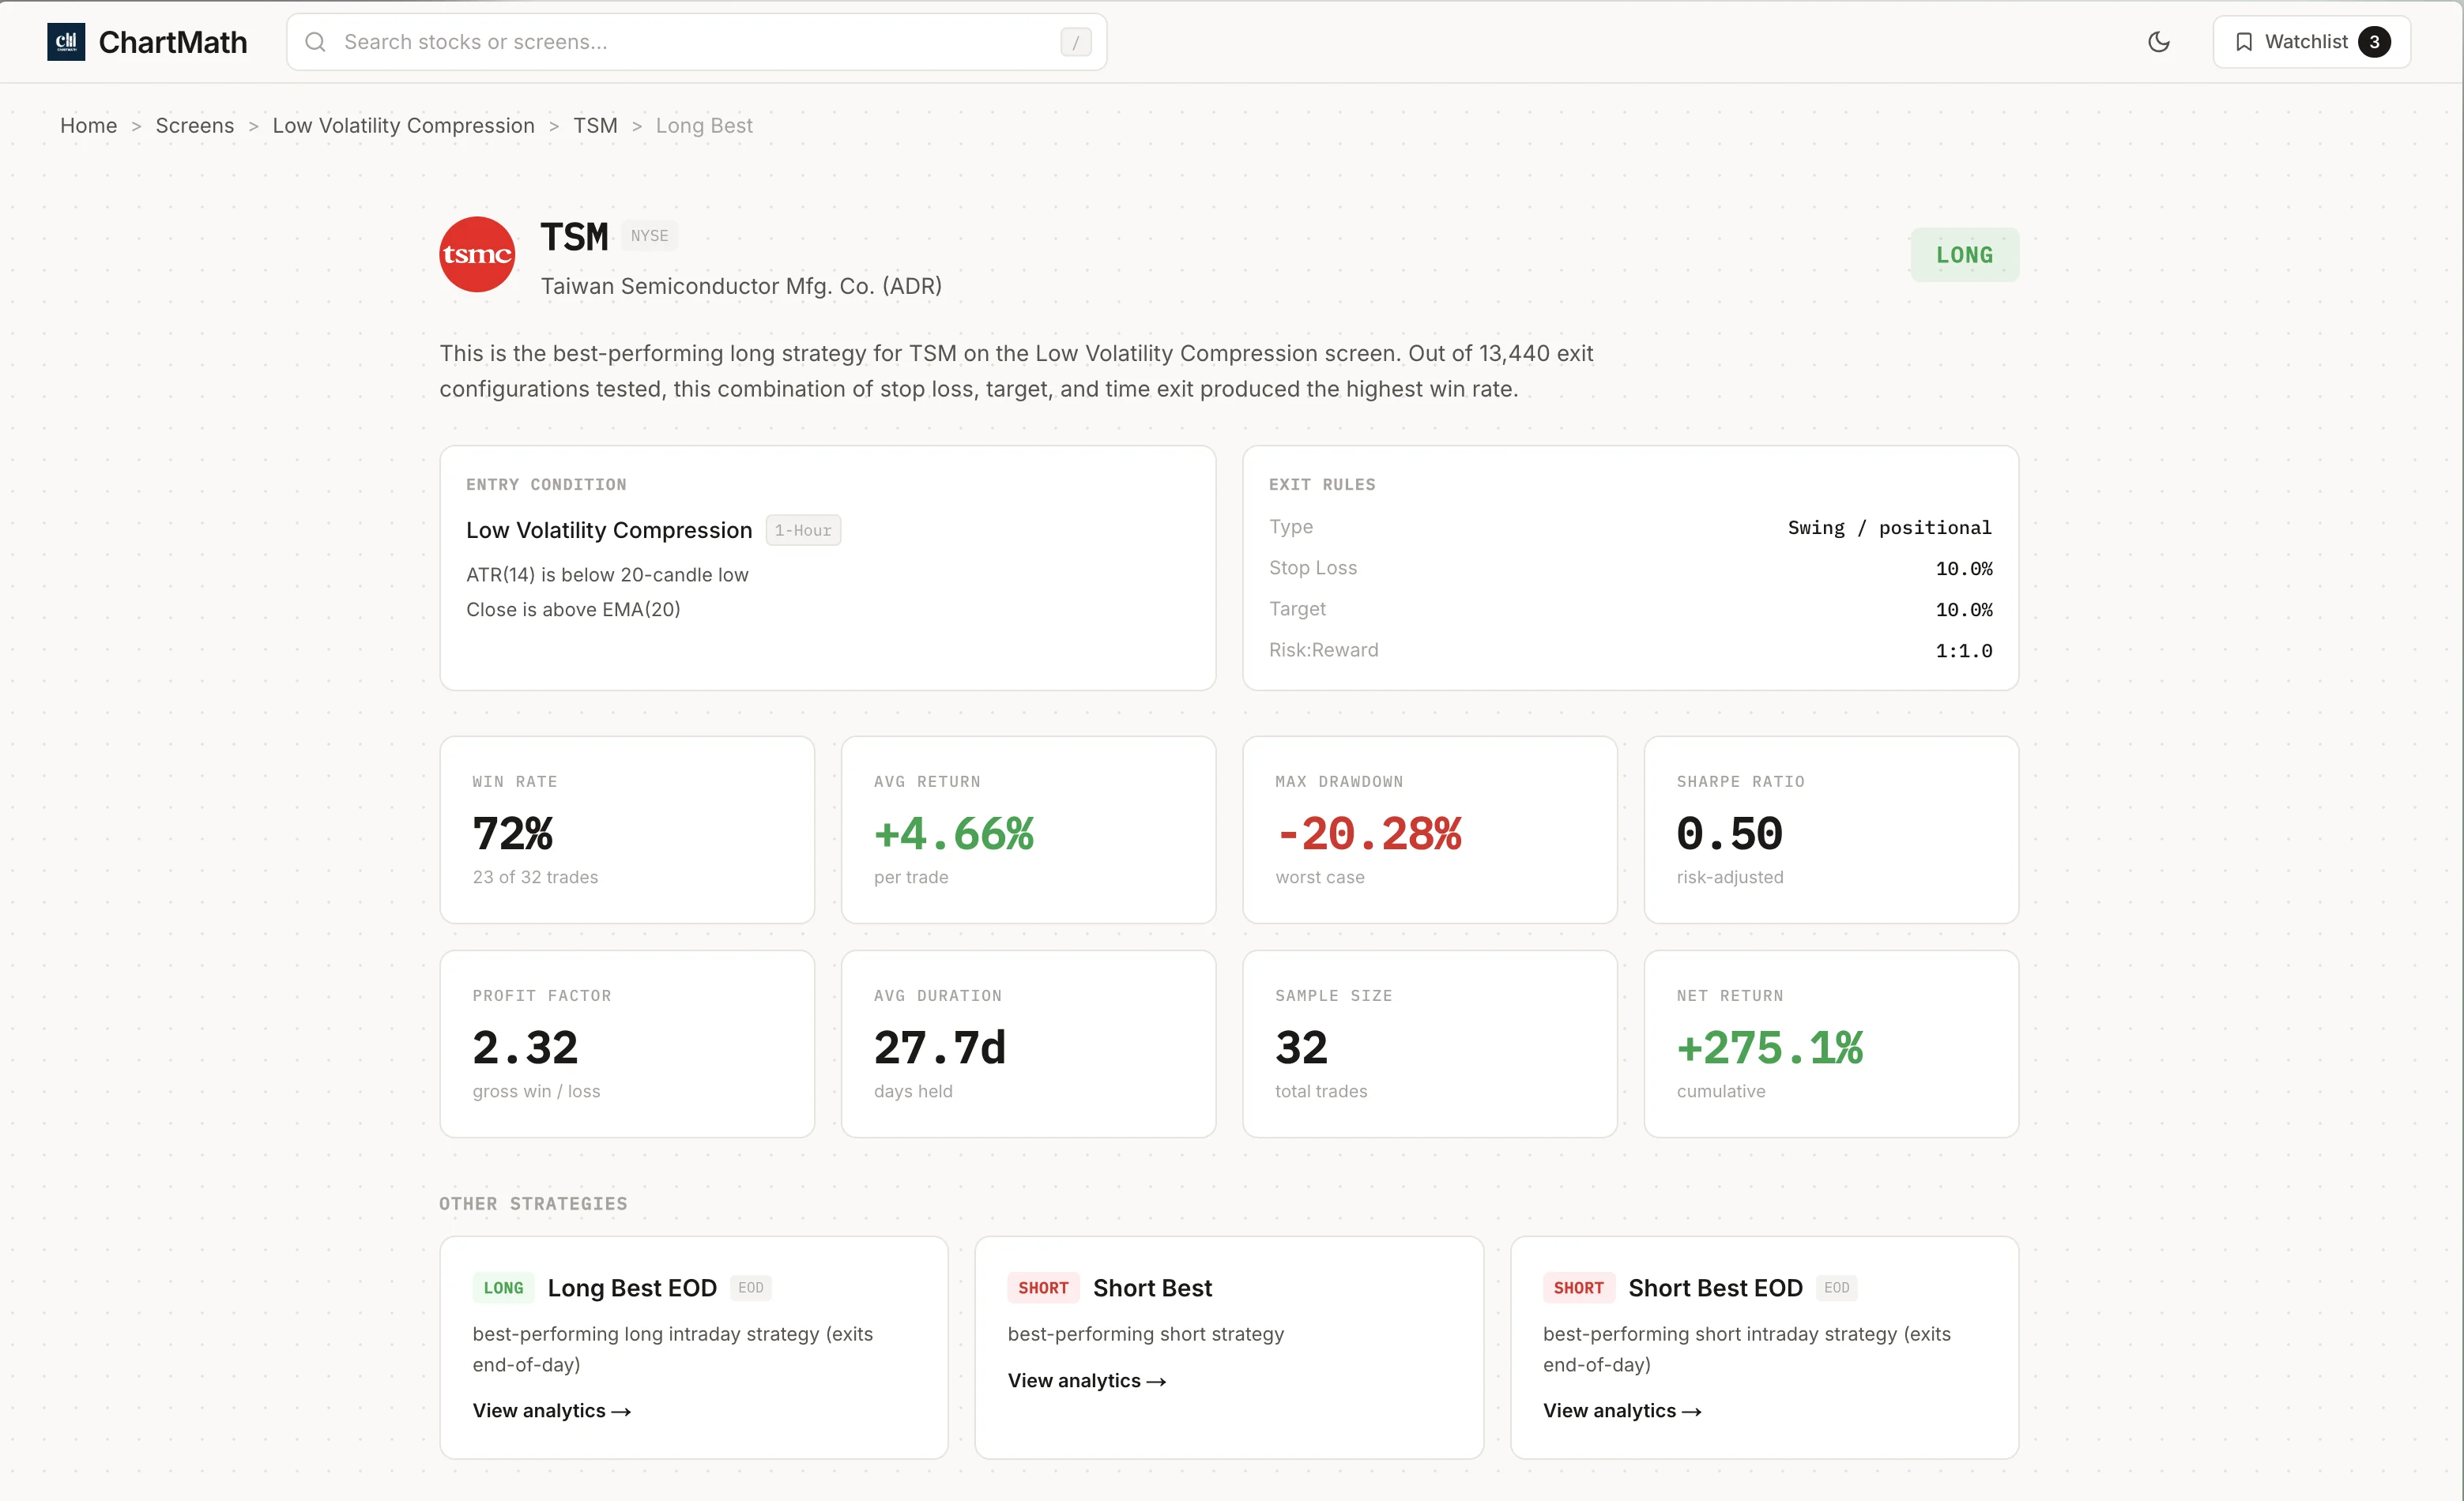
The metrics you care about on each screen are Win Rate, Average Return, sample size, and EV (expected value per trade). Win Rate tells you how often the setup produced a positive outcome historically. Average Return tells you how much, on average, when it worked. Sample size tells you whether those numbers mean anything, a 70% win rate on 12 occurrences is noise; a 62% win rate on 340 occurrences is a signal worth examining. EV combines both into a single number that tells you whether the setup has a positive expected outcome per trade.
What Backtests Don't Tell You
Backtests use bar-close entries with no look-ahead. They don't yet model commissions, slippage, or spread. That means the numbers you see are gross of transaction costs, and real-world results will differ. This isn't a flaw unique to ChartMath, it's a limitation of all retail backtesting tools. The right way to use backtest data is as a filter, not a guarantee. A screen with a strong historical Win Rate and Average Return is worth paying attention to. It is not a promise about what happens next.
For a deeper look at how to read and use backtest data properly, the complete guide to backtesting strategies covers the methodology in detail.
The contrast with Discord signal groups is worth naming directly. A signal group gives you a ticker and a price target, usually with no historical context and no stated criteria for why the setup was selected. You have no way to evaluate whether the person calling it has any edge, or whether the setup has ever worked historically. A backtested screen gives you a rule, a universe, a sample size, and a documented outcome distribution. Those are not the same thing.
The 200+ Screen Library
ChartMath's screener covers 200+ curated technical screens across 500+ US equities, 100 crypto pairs, and 11 US futures, across 7 timeframes from 1-minute to monthly. The screens span breakout patterns, momentum setups, mean-reversion plays, volume-based signals, and more. You don't build them. You browse them, pick the ones that match your style, and let the scanner run them continuously.
You can browse the full library at chartmath.com/screens without signing in. It's a useful way to understand what's available before you commit to a routine.
For traders who want to understand specific setups like VWAP reclaims or volume-based signals, the posts on VWAP trading and RVOL and volume spikes are worth reading alongside the screen library.
The Sunday Setup: Your Weekly 15-Minute Review
Weekly timeframe setups are where part-time traders have a structural advantage over full-time day traders. A weekly candle takes five days to form. The entry window is measured in days, not minutes. You have time to see it, research it, size it properly, and set an alert for the entry.
The Sunday routine is simple. Open ChartMath's Screener tab and filter for weekly and daily timeframe screens. Look for names that are forming setups, consolidations near resistance, volume compressions, RSI resets on strong names. Add the best 5 to 10 to your watchlist for the week. Set alerts. Close the app.
That's it. You've just done the work that most part-time traders try to do every morning in a panic. By doing it Sunday, you walk into Monday's premarket scan with a pre-built context. The morning scan becomes a confirmation exercise, not a discovery exercise.
The Sunday review is also where you look back at the previous week. Which screens fired? Which ones produced? Which ones didn't? Over time, this review builds a personal filter on top of the 200+ available screens, you start to know which setups work in trending markets versus choppy ones, which timeframes suit your execution style, and which risk/reward profiles fit your account size.
That compounding of process knowledge is the real edge in part-time trading. It doesn't come from finding a magic screen. It comes from running a consistent system long enough to understand it.
Common Mistakes Part-Time Traders Make (And How to Fix Them)
The routine above sounds straightforward. In practice, most traders undermine it in predictable ways. Here are the five most common failure modes and the specific fix for each.
1. Watching Too Many Tickers
A watchlist of 40 names is not a watchlist. It's a list of things you're vaguely aware of. Cap your active watchlist at 10 to 15 names. If a new setup is compelling enough to add, something else has to come off. Scarcity forces prioritization, and prioritization forces better decisions.
2. Acting on Alerts Without Premarket Context
An alert that fires on a name you didn't prep is not a trade. It's a notification. The right response is to note it for tomorrow's research, not to open your broker and buy. The traders who blow up on alerts are the ones who treat every ping as an instruction. The traders who build accounts treat alerts as a filter on names they've already decided are worth watching.
3. Using the Wrong Timeframe for Your Schedule
If you can't watch a chart for 15 minutes after an entry, you shouldn't be trading the 5-minute timeframe. Part-time traders with day jobs belong on the daily and weekly timeframes for swing setups. The 1-minute and 5-minute screens in ChartMath are real and useful, for traders who can act on them. If you're in a meeting from 9:30 AM to 11 AM, those timeframes are not for you right now.
4. Trusting Screens with Small Sample Sizes
A screen with a 75% win rate on 8 occurrences is not a 75% win rate. It's a sample size problem. Before you size up on any setup, check the sample size. Screens with fewer than 30 to 50 historical occurrences should be treated as exploratory, not as a basis for meaningful position sizing. The Win Rate and Average Return numbers only become reliable when the sample is large enough to smooth out randomness.
5. Skipping Position Sizing
The most common way part-time traders lose money isn't picking bad setups. It's sizing them wrong. A great setup in the wrong size is still a bad trade, either too small to matter or large enough to do real damage when it doesn't work. The standard framework is to risk 1 to 2% of your account per trade, defined by the distance from your entry to your stop. That math should happen before you place the order, not after.
The full system post for swing trading with a day job covers position sizing and risk management in more detail if you want to go deeper on that piece.
Run This on Your Own Tickers
The routine above is not theoretical. It's a description of how traders with real jobs and real constraints are using systematic, backtested screening to stay competitive without being glued to a screen.
The starting point is simple. Download the ChartMath app on iOS or Android, open the Discover feed, and swipe through today's setups. Each card tells you the screen, the timeframe, the Win Rate, the Average Return, and why the setup triggered. You don't need to build anything. You don't need to write a line of code. You pick from 200+ ready-made screens and let the scanner run them on 500+ US equities continuously.
If you want to explore the screen library before downloading, browse it on the web. The web layer is anonymous and read-only, no sign-in required. You can see every screen, understand what it's looking for, and decide which ones match your style before you commit to anything.
ChartMath is in open beta, with the full screen library, backtests, and alerts open while the platform is early. Paid plans come later, and traders who join during beta keep founding pricing when they do.
The 30-minute routine is a starting point, not a ceiling. Most traders who stick with it for a few weeks find they're spending less time on trading, not more, because the system handles the scanning, the alerting, and the filtering. What's left is the part only you can do: the judgment call on whether to pull the trigger, and the discipline to size it right when you do.
ChartMath is a copilot, not autopilot. It narrows the field. You keep the call.
Start with the Discover feed. Swipe through a few setups. Check the Win Rate and Average Return on the ones that catch your eye. See if the plain-English explanation matches what you see on the chart. That's the whole workflow in miniature, and it takes about three minutes to run the first time.
Get the app on iOS or Android and run it on your own tickers this week.

Ankush Jindal
LinkedInSee these setups live in ChartMath
200+ curated screens with backtest data. 14-day free trial.