What Is a Stock Screener That Finds Trades for You?
Spend an afternoon on any trading forum and you'll find the same frustrated post, written a thousand different ways: "I had the setup on my list. I just wasn't watching when it triggered." That's not a strategy problem. That's a tools problem — specifically, the difference between a screener you have to go use and one that comes to find you.
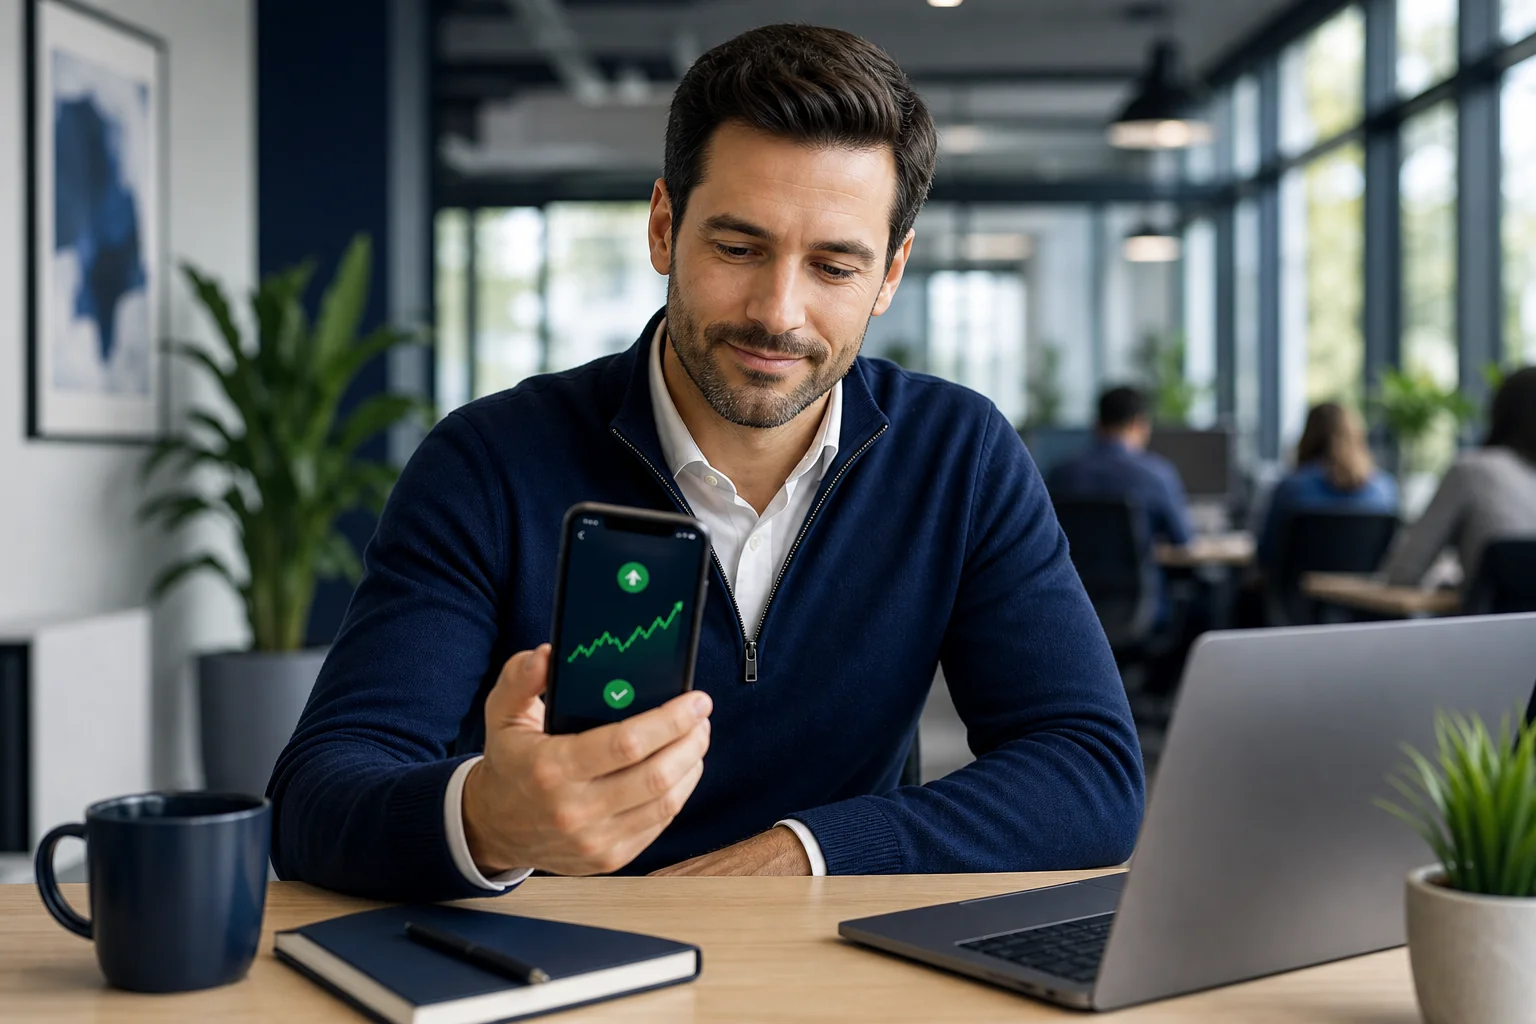
Most stock screeners are passive. You open them, punch in your filters, and scroll through results. That works fine if you have six hours a day to sit in front of charts. For everyone else — the swing trader with a day job, the part-time trader who checks their phone between meetings — a passive screener is a tool that mostly tells you what you already missed.
A stock screener that finds trades for you works the other way around. It scans continuously, matches setups against backtested criteria, and pushes a notification to your phone the moment something qualifies. You don't go looking. The scanner does the hunting, and you decide what to do with what it finds.
This guide breaks down exactly how that model works, what separates a useful alert from noise, and what to look for when you're evaluating any proactive trade-discovery tool.
The Difference Between a Screener You Use and One That Works for You
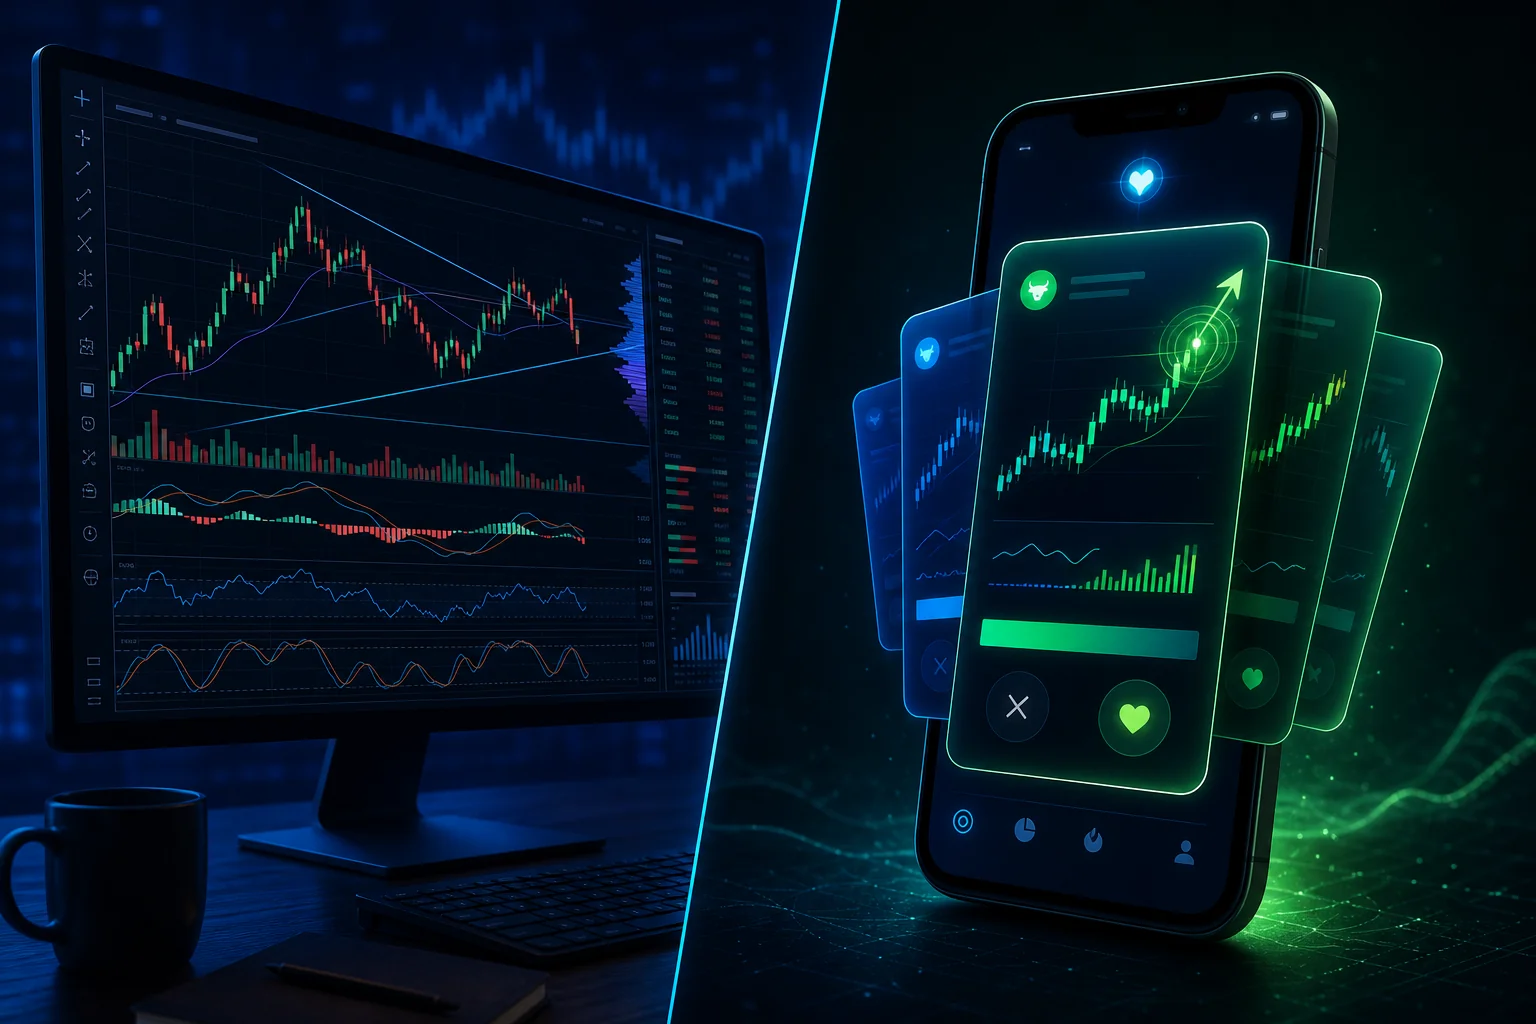
Traditional screeners, Finviz, basic TradingView filters, most broker-built tools, are built around a pull model. You decide when to look, you set the filters, and you retrieve results. The screener is a search engine. You are the one doing the searching.
That model has a structural flaw for anyone who isn't watching markets full-time: the market doesn't wait for you to open your laptop. A breakout that triggers at 10:43 AM on a Wednesday doesn't care that you're in a budget review. By the time you sit down at 5:30 PM and run your filters, the move is already priced in, the risk/reward has shifted, and the entry you planned is gone.
A proactive trade-discovery scanner flips the model from pull to push. Instead of waiting for you to query it, it runs continuously in the background, scanning a defined universe of instruments against a library of pre-built technical screens. The moment a stock matches a setup, it fires an alert to your phone. You get the notification. You decide whether to act.
The practical difference is significant. With a passive screener, your trading is limited to the windows when you can actively monitor markets. With a proactive scanner, your coverage window is essentially always-on, even when you're not. That's the core value proposition for traders who can't watch screens all day.
How a Proactive Trade-Discovery Scanner Actually Works
The mechanics behind a proactive scanner are worth understanding, because they explain why some tools deliver genuinely useful alerts while others just generate noise.
A Curated Universe, Not the Entire Market
The first design decision is scope. Scanning every publicly traded instrument in real time is computationally expensive and practically useless, most of what trades on any given day is irrelevant to a systematic swing trader. Good proactive scanners work from a curated universe: a defined set of instruments selected for liquidity, relevance, and tradability.
ChartMath, for example, scans 500+ US equities, 100 crypto pairs, and 11 US futures. That's a deliberate choice. It's broad enough to surface real opportunities across different market conditions, but focused enough that every instrument in the universe is one a retail trader can actually execute on. The universe is not "the entire market", it's a curated set built around the instruments that matter most to the target trader.
Pre-Built Technical Screens
The second component is the screen library. Each screen defines a specific technical setup: a combination of indicators, price action conditions, volume criteria, and timeframe parameters that together describe a recognizable, repeatable pattern. When a stock in the universe matches all the conditions in a screen, it's a hit.
The key distinction between a proactive scanner and a basic alert is the quality of the screen definition. A basic price alert fires when a stock crosses $50. A technical screen fires when a stock clears a six-week base on elevated relative volume while reclaiming a key moving average on the daily chart. The second alert carries far more information and far more edge.
ChartMath ships with 200+ curated, read-only technical screens covering momentum, breakouts, VWAP setups, volume patterns, and more, across 7 timeframes from 1-minute to monthly. There's no screen builder and no Pine Script required. The screens are pre-built and ready to use. For a deeper look at what that library covers, the full breakdown of ChartMath's ready-made screens is worth reading.
Backtesting: How a Screen Earns Its Place
Pre-built screens are only as good as their historical performance. A screen that fires constantly but rarely leads to a profitable trade isn't a signal, it's noise with extra steps. This is where backtesting becomes the quality filter.
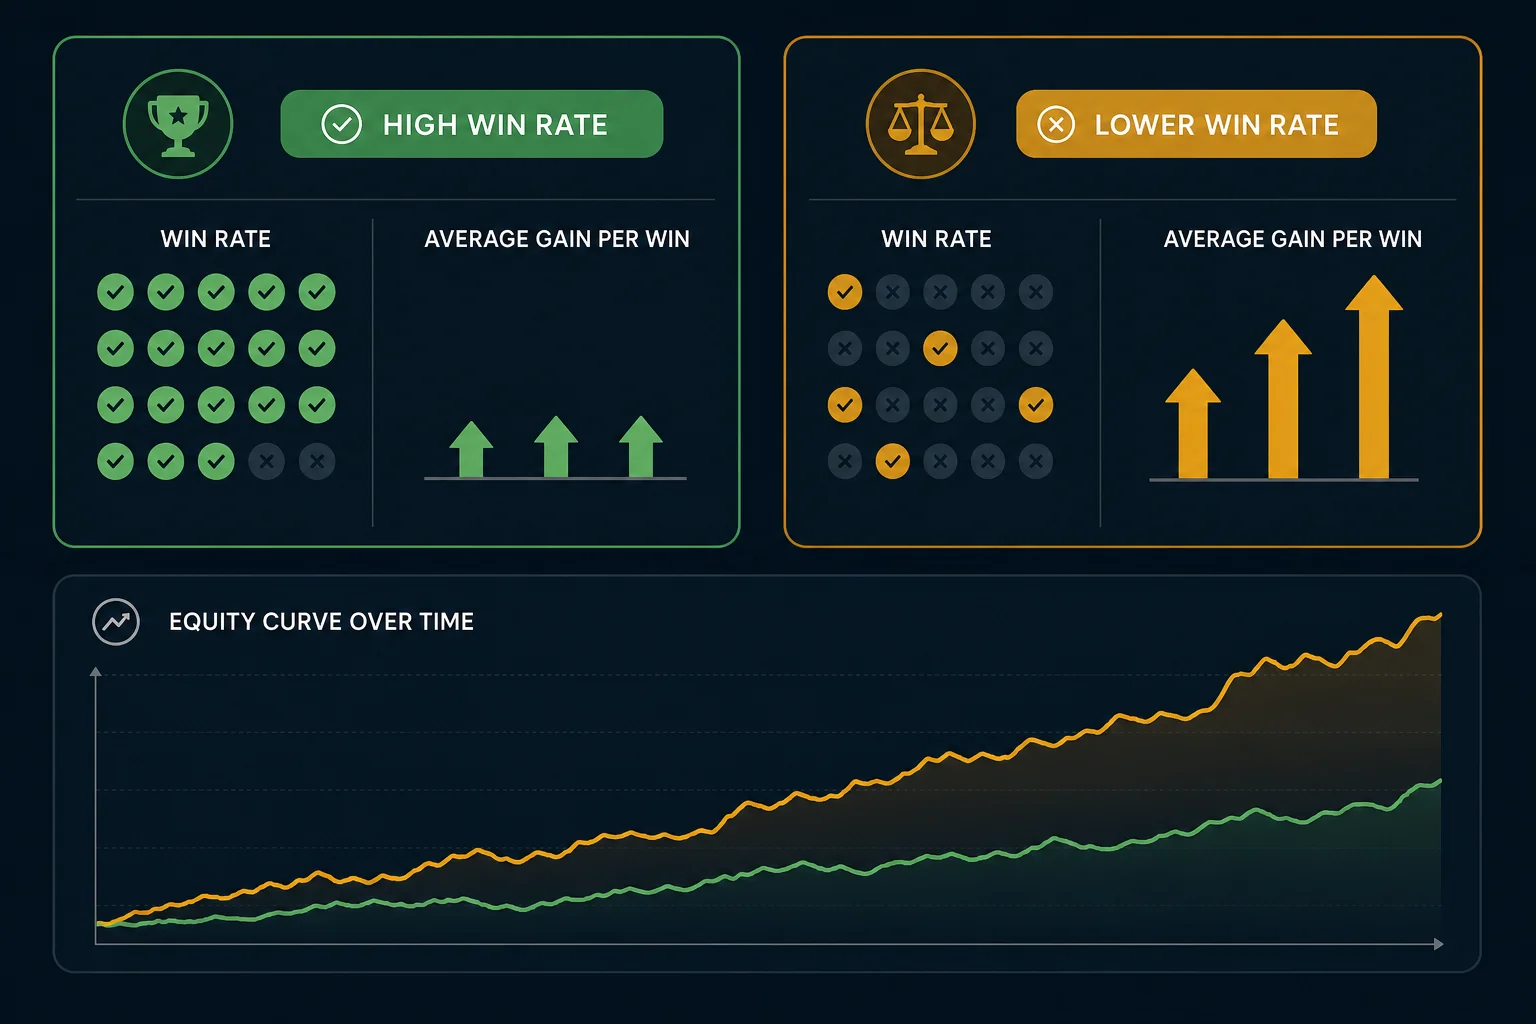
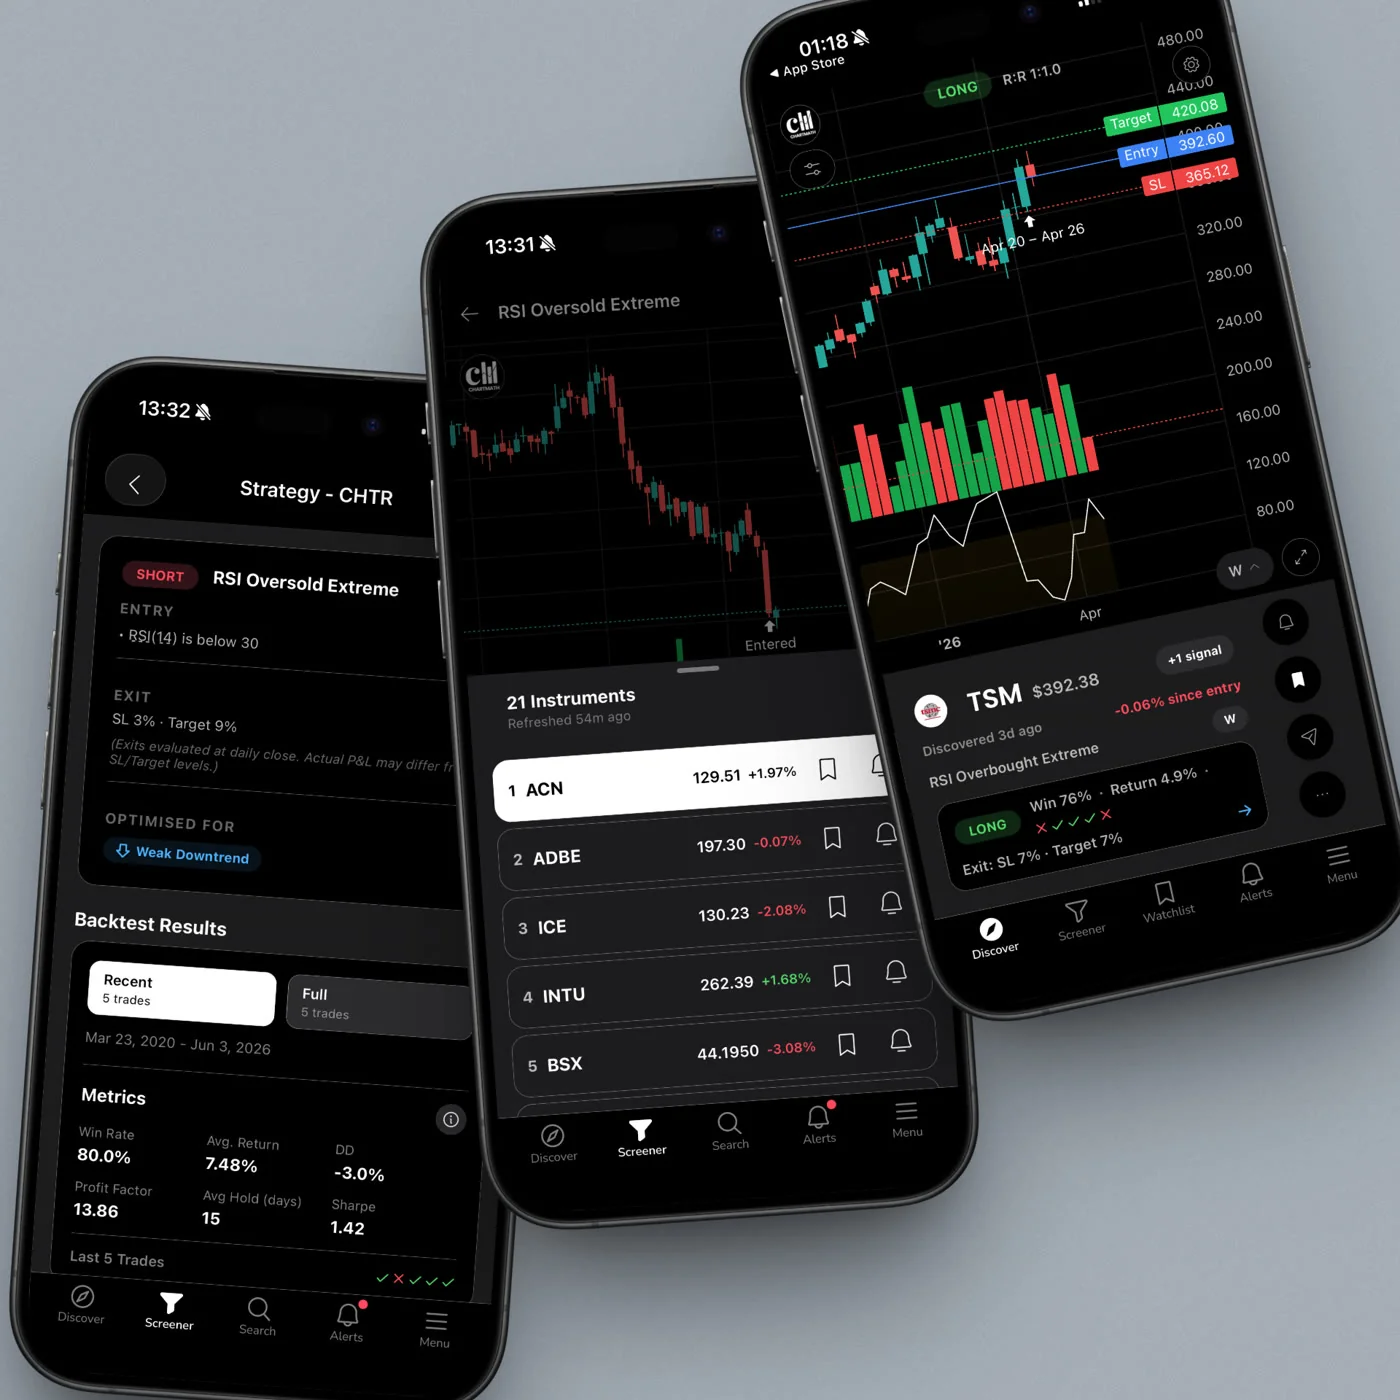
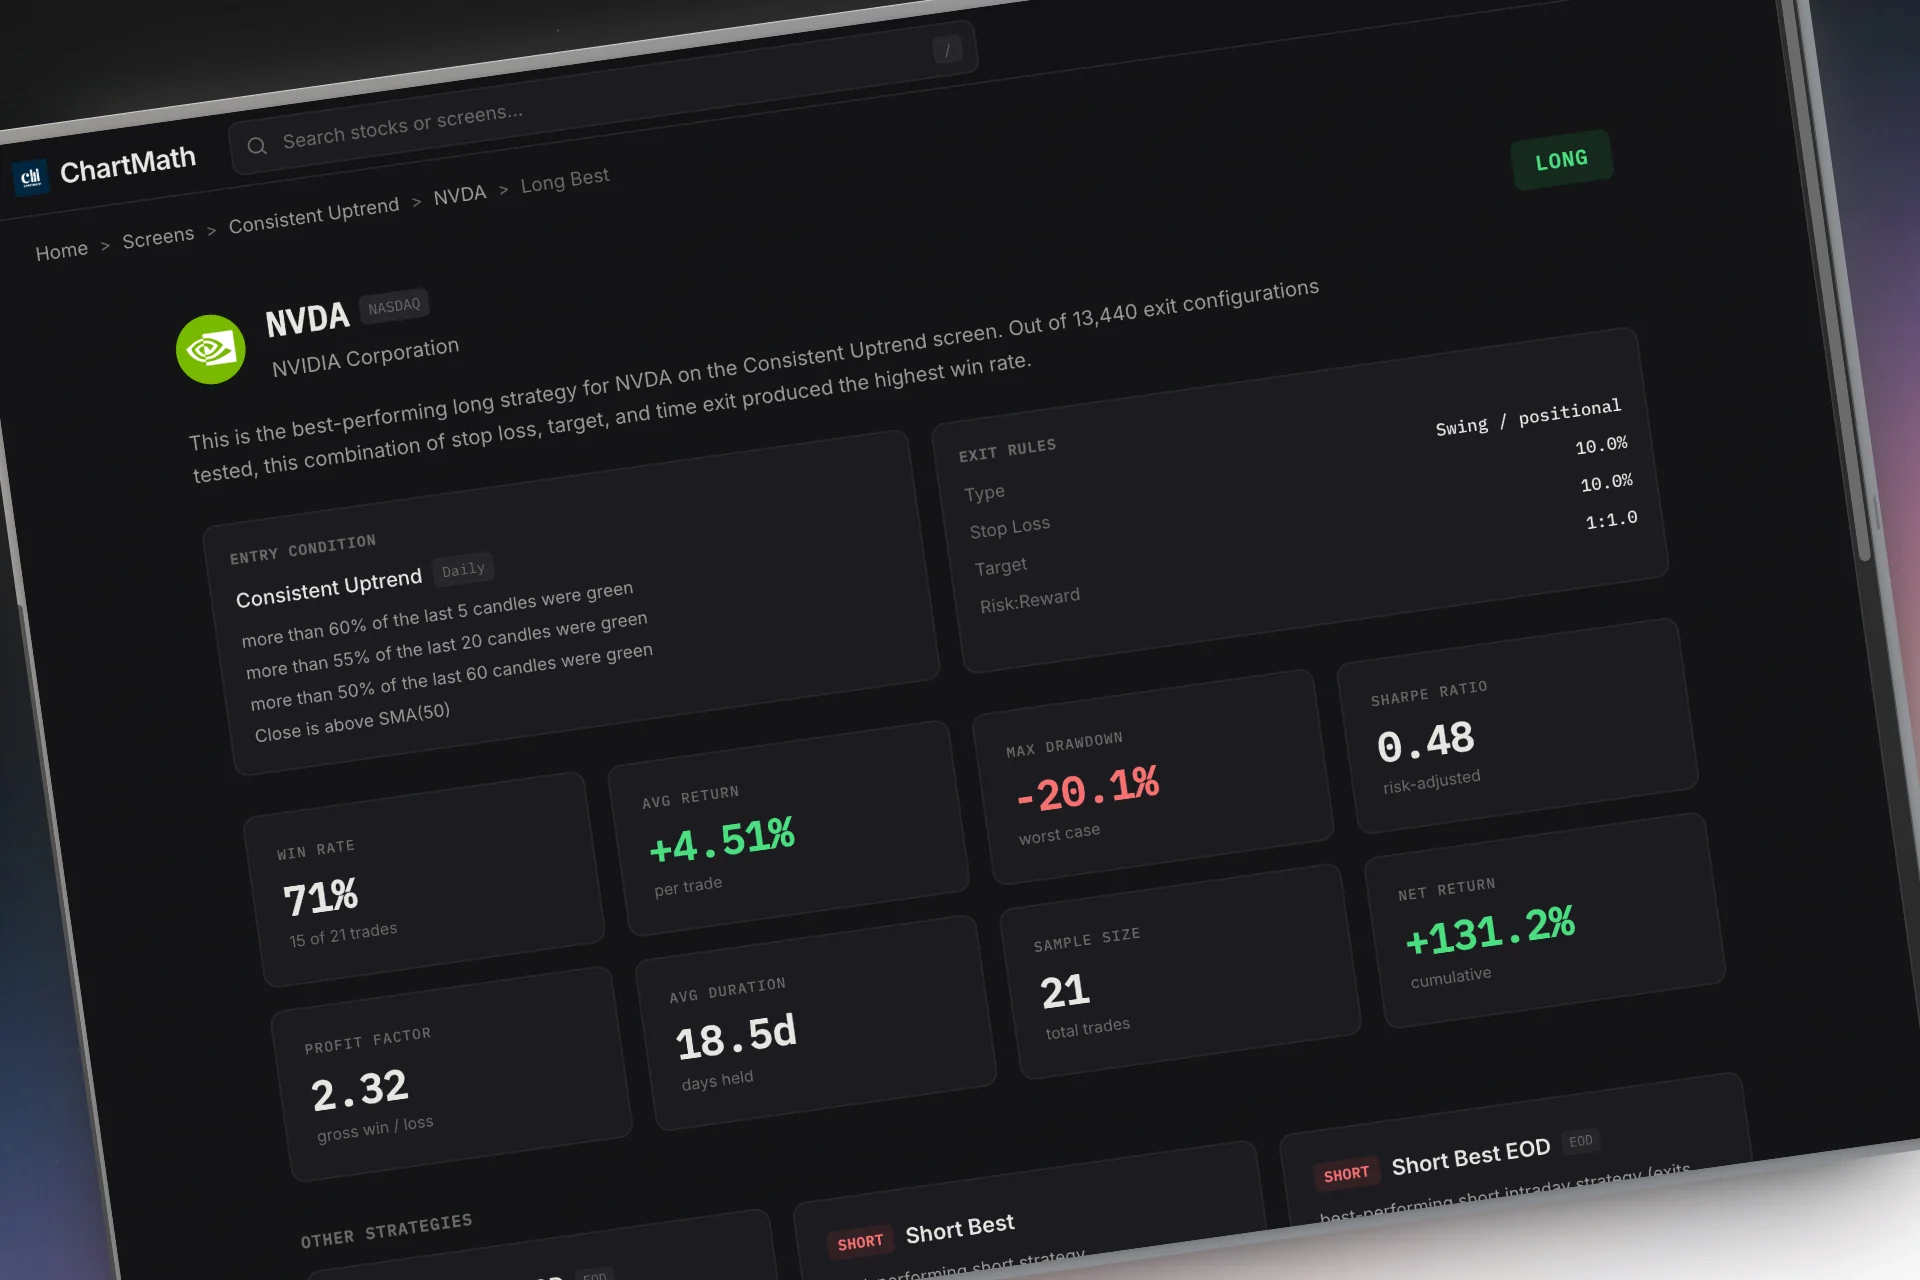
Every screen in a well-designed proactive scanner should be backtested against historical data before it's made available to users. The backtest answers a simple question: when this setup has triggered in the past, what happened next? The output is a Win Rate (how often the trade moved in the expected direction) and an Average Return (how much it moved, on average, when it did). Those two numbers tell you whether a screen has a documented edge, or whether it's just a pattern that looks good on a chart.
ChartMath displays Win Rate and Average Return on every screen card. You can see the historical performance of a setup before you decide whether to act on it. That's a meaningful difference from tools that show you a signal with no context about whether it's ever worked. For a full explanation of how to interpret backtest data, the guide on building and reading backtesting strategies covers the mechanics in detail.
Important note: backtests reflect historical patterns and do not guarantee future results. ChartMath's backtests use bar-close entries with no look-ahead bias, but they do not model commissions, slippage, or spread. Past performance is not indicative of future results.
The Alert Trigger
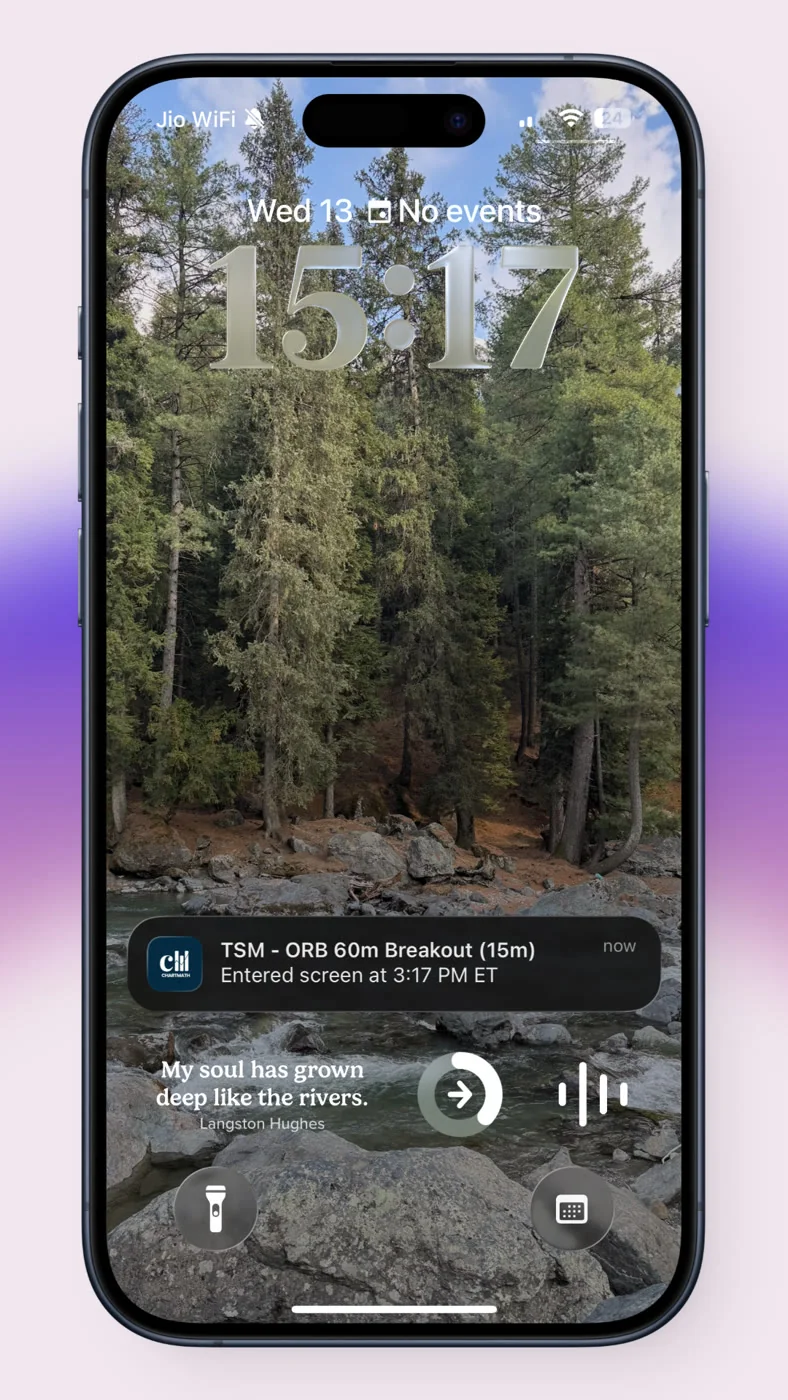
When a stock in the universe matches a screen's conditions, the scanner fires an alert. On a well-designed system, that alert carries more than just a ticker symbol. It includes the timeframe, the screen name, a plain-English explanation of why the setup triggered, a timestamp, and a deep link back to the relevant card in the app.
That plain-English explanation is what separates a useful alert from a cryptic ping. "AAPL entered the VWAP Reclaim screen on the 15-minute chart" tells you what happened and why it might matter. A bare price alert just tells you a number was crossed. The explanation is what lets you make a fast, informed decision about whether to look further, especially when you're between meetings and have 90 seconds to evaluate.
What Makes a High-Signal Alert vs. Pure Noise
Alert fatigue is real, and it's one of the most common reasons traders abandon screeners. A tool that fires 200 alerts a day trains you to ignore it. A tool that fires 5 well-reasoned alerts a day trains you to pay attention. The difference comes down to a few specific design choices.
Backtested Quality Filters
The most important filter is the one applied before an alert ever fires: only screens with a documented historical edge should be in the library. If a screen has a low Win Rate and a poor Average Return across a meaningful sample size, it shouldn't be surfacing alerts. Backtesting is the gatekeeper that keeps low-quality setups out of the feed.
ChartMath's internal process runs AI-proposed candidate screens through backtesting before they ship. Only screens that clear a verified win-rate threshold make it into the app. That's why the library is 200+ screens rather than thousands, curation is the point.
De-Duplication and Throttling
Even good screens can fire repeatedly on the same instrument in a short window. Without de-duplication, you'd get five alerts on the same stock in the same hour, all technically valid but collectively useless. Smart alert systems de-duplicate by instrument and screen, cap alerts per bar, and throttle repeat notifications so your phone isn't buzzing every three minutes with the same setup.
Timezone-Aware Quiet Hours
A 3:00 AM alert about a crypto setup is not useful to a trader who sleeps. Timezone-aware quiet hours let the system respect your schedule, holding non-urgent alerts until you're actually awake and able to act. This is a small feature with a large quality-of-life impact, and it's one of the things that separates a tool built for real traders from one built to maximize engagement metrics.
Plain-English Reasoning
An alert that tells you why a setup fired is fundamentally more useful than one that doesn't. The reasoning lets you do a fast sanity check: does this make sense given what I know about this stock? Is the context right? Do I want to look further? Without the reasoning, every alert requires you to open a chart from scratch and reconstruct the context yourself. With it, you can make a preliminary judgment in seconds. That's the difference between an alert that helps you trade and one that just adds to your to-do list.
For a deeper look at managing alert quality, the post on avoiding alert fatigue from stock screeners covers the practical fixes in detail.
The Three Surfaces: Discover, Screener, and Alerts
A proactive trade-discovery app typically organizes its functionality around three distinct surfaces, each serving a different part of the trading workflow. Understanding how they fit together helps you use the tool more effectively.
Discover: The Swipe-First Feed
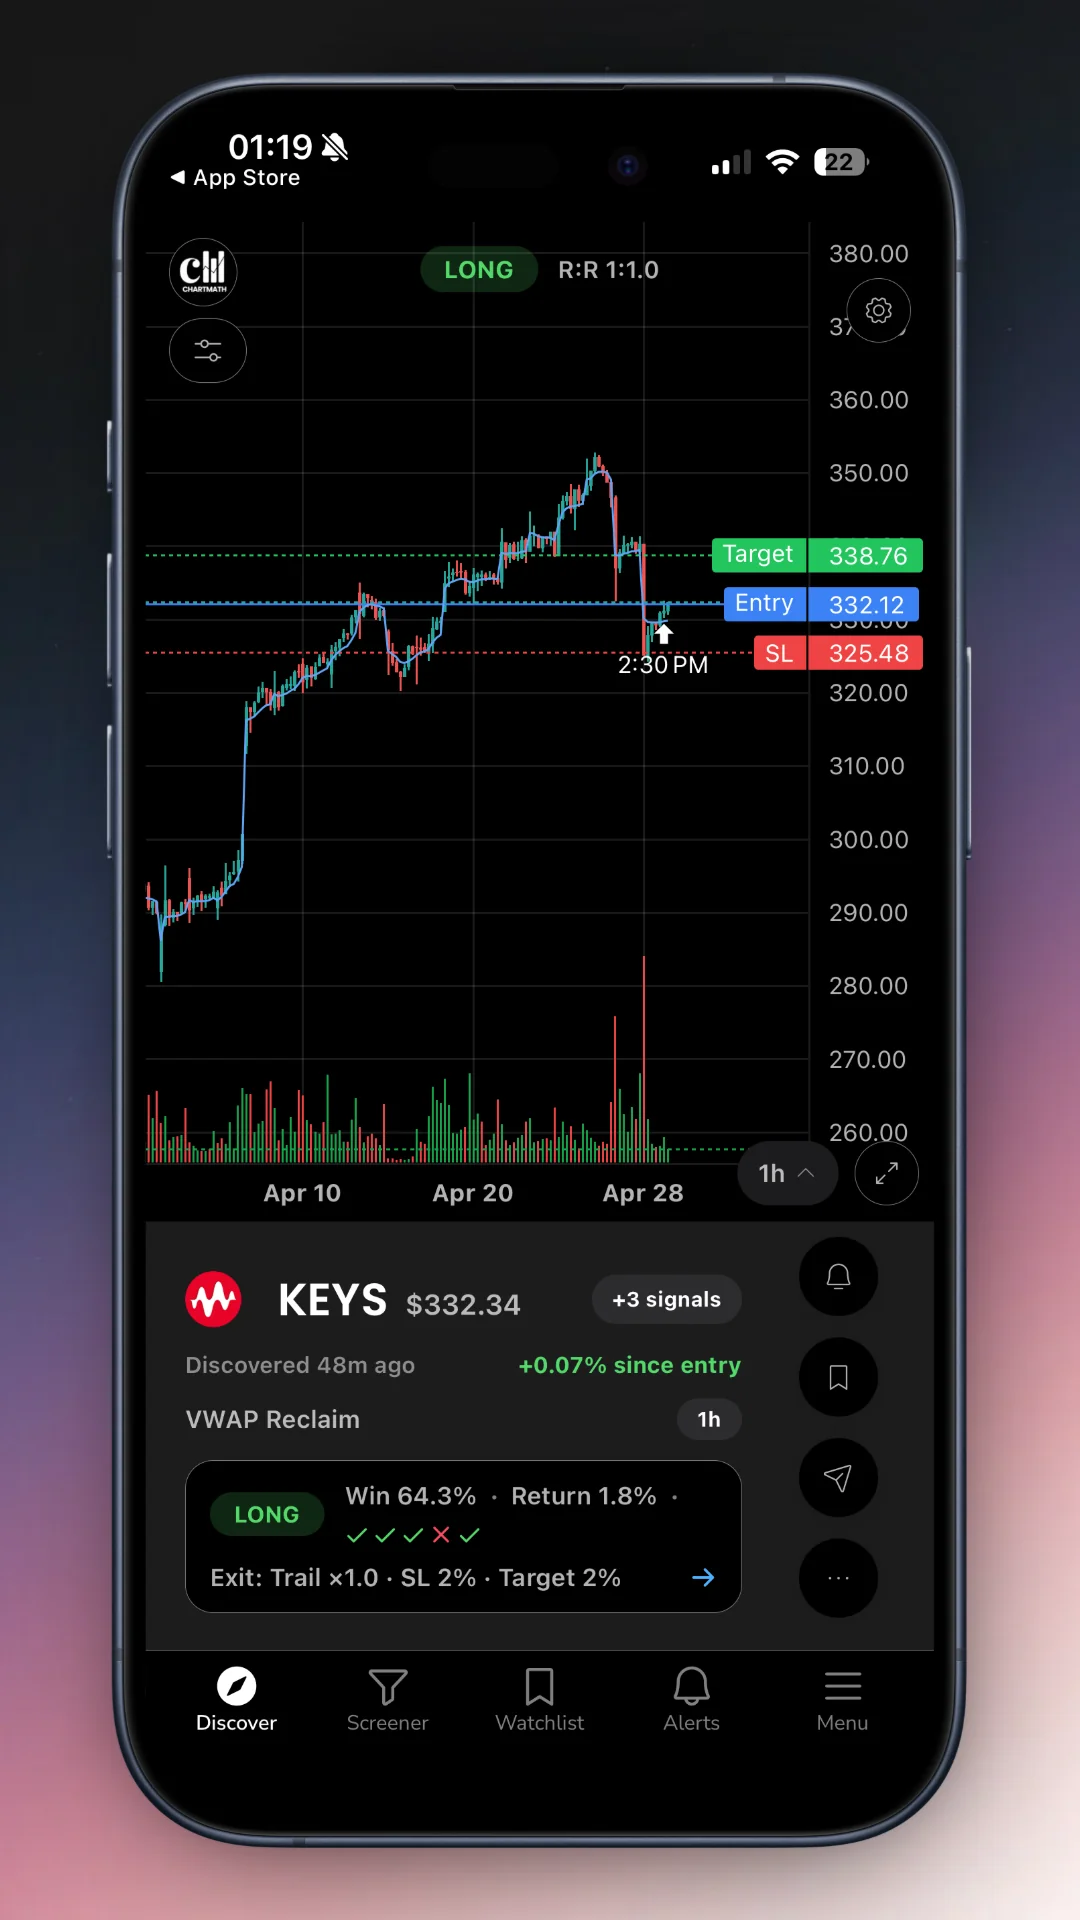
The Discover surface is the signature experience of a proactive scanner. Instead of a table of tickers and numbers, it presents a swipe-first feed of explainable entry cards. Each card represents a specific instrument, on a specific screen, at a specific timeframe. The card explains in plain English why the setup triggered, shows the historical Win Rate and Average Return for that screen, and gives you enough context to decide whether to investigate further.
This is not a social feed. There are no user posts, no community picks, no promoted tickers. Every card in the Discover feed is generated algorithmically, based on what's actually matching a backtested screen right now. The feed is ranked by backtested reliability and recency, so the most actionable setups surface first.
Screener: Browse the Full Library
The Screener surface lets you browse all 200+ curated technical screens by category. Open any screen and you'll see every instrument currently matching it, along with the screen's historical performance metrics. This is useful for traders who want to explore what's setting up across the market right now, or who want to understand what a specific screen looks for before they favorite it.
There's no screen builder here. The screens are read-only and curated. That's a deliberate design choice: it keeps the library focused on setups with documented edge, rather than letting users create and share unvalidated filters. You can browse the full screen library at chartmath.com/screens without even creating an account.
Alerts: Push and Email Notifications
The Alerts surface is where you configure what fires to your phone. ChartMath supports two alert types: screen-enter alerts (which fire when a ticker enters a favorited screen) and symbol-level alerts (which fire when a specific instrument you're watching matches any screen). Alerts go out via push notification and email, no SMS.
Each alert payload carries the ticker, the timeframe, the screen name, a plain-English explanation of why it fired, a timestamp, and a deep link back to the relevant card in the app. When the alert lands on your phone, you have everything you need to make a fast first judgment, without opening a separate charting platform just to understand what happened.
For traders who want to understand how alerts fit into a broader charting workflow, the guide on integrating trading alerts with your charting platform covers the practical setup.
What to Look for in Any Stock Screener That Finds Trades for You
Not every tool that calls itself a proactive scanner actually delivers on the promise. Here's a practical checklist for evaluating any trade-discovery tool before you commit to it.
- Backtested screens with documented Win Rate and Average Return. If a tool can't tell you how a screen has performed historically, you have no basis for trusting its alerts. Win Rate and Average Return are the minimum metrics you should expect to see on every screen.
- Plain-English signal explanations. The alert should tell you why the setup fired, not just that it fired. A ticker symbol and a screen name are not enough context to make a fast, informed decision.
- Mobile-first push alerts. If the tool only sends alerts to a desktop dashboard or a daily email digest, it's not actually proactive for a trader who's away from their desk. Real-time push notifications to your phone are the baseline.
- A curated, manageable universe. Scanning "the entire market" sounds impressive but produces noise. A curated universe of liquid, tradable instruments produces better signal quality. Ask what's in the universe and why.
- No coding required. If using the tool requires Pine Script, custom formulas, or any programming knowledge, it's not accessible to most retail traders. Ready-made screens you can use immediately are the standard to hold any tool to.
- A copilot model, not autopilot. A good trade-discovery tool surfaces setups and explains them. It does not place trades for you, connect to your broker, or make decisions on your behalf. You remain in control of every execution.
This last point deserves emphasis. The goal of a proactive scanner is to give you better information faster, not to remove you from the decision. The best tools in this category are explicit about that distinction. They're research tools, not trading bots.
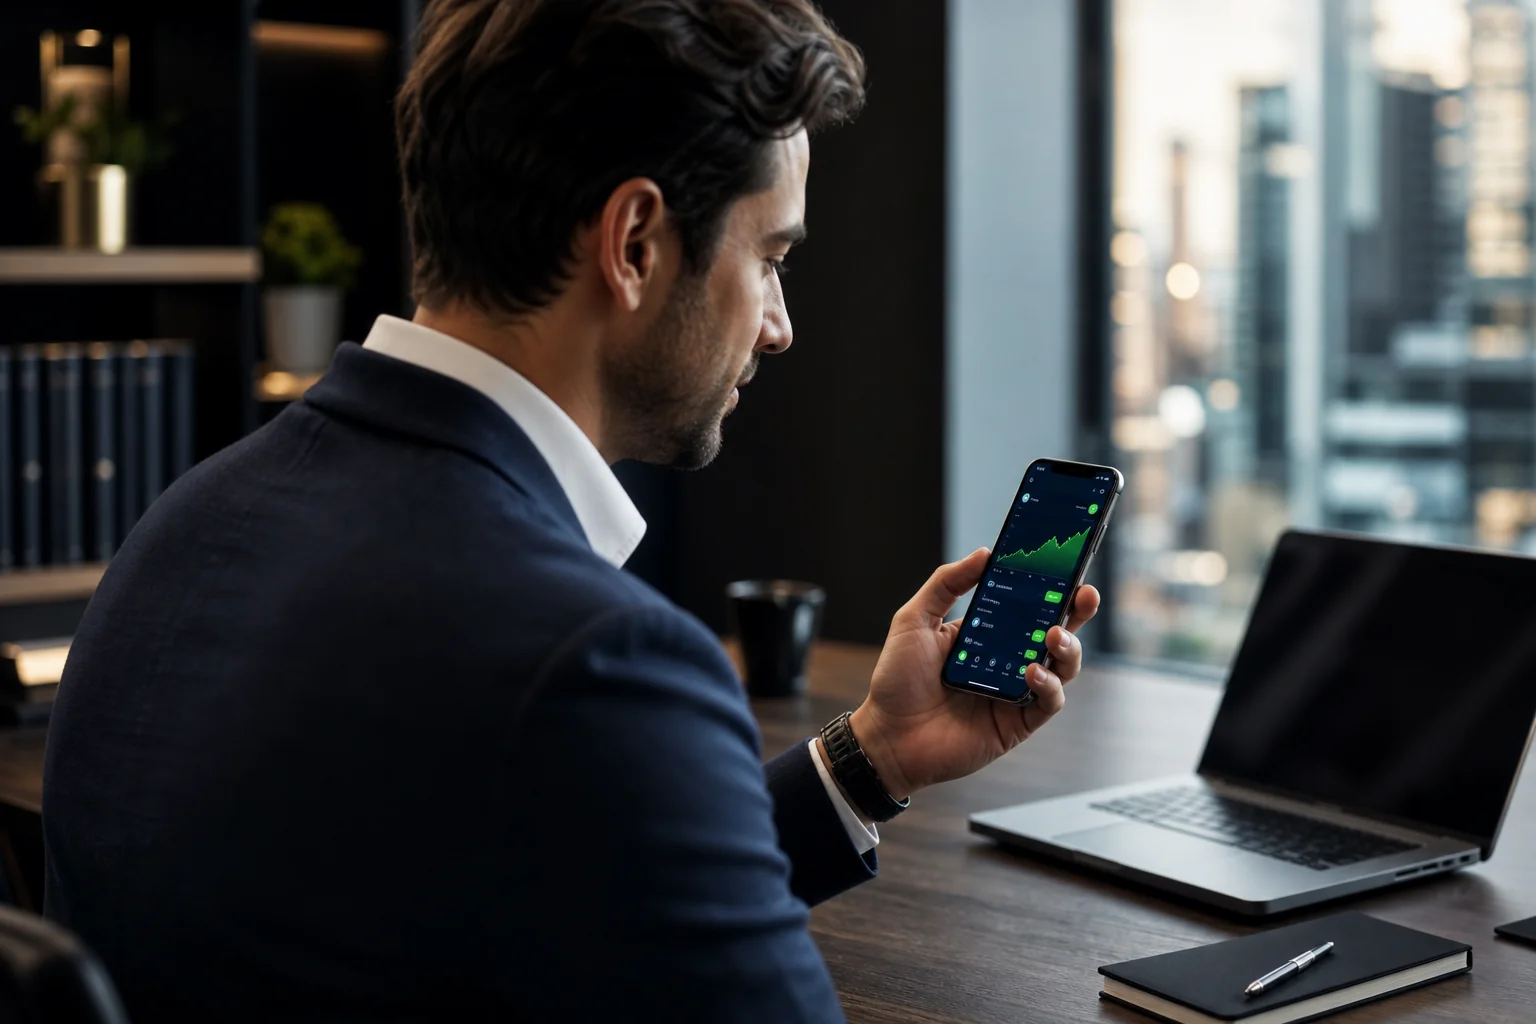
How ChartMath Fits the Model
ChartMath is a mobile-first trade-discovery app built specifically for swing traders with a day job. Every design decision in the product reflects the constraints of that user: limited time, no ability to monitor charts continuously, and a need for high-signal alerts that can be acted on quickly when they arrive.
The universe covers 500+ US equities, 100 crypto pairs, and 11 US futures, across 7 timeframes from 1-minute to monthly. US equities are the primary focus, the app is built around NYSE and Nasdaq-listed stocks, with crypto and futures coverage for traders who want it. Sessions and timing references align to Eastern Time.
The screen library has 200+ curated, backtested technical screens. There's no Pine Script, no coding, and no screen builder. Every screen in the app has been AI-proposed and backtested before it ships. Only screens that clear a verified win-rate threshold make it into the library. Each screen card shows its Win Rate and Average Return, never "Accuracy," which is not a metric ChartMath uses.
Alerts go out via push and email. Each alert carries the ticker, timeframe, screen name, a plain-English explanation of why it fired, and a deep link back to the card. The alert system includes de-duplication, throttling, per-bar caps, and timezone-aware quiet hours, all designed to keep notification volume manageable and signal quality high.
ChartMath is a copilot, not autopilot. It has no broker connection and places no orders. You see the setup, you evaluate it, and you execute in your own brokerage. The app is the research layer; you remain the decision-maker.
ChartMath is currently in open beta: the full screen library, every backtest, and every alert are open while the platform is early, with no feature gates; a paid plan comes later, and traders who join during beta keep founding pricing. The app is available on iOS and Android, with a read-only web browse layer at chartmath.com/screens that requires no sign-in.
A Beginner's Workflow: From Zero to Your First Alert
If you've never used a proactive trade-discovery scanner before, the workflow is simpler than it sounds. Here's how to go from zero to receiving your first meaningful alert.
1. Download the App and Browse the Screener Tab
Start at the Screener tab. This is the full library of 200+ curated technical screens, organized by category. Spend 10 to 15 minutes browsing. You're not looking for everything, you're looking for the setups that match how you already think about trading. Momentum breakouts? VWAP reclaims? Volume spikes? Find the categories that resonate and open a few screens to see what they look for.
You can also browse the screen library on the web at chartmath.com/screens before you download anything, which is a good way to get a feel for the depth of coverage.
2. Favorite the Screens That Match Your Style
Once you've identified the screens you want to follow, favorite them. Favoriting a screen does two things: it adds that screen to your Discover feed, so matching setups surface in your daily swipe feed, and it enables screen-enter alerts, so you get a push notification when a ticker enters that screen.
Start with a small number of screens, five to ten is plenty for a beginner. The goal is to build familiarity with specific setups before expanding your coverage. More screens is not automatically better; more relevant screens is.
3. Let Discover Surface the Daily Feed
The Discover tab is your daily starting point. Each morning (or whenever you have a few minutes), open Discover and swipe through the feed. Each card shows you a setup that's currently active, the screen it matched, the timeframe, and the plain-English explanation of why it triggered. The Win Rate and Average Return for that screen are right there on the card.
You're not making trading decisions here, you're doing triage. Which of these setups is worth a closer look? Which ones don't fit your current risk appetite or market view? The Discover feed is the first filter, not the last one.
4. When an Alert Fires, Read the Card Before Acting
When a push alert lands on your phone, tap through to the card. Read the plain-English explanation. Check the timeframe. Look at the Win Rate and Average Return for that screen. Ask yourself: does this setup make sense given what I know about this stock and the current market environment?
This step takes 60 to 90 seconds. It's the difference between acting on a signal you understand and reacting to a notification you don't. The alert is the trigger for your attention, not the trigger for your order.
5. Verify on Your Charting Platform, Then Execute in Your Broker
If the card passes your initial check, open your charting platform and pull up the chart. Confirm the setup visually. Check the broader context: where is the stock relative to key levels? What's the volume story? Does the setup hold up on a higher timeframe?
If it does, execute in your own brokerage. ChartMath has no broker connection and places no orders. The app is the discovery and research layer. You are the execution layer. That separation is intentional, it keeps you in control of every trade decision.
For a more detailed look at building this kind of systematic daily workflow, the guide on building an efficient trading workflow in 2026 covers the full process from pre-market prep to end-of-day review.
Frequently Asked Questions
Do I need to know how to code to use a trade-discovery scanner?
No. ChartMath requires no Pine Script and no coding of any kind. The 200+ screens are pre-built and ready to use. You browse, favorite, and receive alerts, the technical setup work is already done.
Will it place trades for me automatically?
No. ChartMath is a copilot, not autopilot. It surfaces setups and explains them. You decide whether to act, and you execute in your own brokerage. There is no broker connection and no order placement in the app.
How is this different from a Discord signal group?
Signal groups are human-curated and unvalidated. There's no documented win rate, no backtesting, and no systematic criteria for what gets posted. ChartMath's alerts are generated algorithmically from backtested screens with documented Win Rate and Average Return. Every alert has a verifiable historical basis. There's no human bias, no promotion, and no noise from unvalidated picks.
What markets does ChartMath cover?
ChartMath covers 500+ US equities (NYSE and Nasdaq), 100 crypto pairs, and 11 US futures, across 7 timeframes from 1-minute to monthly. It is a US-first product. Session and timing references align to Eastern Time.
What does ChartMath cost?
ChartMath is in open beta right now: the full screen library, every backtest, and every alert are open while the platform is early, with no feature gates. A paid plan comes later, and traders who join during beta keep founding pricing. When the paid plan launches, it includes a 14-day trial with no card required.
How do I know if a screen has a real edge?
Every screen in ChartMath shows its historical Win Rate and Average Return. These metrics come from backtesting against historical data using bar-close entries with no look-ahead bias. They give you a documented basis for evaluating whether a screen has performed well historically, though past performance does not guarantee future results.
The core idea behind a stock screener that finds trades for you is straightforward: your time is limited, the market is not, and a tool that hunts setups while you're busy is more useful than one that waits for you to go looking. The key is finding a tool that delivers high-signal alerts backed by backtested evidence, explains why each setup triggered, and respects your schedule enough to stay out of the way when you're not trading.
If you're ready to see what proactive trade discovery looks like in practice, download ChartMath on iOS or Android and browse the screen library. In open beta, the full screen library, every backtest, and every alert are open while the platform is early, with no feature gates. Start with the Screener tab, favorite five screens that match your style, and let the Discover feed do the hunting for you.

Ankush Jindal
LinkedInSee these setups live in ChartMath
200+ curated screens with backtest data. 14-day free trial.