Never Miss a Breakout While at Work Again

Your phone is face-down on the conference table. The meeting started at 10:30 AM and it's running long. Somewhere in the market, a stock you've been tracking for two weeks just cleared a six-week base on heavy volume. By the time you get back to your desk, the move is already 4% off the low. The entry is gone. You didn't make a bad trade. You never got the chance to make any trade at all.
That specific frustration — the missed entry, not the losing trade — is what this post is about. It's a different kind of pain, and it has a different kind of fix.
The Real Cost of Missing a Breakout at Work
Most trading education focuses on what to do when you're in a trade. Cut your losses. Let your winners run. Manage your position size. That's all valid. But for traders with a 9-to-5, the more common problem isn't trade management. It's never getting into the trade in the first place.
Think about what actually happens. You spend Sunday evening scanning charts, building a watchlist of five solid setups. You know the levels. You know the conditions that would trigger an entry. Monday morning, you're at your desk by 9:15 AM, you check the premarket, everything looks calm. Then at 10:43 AM, while you're presenting Q2 numbers to your manager, one of those five stocks breaks out on 2.8x relative volume. Clean setup. Textbook entry. Gone.
This isn't a one-off. For traders with day jobs, this happens two or three times a week. Over months, that's not just missed trades. It's a compounding gap between the strategy you've built and the results you're actually getting. The system works. The execution window doesn't exist.
The good news: this is a tool problem, not a skill problem. And tool problems have solutions.
Why Manual Scanning and Basic Screener Alerts Both Fail You
Before getting to the fix, it's worth being honest about why the obvious solutions don't actually solve this.
Manual Scanning
Scanning charts manually — whether it's 20 tickers or 100, only works when you're at your desk with time to do it. It's an after-hours activity. It tells you what was interesting yesterday. It does nothing for you at 10:43 AM on a Wednesday.
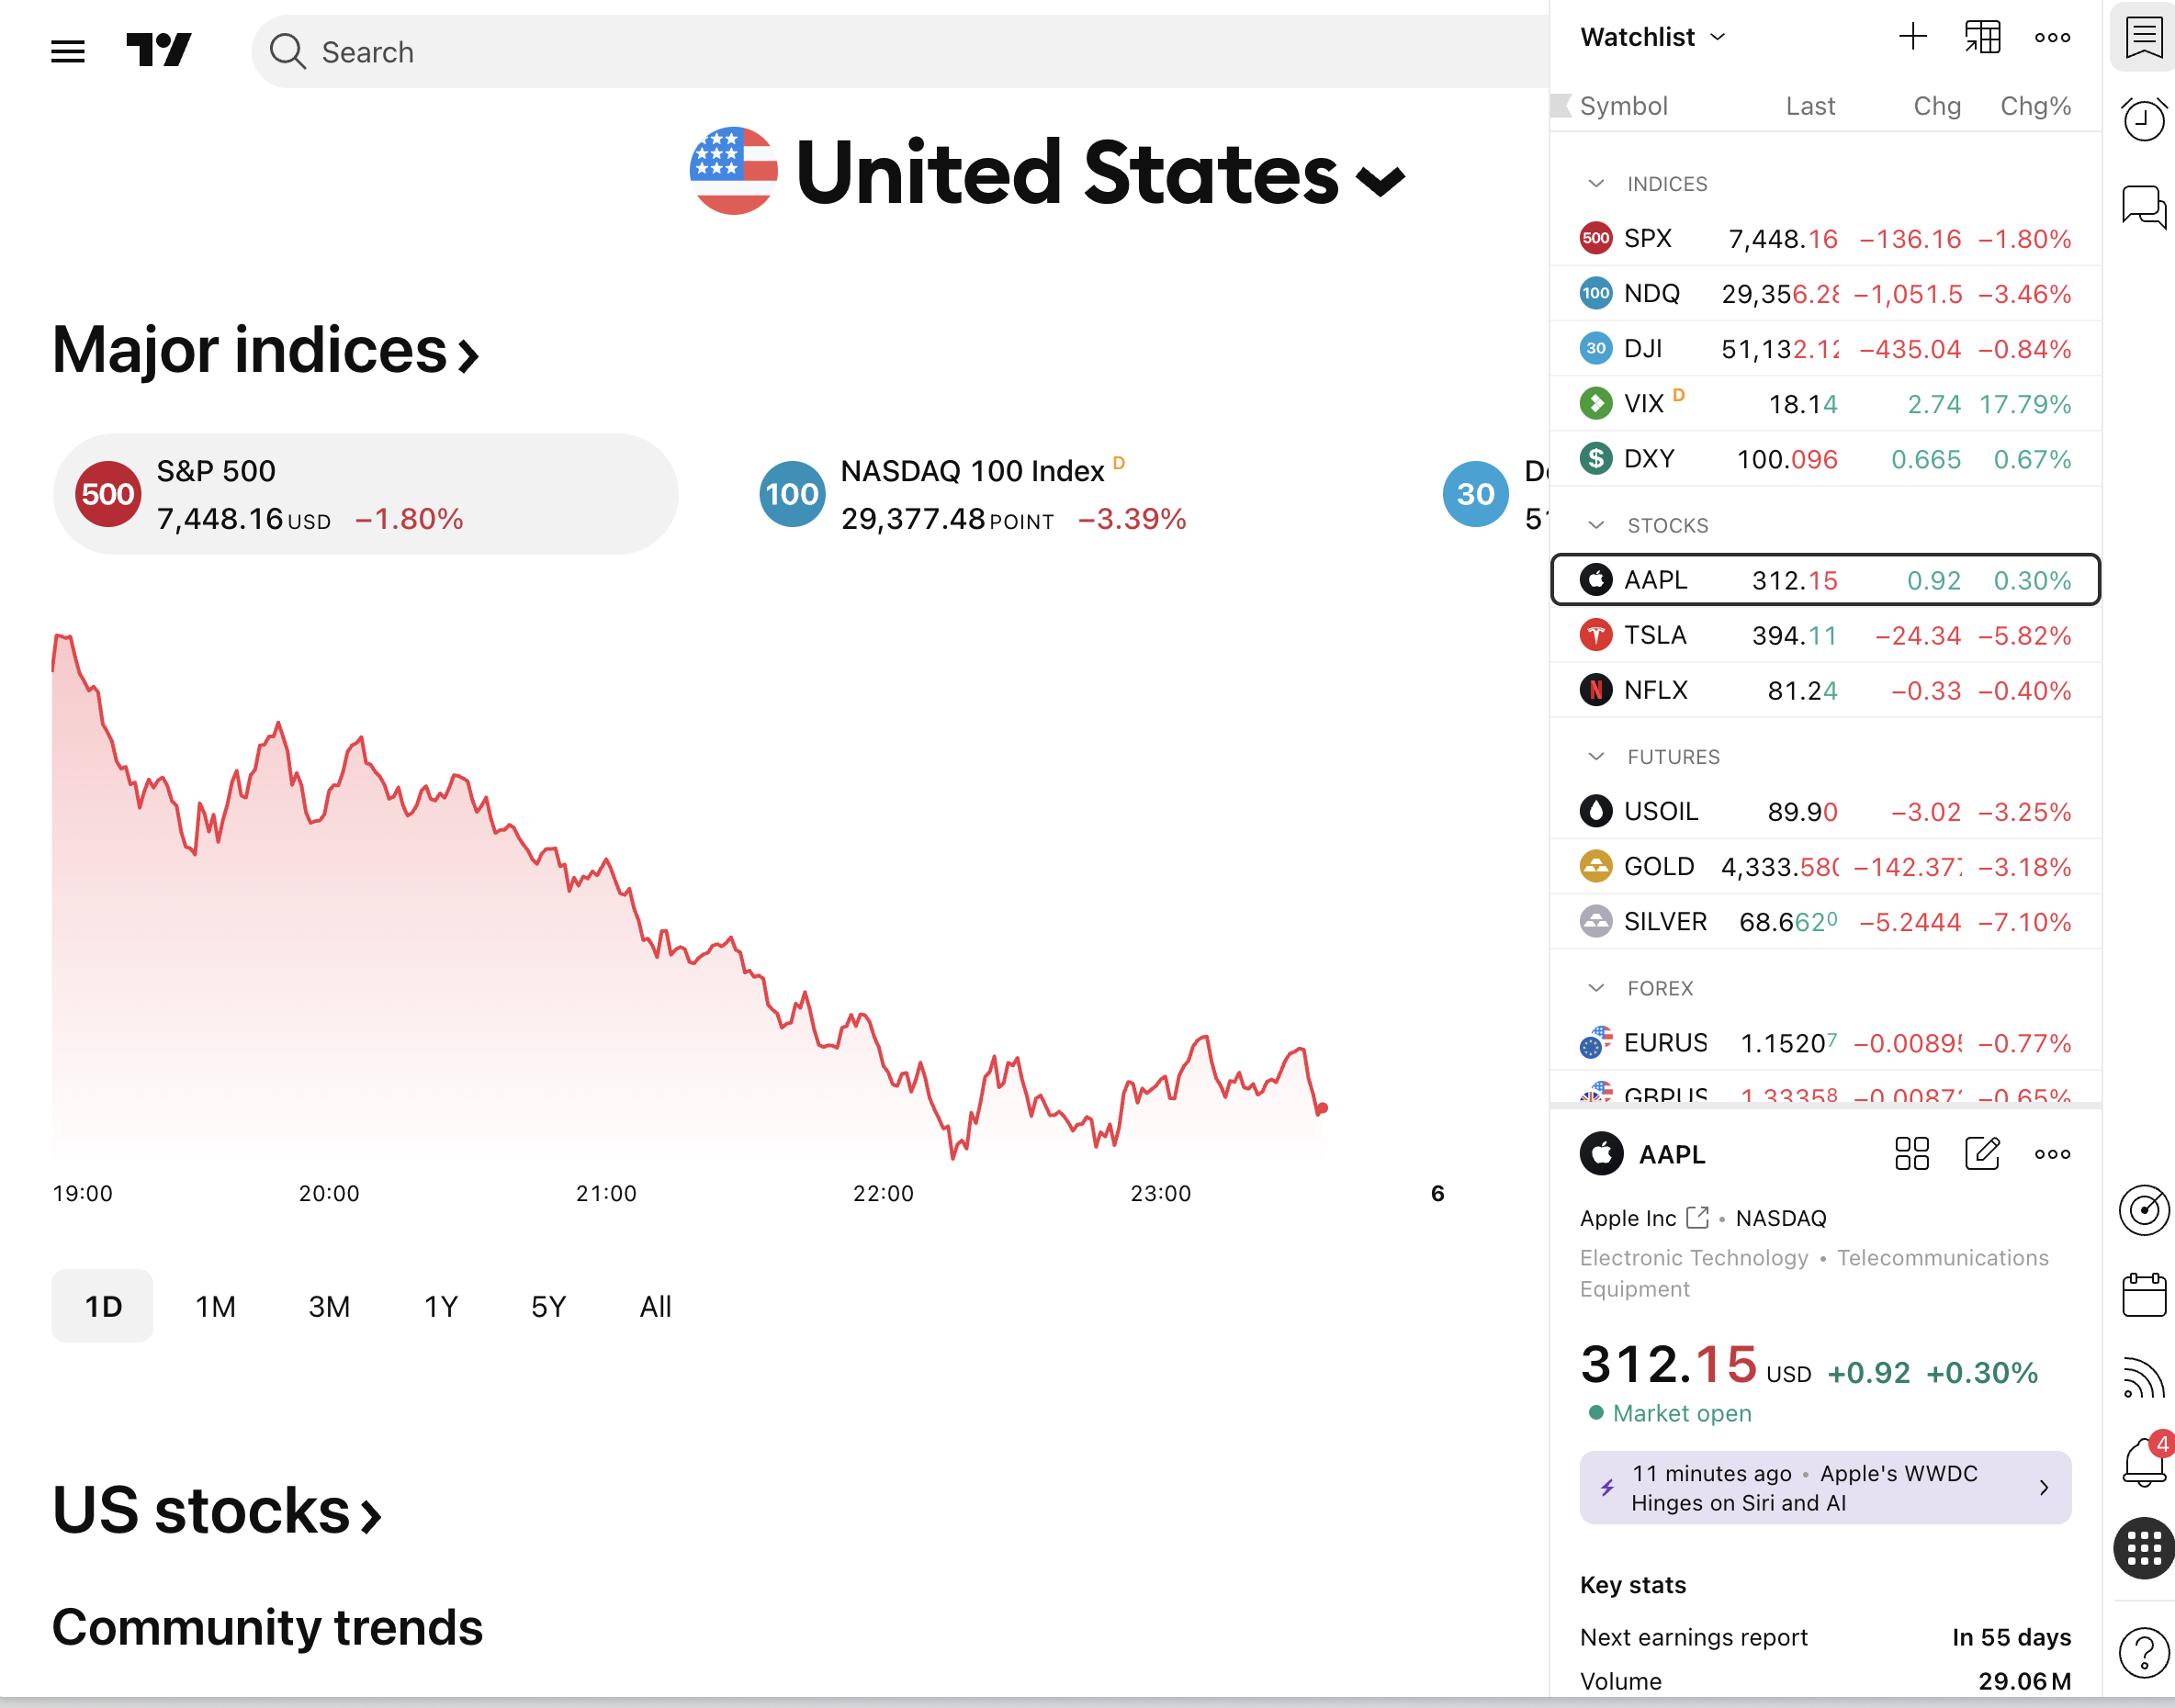
Basic Price Alerts
Setting a price alert in your broker app or on TradingView sounds like the answer. The problem is that a price alert requires you to already know which stock to watch and at what level. You're still doing all the discovery work manually. You're just automating the notification for tickers you've already found. Any stock you haven't already added to your watchlist is invisible.
End-of-Day Screeners
Tools like Finviz are genuinely useful for after-hours research. But they update end-of-day. If a breakout happens at 11 AM, you won't see it until the market closes. By then, the entry is hours old and the risk/reward has changed. For intraday and early-session breakouts, end-of-day data is a post-mortem, not a signal. See also: how stock screeners work for active traders in 2026.
Pine Script Alerts on TradingView
TradingView's alert system is powerful, but it requires you to write Pine Script to build custom conditions, set alerts on every individual ticker, and manage a growing list of alert rules. If you're not a developer, this is a significant barrier. And even if you do set it up, you're still limited to the tickers you've manually added. New setups forming on stocks outside your watchlist stay invisible. For a deeper look at this gap, this breakdown of stock scanners that require no Pine Script covers the alternatives.
Alert Fatigue
Some platforms solve the "find new setups" problem by sending you everything. Hundreds of alerts per day, most of them low-quality, with no context about why they fired or whether the setup has any historical edge. You start ignoring them. Then you miss the one that mattered. Alert fatigue is a real problem, and volume without context makes it worse.
The core gap across all of these: none of them proactively find new setups across the full market, explain why those setups are worth your attention, and push that information to your phone in real time. That's the gap that lets breakouts happen while you're in a meeting.
What a Good Breakout Alert Actually Needs to Tell You
Not all alerts are equal. A notification that says "NVDA triggered" tells you almost nothing useful. You still have to open a chart, figure out what happened, decide if it matches your criteria, and assess whether the entry is still valid. That process takes five to ten minutes you probably don't have at 10:43 AM.
A genuinely useful breakout alert needs to answer five questions instantly:
- What happened? The specific setup that triggered (52-week high breakout, VWAP reclaim, RVOL spike, ORB breakout).
- On which timeframe? A 15-minute VWAP reclaim is a different trade than a daily chart breakout. Context matters.
- Does this setup have an edge? Historical Win Rate and Average Return for that specific screen, so you know whether the pattern has a track record worth acting on.
- Why did it fire right now? A plain-English explanation of the specific conditions that triggered the alert, not just the ticker symbol.
- Where do I go next? A direct link to the chart so you can verify in seconds, not minutes.
When an alert answers all five of those questions, you can make a go/no-go decision in under 30 seconds. That's the difference between an alert you can act on during a two-minute break and one that requires you to sit down at a full workstation. For more on what makes a setup worth trusting before you risk capital, see how to validate a swing trade setup.
How ChartMath Keeps You in the Loop Without Chaining You to a Screen
ChartMath is a mobile-first trade-discovery app built specifically for this problem. It continuously scans a curated universe of 500+ US equities, 100 crypto pairs, and 11 US futures across 200+ pre-built technical screens and 7 timeframes (1m, 5m, 15m, 1h, Daily, Weekly, Monthly). When a ticker enters a screen you've favorited, it sends you a push alert or email immediately.
The key difference from a basic price alert is what the notification actually contains. Each ChartMath alert carries the ticker, the timeframe, the screen name, a plain-English explanation of why it fired, a timestamp, and a deep link straight to the setup card. You're not just told that something happened. You're told what happened, why it matters, and what the historical edge looks like.
Every screen in ChartMath comes with its historical Win Rate and Average Return, calculated from backtested data. You can see, before you act, whether this type of setup has a track record worth taking seriously. That's not a feature most alert systems offer. Most just tell you a condition was met. ChartMath tells you whether that condition has historically been worth acting on.
A few things ChartMath is not, because they matter:
- It is not an autopilot. It surfaces setups. You make the call. You execute in your own brokerage.
- It does not require Pine Script or any coding. The 200+ screens are pre-built and ready to use.
- It does not place trades or connect to a broker. It is a discovery and alert layer, not an execution platform.
Think of it as the scanning system that runs while you're in meetings, so you don't have to.
Setting Up Your Breakout Alert System in ChartMath
Getting set up takes less time than a typical premarket routine. Here's how it works in practice.
Step 1: Get the App
ChartMath is available on iOS and Android. Download it at chartmath.com/app. Start your first month for $1, with every screen, every backtest, and every alert included. After the first month, founding pricing is $24.99/mo, locked for your first 12 months, or $149.99/yr.
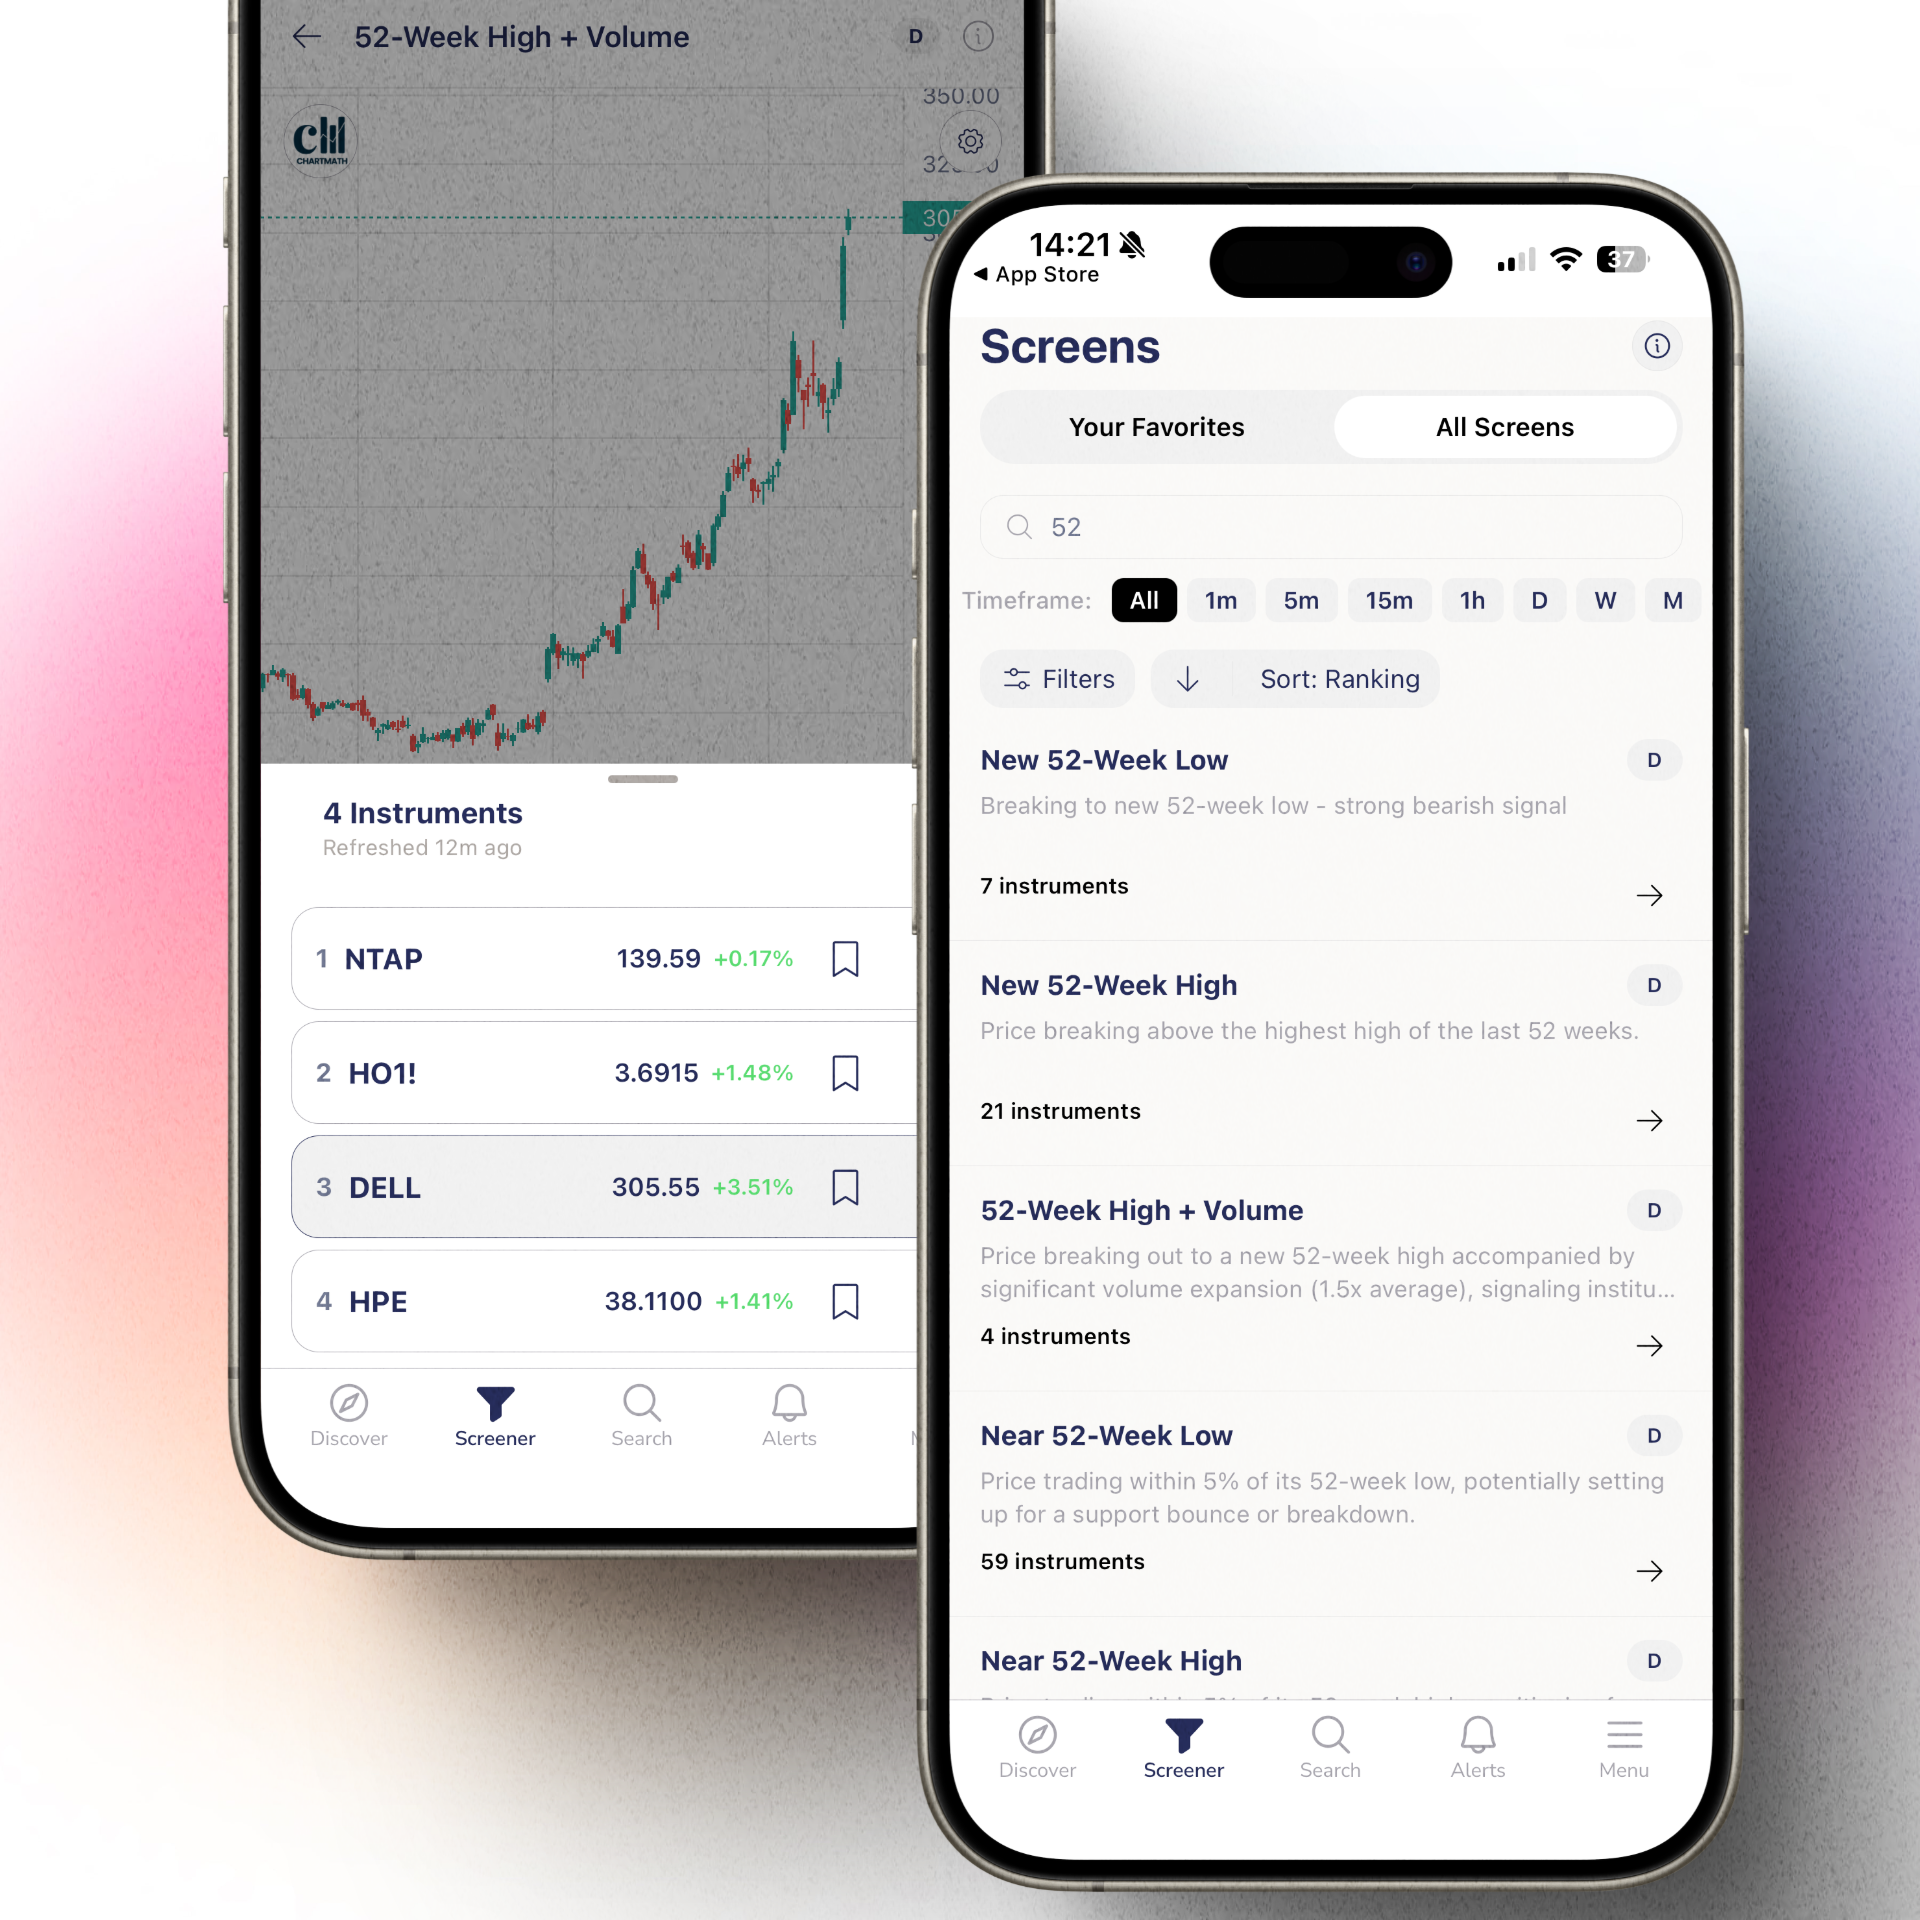
Stocks clearing their 52-week high on elevated volume are among the most reliable momentum setups in technical trading. The 52-week high acts as a major resistance level. When a stock clears it with conviction, it often signals the start of a sustained move. ChartMath's 52-week high screens track this across the full 500+ US equity universe in real time. For a deeper look at how to use this setup, see 52-week high breakout screening.
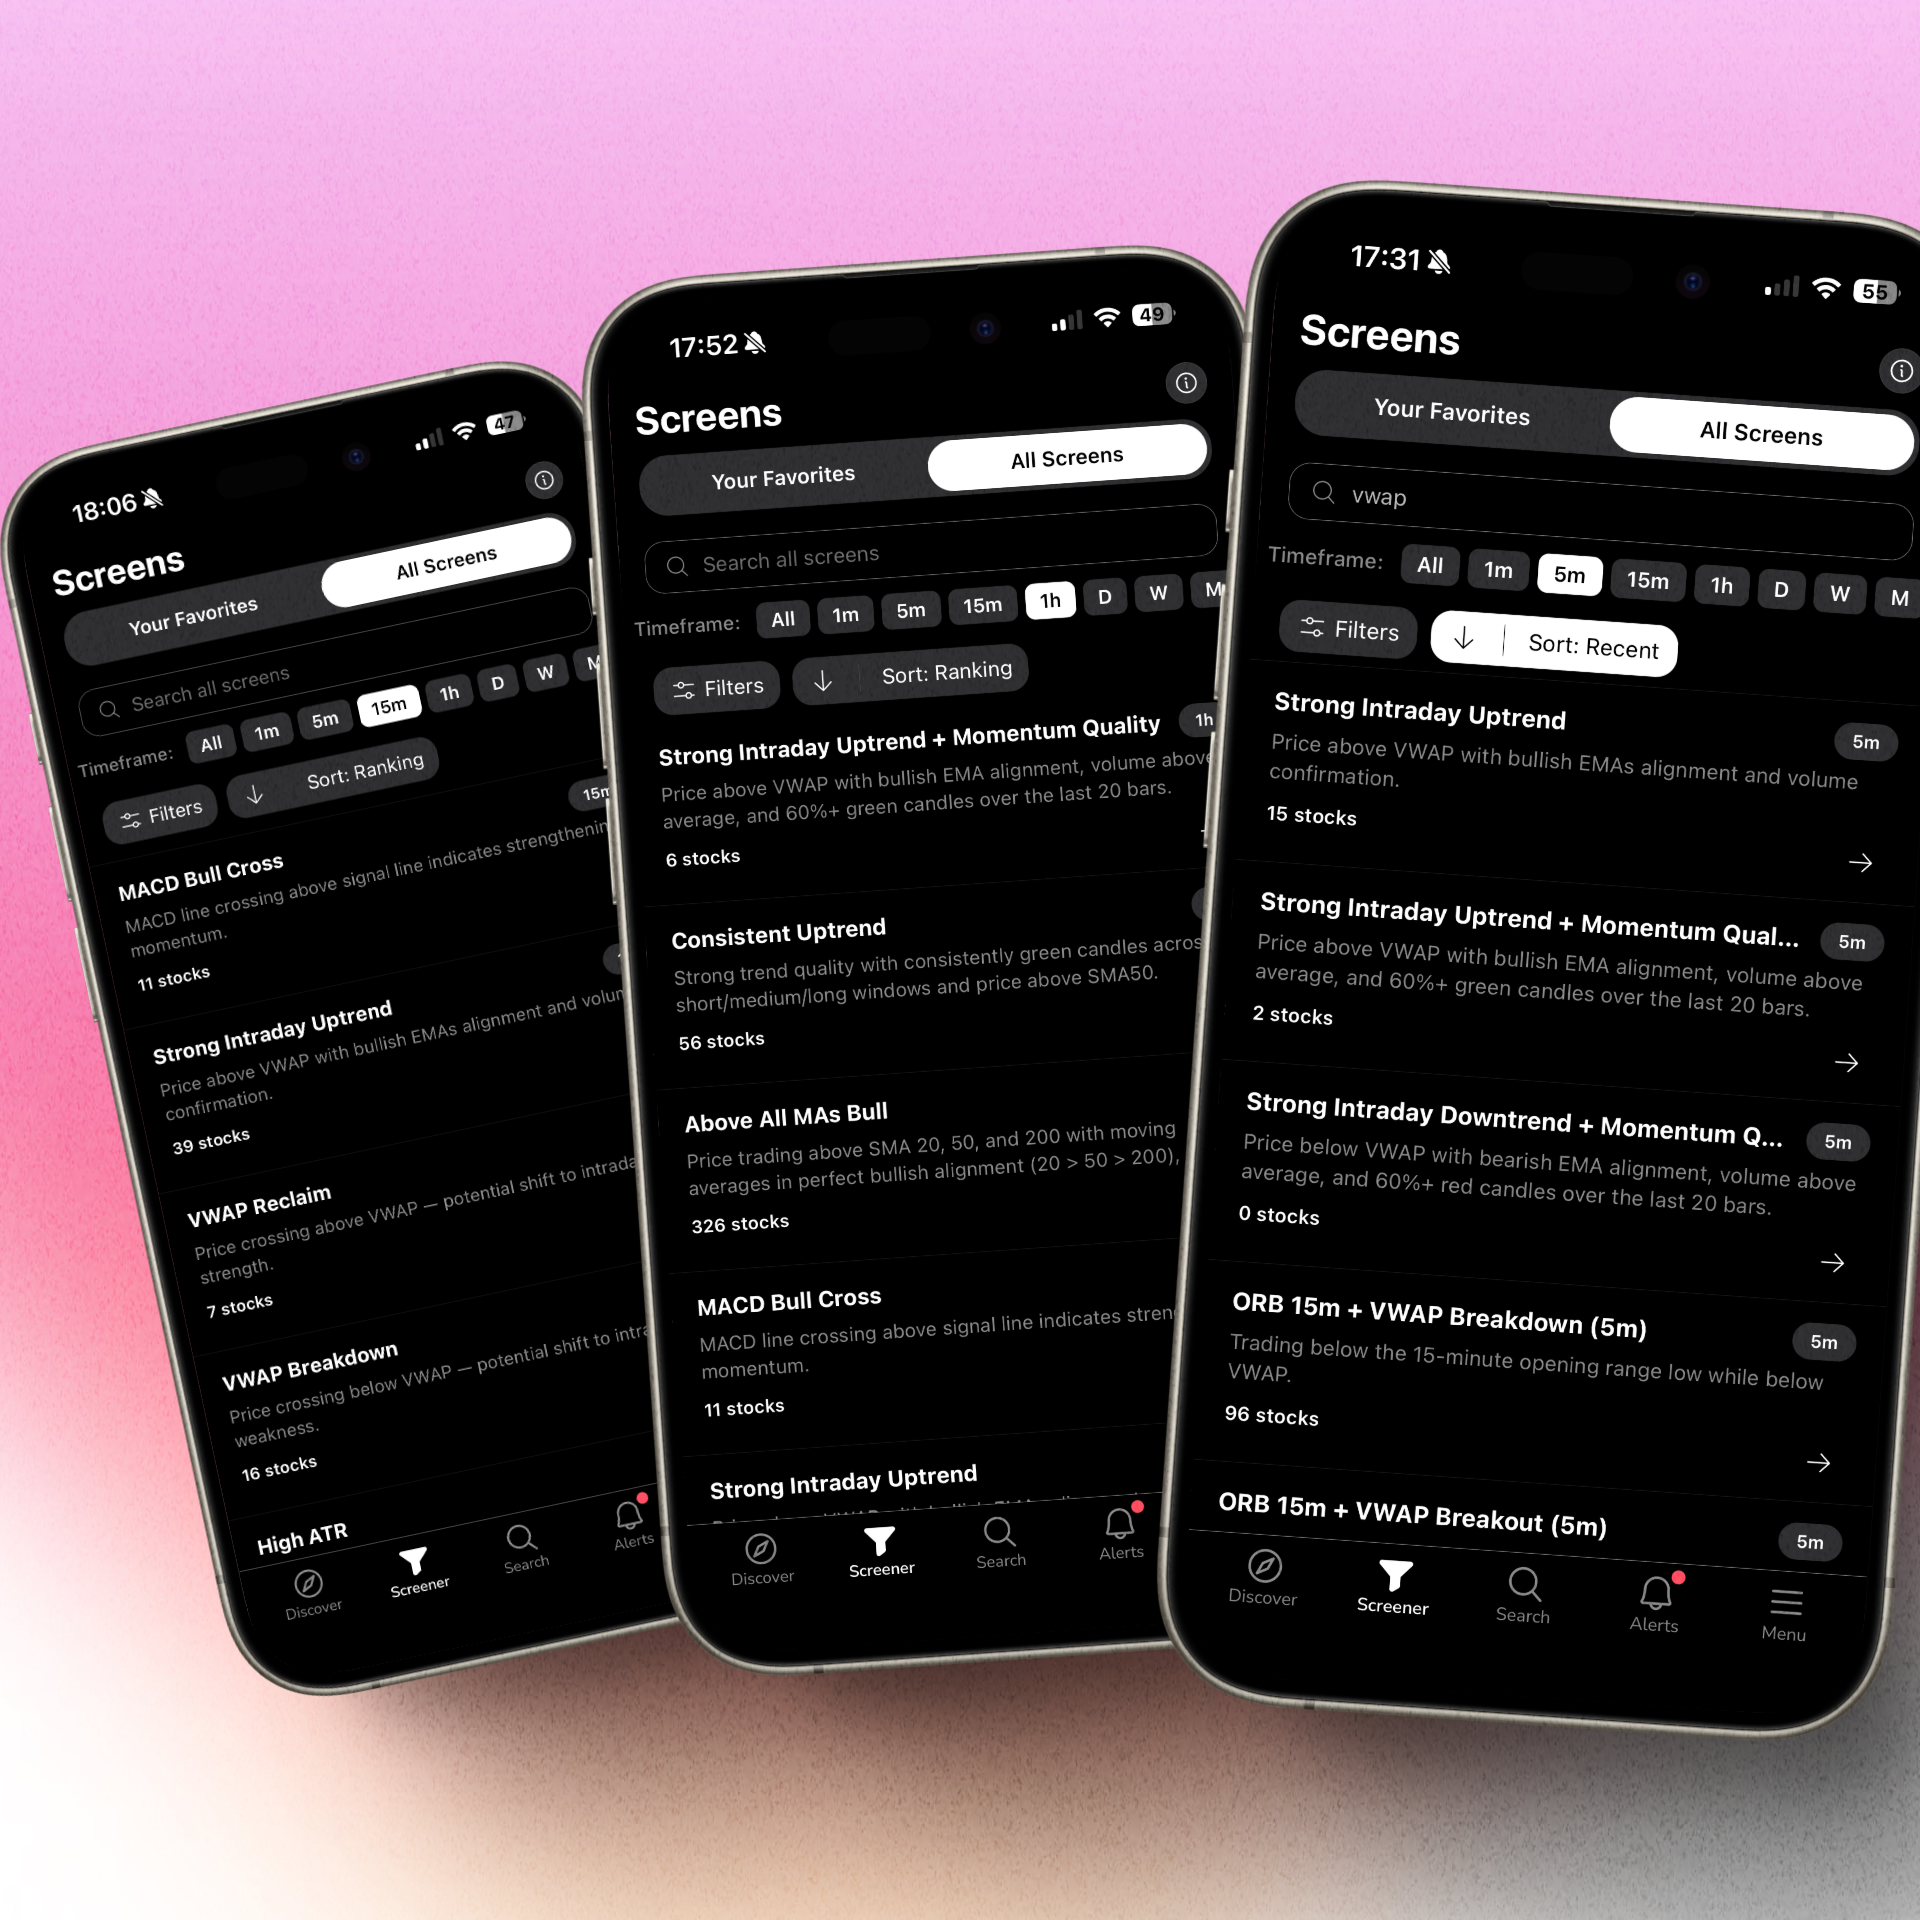
Open the Screener tab. You'll find 200+ curated technical screens organized by category: breakouts, momentum, VWAP, RVOL, ORB, candlestick patterns, and more. These screens are read-only and pre-built. You don't build them. You pick the ones that match your trading style and tap the star to favorite them.
For swing traders focused on breakouts, the most relevant screens are typically in the 52-week high, momentum, and volume-confirmation categories. For intraday traders, VWAP and ORB screens on the 15-minute and 1-hour timeframes are the starting point. You can also browse the full screen library at chartmath.com/screens before downloading.
Step 3: Add Key Tickers to Your Watchlist
Use the Search tab to find instruments and add them to your single watchlist. This is server-synced on mobile, so it follows you across devices. Your watchlist isn't required for alerts to fire, ChartMath scans the full universe regardless, but having your highest-conviction names there makes it easy to track them specifically.
Step 4: Enable Push Alerts for Favorited Screens
Once you've favorited screens, enable push notifications in the Alerts tab. From that point, any time a ticker in the scanned universe enters one of your favorited screens, you get a push alert (and optionally an email). You don't have to be watching. You don't have to be at your desk. The scan runs continuously.
Step 5: Act on Alerts Without Leaving Your Day
When an alert arrives, tap the deep link. You'll see the setup card: the screen that fired, the timeframe, the plain-English reason, and the historical Win Rate and Average Return for that screen. In 30 seconds, you can decide whether this is worth a closer look. If it is, open your charting platform to verify. If not, dismiss it and get back to your meeting.
ChartMath also handles notification hygiene automatically: de-duplication, throttling, per-bar caps, and timezone-aware quiet hours. You won't get the same alert firing repeatedly, and you won't get pinged at 2 AM. The system is designed to give you signal, not noise.
The Breakout Screens Worth Watching for Swing Traders
Not every screen in ChartMath is relevant to every trader. For swing traders with day jobs, a handful of screen categories do most of the heavy lifting.
Stocks clearing their 52-week high on elevated volume are among the most reliable momentum setups in technical trading. The 52-week high acts as a major resistance level. When a stock clears it with conviction, it often signals the start of a sustained move. ChartMath's 52-week high screens track this across the full 500+ US equity universe in real time. For a deeper look at how to use this setup, see 52-week high breakout screening.
Stocks clearing their 52-week high on elevated volume are among the most reliable momentum setups in technical trading. The 52-week high acts as a major resistance level. When a stock clears it with conviction, it often signals the start of a sustained move. ChartMath's 52-week high screens track this across the full 500+ US equity universe in real time. For a deeper look at how to use this setup, see 52-week high breakout screening.
RVOL Spike Screens
Relative volume (RVOL) measures how today's volume compares to the average for that time of day. A stock trading at 3x its normal volume at 10:30 AM is telling you something. RVOL screens in ChartMath surface these spikes across the universe as they happen, so you catch the confirmation signal rather than finding out about it after hours. For more on how RVOL works as a trading signal, this guide on RVOL and volume spikes covers the mechanics in detail.
VWAP Reclaim
The VWAP reclaim is a high-probability intraday momentum setup. A stock drops below VWAP, consolidates, then surges back above it on a volume spike. The whole thing can play out in 10 to 15 minutes. Without a real-time alert, you'll see it on the chart hours later. ChartMath's VWAP screens fire on the 15-minute and 1-hour timeframes, giving you a shot at the entry while it's still valid. See also: VWAP trading fundamentals.
Opening Range Breakout (ORB)
The opening range breakout uses the first 15 to 30 minutes of the session as a reference range. A breakout above or below that range, confirmed by volume, is one of the most widely traded intraday setups. ChartMath's ORB screens track this across the universe from the open, so you get the alert when the breakout happens, not when you happen to check.
Daily Chart Momentum Screens
For swing traders who do most of their review after hours, daily chart screens are the core tool. These fire when a stock meets a multi-day or multi-week technical condition on the daily timeframe. You can review these alerts in the evening, verify on your charting platform, and plan your entry for the next session. This is the workflow that makes swing trading with a day job actually sustainable.
Each of these screens shows its historical Win Rate and Average Return directly on the card. Use those numbers to prioritize. A screen with a higher Win Rate and meaningful Average Return across a solid sample size deserves more attention than one with thin data. That's the evidence layer that separates a setup worth acting on from one worth skipping.
Fitting This Into a Day-Job Trading Schedule

The goal isn't to turn your workday into a trading session. It's to make sure you don't miss the handful of setups that actually matter, without adding hours of screen time to your day. Here's how a realistic schedule looks with ChartMath running in the background.
Premarket (5 to 10 Minutes)
Before you start your workday, open the Discover tab. This is ChartMath's swipe-first feed of explainable entry cards, ranked by backtested reliability and recency. Scroll through the top setups from overnight and early premarket. Check any alerts that fired since you last looked. This takes five minutes and gives you a clear picture of what's worth watching today.
During the Day (Zero Active Time)
This is the point. You don't scan. You don't refresh. You let the alerts come to you. ChartMath is running continuously across 500+ US equities, 100 crypto pairs, and 11 US futures. If something matches a screen you've favorited, your phone buzzes. If nothing matches, your phone stays quiet. Either way, you're not missing anything.
Lunch Break (10 to 15 Minutes)
If any alerts fired during the morning session, your lunch break is the time to review them. Tap the deep link, check the setup card, and if it looks worth pursuing, open your charting platform to verify. Decide whether to set a limit order for the afternoon or flag it for after-hours review. This is the decision window that used to not exist.
After Hours (15 to 20 Minutes)
Your postmarket routine is where you do the deeper work. Review the Screener tab for daily chart setups that formed during the session. Update your watchlist. Check the Win Rate and Average Return on any new screens you're considering adding to your favorites. Prep for tomorrow. The whole routine fits in 20 minutes because ChartMath has already done the scanning. For a full framework on building this kind of efficient routine, see how to build an efficient trading workflow and how to trade without watching the screen all day.
Total active attention: under 30 minutes per day. The rest is the system doing its job.
Frequently Asked Questions
Will I get too many alerts and end up ignoring them?
ChartMath is built with notification hygiene as a core feature, not an afterthought. Alerts are de-duplicated, throttled, capped per bar, and governed by timezone-aware quiet hours. You only get alerts for screens you've explicitly favorited. The more selective you are about which screens you favorite, the more signal-to-noise ratio you get. Start with three to five screens that match your actual trading style, not twenty.
Do I need to cancel my TradingView subscription?
No. ChartMath is designed as a discovery layer that works alongside the charting platform you already use. TradingView, TrendSpider, Finviz, these are analysis tools for stocks you've already pulled up. ChartMath finds the stocks worth pulling up in the first place. They're complementary, not competing. You use ChartMath to discover and get alerted. You use your charting platform to verify and plan the trade.
What if I miss an alert during a long meeting?
Every alert that fires is logged in the Alerts tab. You can review the full history at any time. The alert card includes a timestamp, so you can assess whether the setup is still valid or whether the entry window has passed. Nothing disappears. You're not racing against a notification that expires.
Can I use ChartMath on the web without downloading the app?
Yes. There's a read-only browse layer at chartmath.com/screens where you can explore the full screen library anonymously, no sign-in required. For push alerts and the full Discover feed, you'll need the iOS or Android app. The web layer is useful for exploring screens before committing, or for a quick desktop review during your lunch break.
How is this different from setting a price alert in my broker app?
A broker price alert fires when a stock hits a specific price you've manually set. You still have to know which stock to watch and at what level. ChartMath scans the full universe proactively, finds stocks that match technical setups you care about, and explains why the alert fired. It's the difference between a doorbell (you still have to know someone is coming) and a security system that tells you who's at the door and why they're there.
Stop Letting the Market Trade Without You
Missing a breakout while you're at work isn't a skill gap. It's a coverage gap. Your strategy is sound. Your setups are valid. The problem is that the market doesn't wait for your meeting to end, and manual scanning only works when you have time to do it.
ChartMath closes that gap. It scans 500+ US equities, 100 crypto pairs, and 11 US futures across 200+ curated technical screens, every minute of the trading day, and pushes an explainable alert to your phone the moment a setup triggers. You stay in control of the final call. You execute in your own broker. The system just makes sure you never miss the signal.
Try it with the first month for $1, every screen, every backtest, every alert. After the first month, founding pricing is $24.99/mo, locked for your first 12 months, or $149.99/yr. Get the app at chartmath.com/app and set up your first breakout alert before the next session. Or browse the full screen library first at chartmath.com/screens to see exactly which setups ChartMath tracks.
The next breakout is going to happen whether you're watching or not. Make sure you hear about it.

Ankush Jindal
LinkedInSee these setups live in ChartMath
200+ curated screens with backtest data. First month $1.