Position Sizing for Swing Traders: Risk 1-2% Per Trade

Most traders spend 90% of their prep time finding the setup and about 30 seconds deciding how many shares to buy. That imbalance is where accounts quietly bleed out. A great entry in the wrong size is still a bad trade — either too small to matter or large enough to do real damage when it goes wrong.
Position sizing is rung 2 of becoming systematic. Rung 1 is finding a setup with a documented edge. Rung 3 is executing and managing the exit. But rung 2 — defining exactly how much you risk before you place the order — is the one most traders skip. This guide walks through the math, a worked example, and how to use backtested screen data to size up modestly on higher-conviction setups, all without needing to watch the market during the day.
1. Why Position Sizing Comes Before the Entry
Here is the sequence most traders follow: find a setup, decide it looks good, buy some shares. The size is usually a round number, 100 shares, $5,000 worth, whatever feels right. That feeling is the problem.
When you size by feel, two things happen. First, your risk per trade is random. Some trades risk $80, others risk $600, and you have no idea which is which until the stop gets hit. Second, when you cannot watch the market, because you are in a meeting, on a call, or away from your desk, you have no reliable worst-case number. You just hope the stop holds.
The fix is to reverse the sequence. Define your downside first. Set the stop. Calculate the share count from the math. Then place the order. By the time you hit buy, you already know the maximum dollar loss if the trade goes against you. That number does not change whether you are watching or not.
This matters most for swing traders with a day job. You are holding overnight. You cannot cut a loss manually at 10:43 AM. The position sizing math and the pre-set stop are your only protection while you are unavailable. Getting this right is not optional, it is the foundation of trading systematically when you have limited time.
2. The 1-2% Rule: What It Means and Why It Works
The 1-2% rule is simple: risk no more than 1-2% of your total account equity on any single trade. If your account is $25,000, you risk a maximum of $250 to $500 per trade. That is the dollar amount you are willing to lose if the stop gets hit, not the dollar amount you invest.
This distinction is critical. A 1% risk rule does not mean you put 1% of your account into each trade. It means the difference between your entry price and your stop price, multiplied by your share count, equals 1% of your account. Your actual position value will typically be much larger than 1% of your account. More on that in the worked example below.
Why 1-2% specifically?
The math of drawdown recovery is unforgiving at higher risk levels. Risk 5% per trade and a 10-trade losing streak, which happens to every trader, costs you 40% of your account. Recovering from a 40% drawdown requires a 67% gain just to get back to even. Risk 1% per trade and the same 10-trade losing streak costs you roughly 10%. You need an 11% gain to recover. That is a manageable hole.
Fixed-fractional sizing also scales automatically. As your account grows, your dollar risk per trade grows with it. As your account shrinks after a losing period, your dollar risk shrinks too. You naturally trade smaller when you are losing and larger when you are winning, without any conscious decision required.
For traders who cannot manage positions intraday, the 1-2% ceiling is especially important. You are not there to cut losses early. Your stop is your only exit mechanism during market hours. Keeping risk small means a stop-out is a minor setback, not a crisis.
3. The Math: Three Numbers You Need Before Every Trade
The formula has three inputs. You need all three before you place any order.
Number 1: Account risk in dollars. Multiply your account size by your chosen risk percentage. A $25,000 account at 1% risk gives you $250 of account risk per trade.
Number 2: Per-share risk. Subtract your planned stop price from your planned entry price. If you plan to enter at $48.00 and set a stop at $45.50, your per-share risk is $2.50.
Number 3: Share count. Divide account risk by per-share risk. $250 divided by $2.50 gives you 100 shares.
Written as a formula:
Shares = (Account Size × Risk %) ÷ (Entry Price - Stop Price)
That is the entire calculation. Three numbers, one division. You can do it on your phone in under a minute. The result tells you exactly how many shares to buy so that if the stop gets hit, you lose no more than your pre-defined dollar risk.
One more thing to note: position value and risk are different. In the example above, 100 shares at $48.00 is a $4,800 position, nearly 20% of a $25,000 account. But the risk is only $250, or 1%. A wide stop on a cheap stock and a tight stop on an expensive stock can produce very different position values at the same risk level. Always size from the risk calculation, not from a target allocation percentage.
4. Worked Example: Sizing a Swing Trade Step by Step
Walk through a complete example from start to finish.
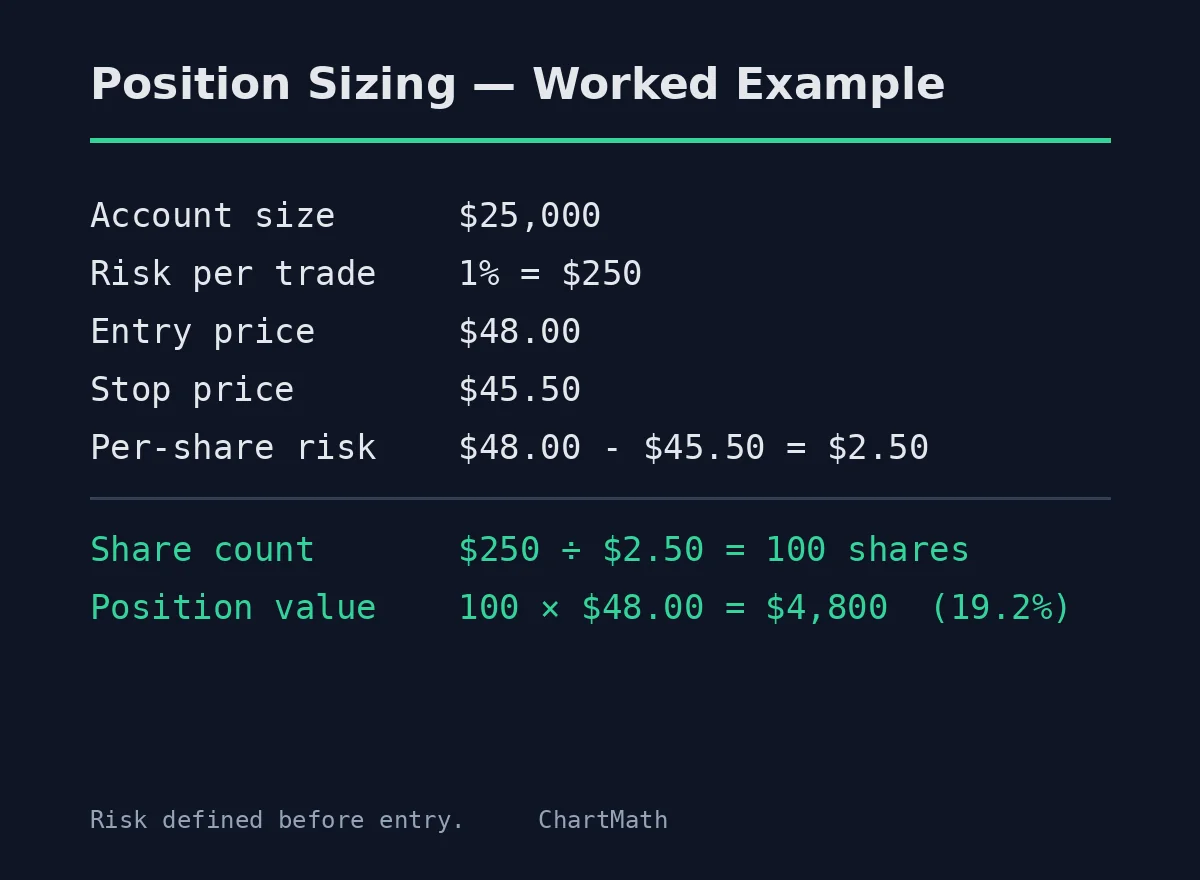
Setup: A daily chart breakout above a multi-week base. Entry planned at $48.00. Stop placed below the base at $45.50. The setup came from a backtested screen with a documented Win Rate and Average Return.
Account size: $25,000
Risk per trade: 1% = $250
Entry price: $48.00
Stop price: $45.50
Per-share risk: $48.00 - $45.50 = $2.50
Share count: $250 ÷ $2.50 = 100 shares
Position value: 100 × $48.00 = $4,800 (19.2% of account)
If the stop gets hit, you lose $250. That is 1% of your account. You can take 10 trades like this in a row and still have 90% of your capital intact.
Now run the same setup at 2% risk:
Risk per trade: 2% = $500
Share count: $500 ÷ $2.50 = 200 shares
Position value: 200 × $48.00 = $9,600 (38.4% of account)
Same setup, same stop, double the size. If the trade works, you make twice as much. If it fails, you lose $500. Both are within the 1-2% framework, the choice between them depends on your conviction level, which we cover in section 6.
Notice what this calculation forces you to do: you must have a stop price before you can calculate a share count. There is no way to use this formula without committing to an exit level first. That is a feature, not a bug. It makes stop placement a required step, not an afterthought.
For more on building a systematic daily workflow around setups like this, see How to Build an Efficient Trading Workflow in 2026.
5. Why Fixed-Fractional Sizing Protects the Trader Who Can't Watch Intraday
Swing traders with a day job face a specific problem: once the order is placed, the trade is largely on its own until you can check back in. You cannot cut a loss at 10:43 AM because you are in a budget review. You cannot trail a stop manually as the stock moves. The position has to be set up correctly before the market opens, or it is not set up at all.
Fixed-fractional sizing solves this in two ways. First, it forces you to set a stop before entry. The math does not work without a stop price. Second, it caps your worst-case loss at a known dollar amount. When you sit down at your desk at 5:30 PM and see the trade got stopped out, you already know the damage: $250, or whatever your 1% figure is. No surprises.
The emotional benefit is just as real. When you size by feel, a losing trade feels like a personal failure, especially if you sized up because you were excited about the setup. When you size by formula, a losing trade is just a data point. The math said risk $250. The trade lost $250. Move on.
Connecting sizing to your exit framework
The exit types you choose also affect how your sizing holds up intraday. ChartMath's exit framework covers five types: end-of-day (EOD), N-bar (exit after a fixed number of bars), stop-loss, take-profit, and trailing stop-loss. Each of these maps directly to the per-share risk in your sizing calculation.
A stop-loss exit is the most direct: the stop price you use in the formula is the same stop you set in your broker. An EOD exit means you close the position at the end of the trading day regardless of price, in that case, your per-share risk is the difference between entry and the worst realistic intraday move, not a hard stop level. A trailing stop changes your effective stop price as the trade moves in your favor, which can reduce your realized loss if the trade reverses after moving up.
The key point: whatever exit type you use, you need a worst-case price before you can size the trade. Define that number first. Then calculate shares.
For a deeper look at how backtesting informs exit selection, see How to Build Winning Backtesting Strategies: A Complete Guide.
6. Sizing Up on Higher-Conviction Setups: Using Win Rate and Average Return as Evidence
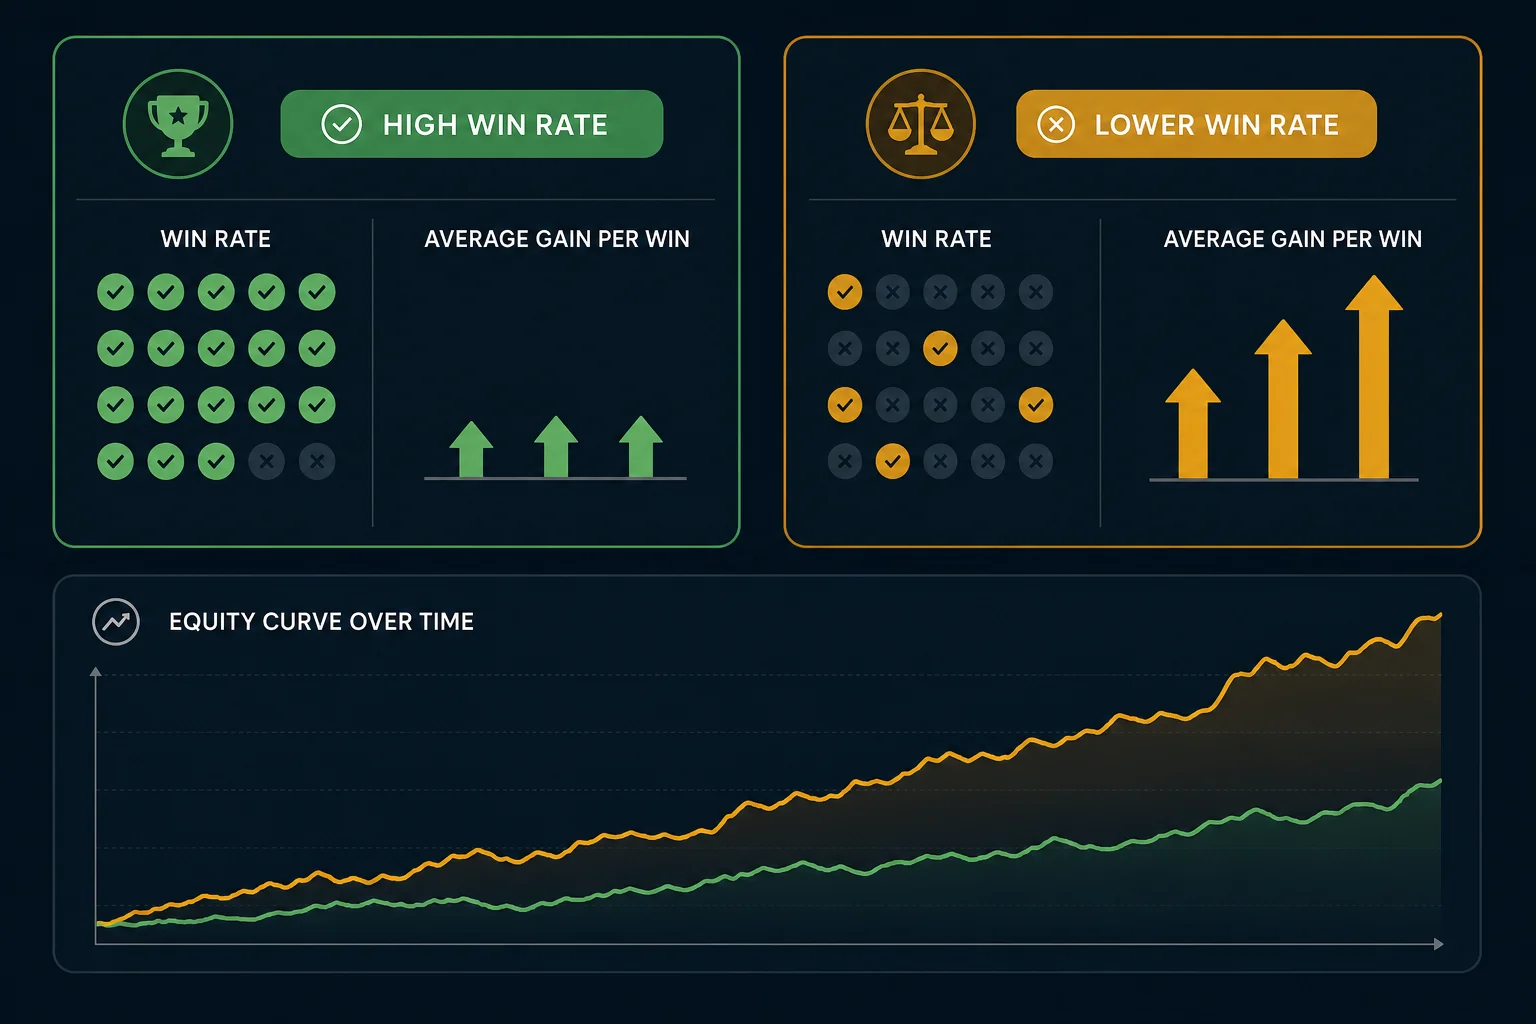
Not every setup is equal. A screen with a strong historical Win Rate and a favorable Average Return gives you more evidence that the edge is real. That evidence does not guarantee the next trade wins, no backtest does, but it is a legitimate, data-driven reason to size toward the higher end of your range.
The framework is straightforward. You have a risk range of 1-2% per trade. On setups from screens with weaker historical metrics, stay at 1%. On setups from screens with stronger historical metrics, move toward 1.5% or 2%. The increase is modest and systematic, not a gut-feel doubling because the chart looks great.
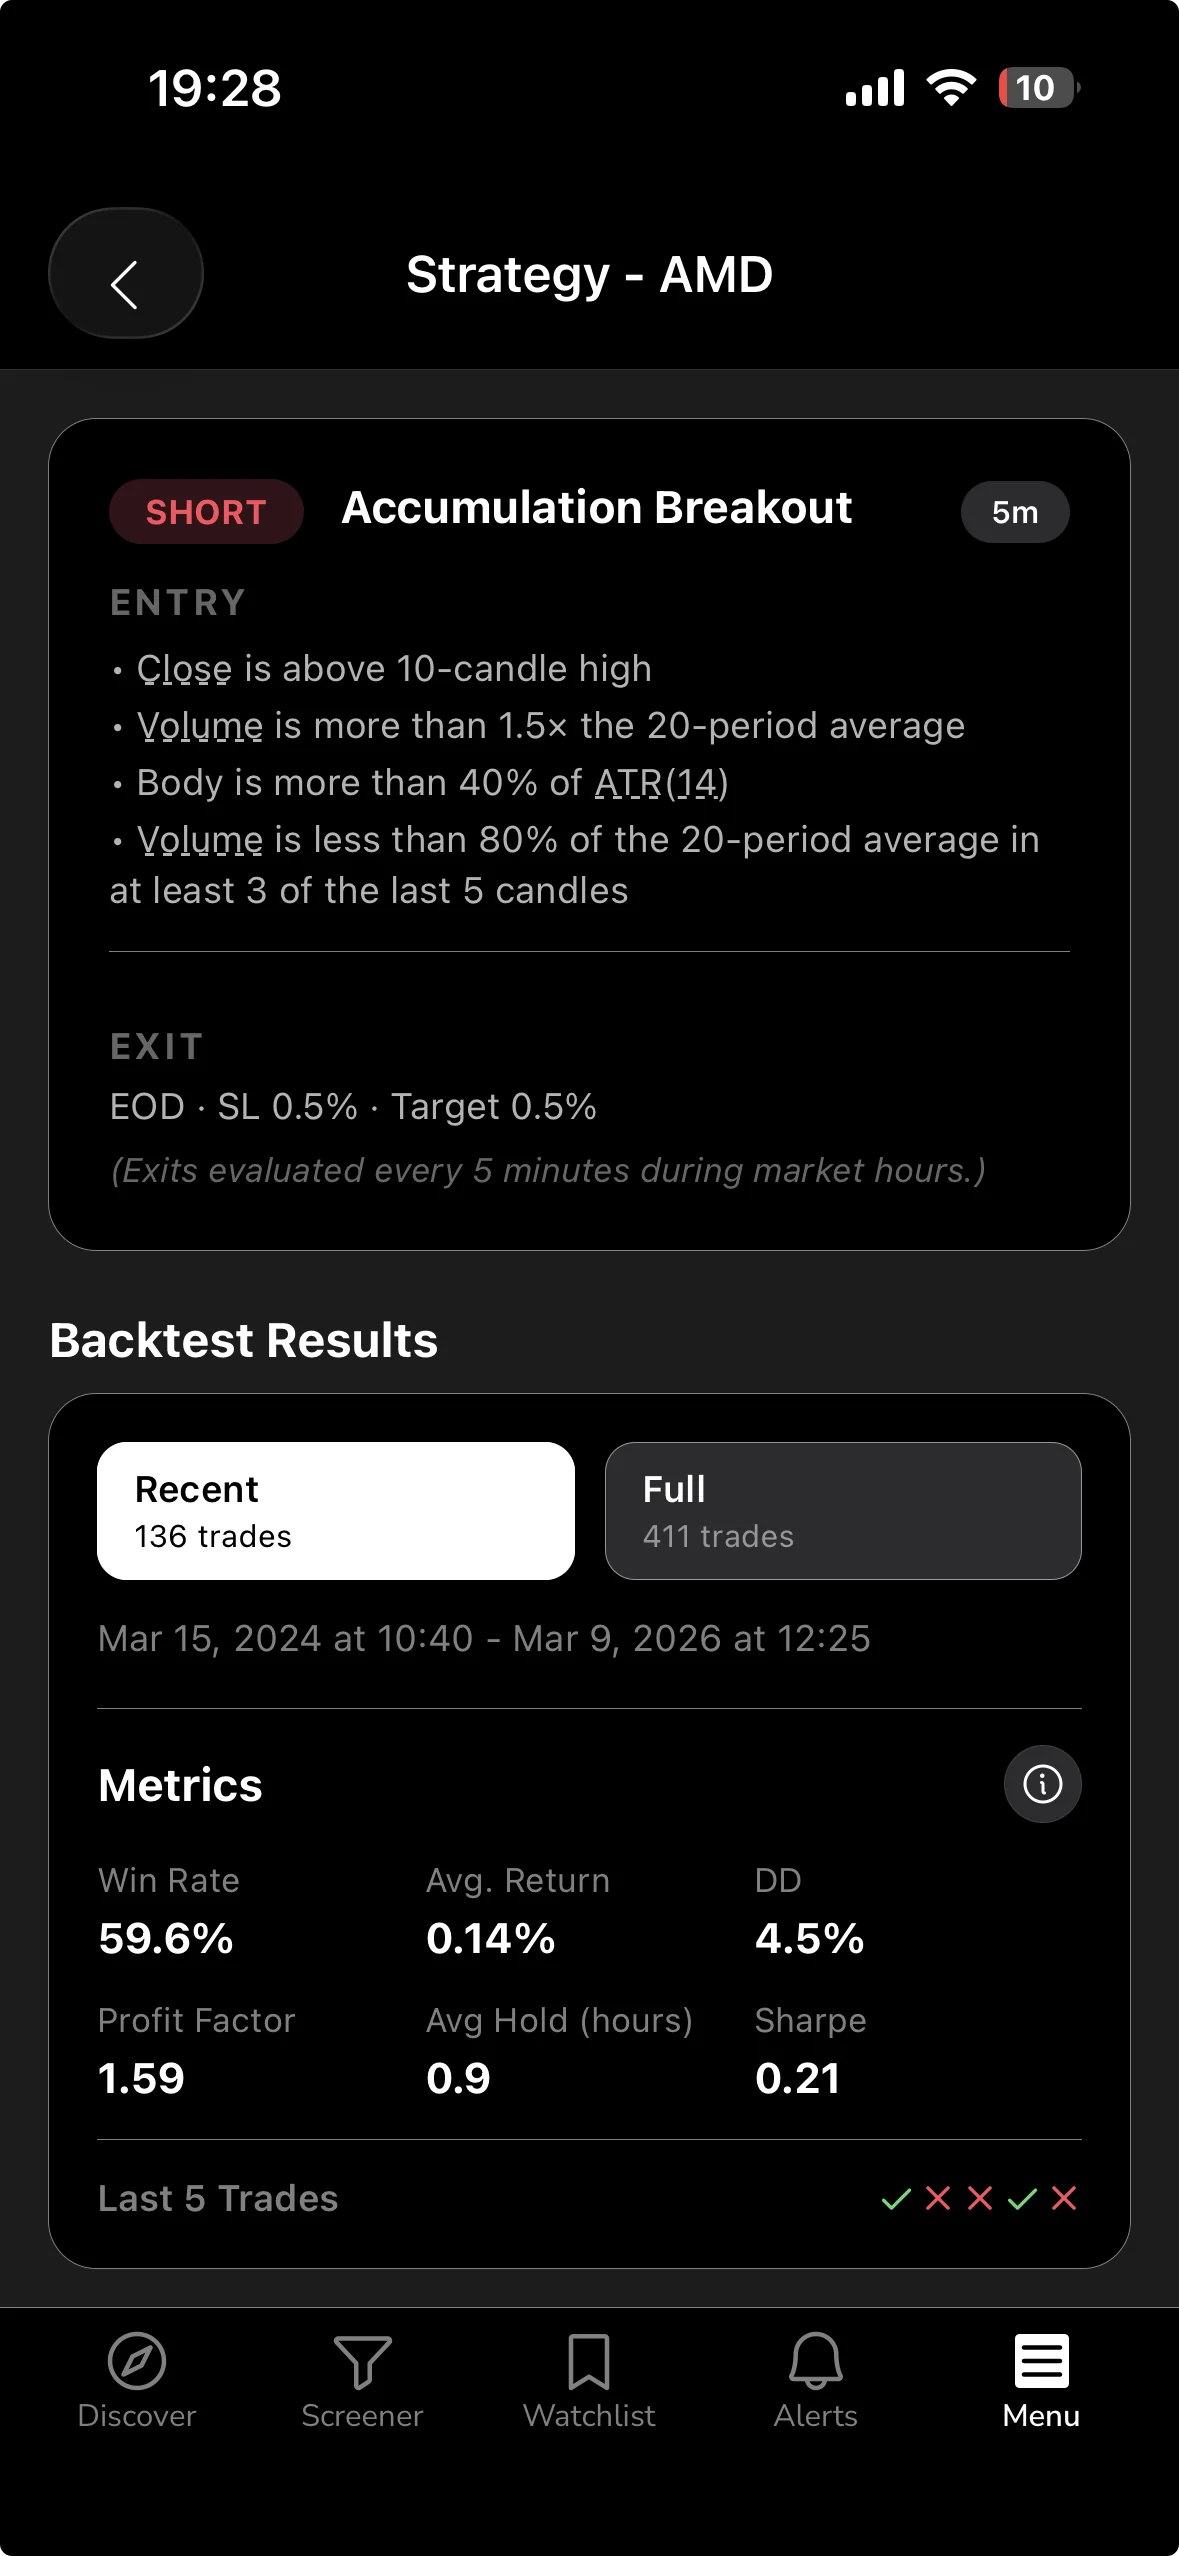
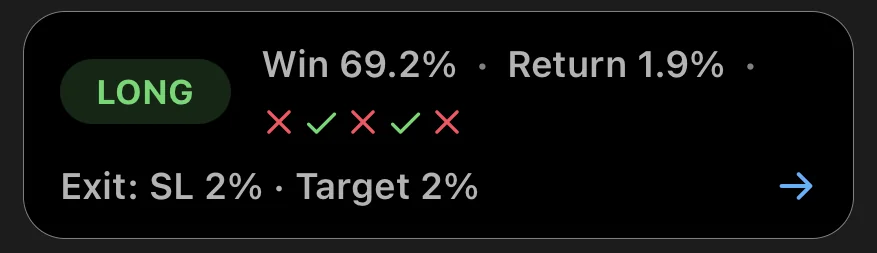
What counts as stronger metrics? That depends on the screen and the timeframe. ChartMath shows the Win Rate and Average Return on every screen card, along with sample size and EV (expected value per trade). A screen with a high Win Rate, a positive Average Return, and a large sample size has more statistical weight behind it than a screen with a small sample. Use all four numbers together, not just the win rate in isolation.
One important caution: the post titled "High Win Rate Doesn't Equal Profitable Trading" covers this in detail, but the short version is this, a 70% win rate with a small average return can underperform a 45% win rate with a large average return. Always look at Win Rate and Average Return together. EV (expected value) combines both into a single number: EV = (Win Rate × Avg. Win) - (Loss Rate × Avg. Loss). A positive EV is what you are looking for.
What sizing up does NOT mean
Sizing up on conviction does not mean abandoning the 1-2% ceiling. It does not mean doubling your position because you had three winners in a row. It does not mean going to 5% because the setup looks perfect. The ceiling exists precisely because setups that look perfect still fail. The data is evidence, not a guarantee. Stay within the framework.
The discipline here is the same as the discipline in finding setups: use the data, make a systematic decision, and execute without emotion. The backtested metrics give you a rational basis for a modest size increase. That is all they are meant to do.
7. How ChartMath Fits Into Your Position Sizing Workflow
ChartMath is a mobile-first trade-discovery app built for swing traders with a day job. It scans 500+ US equities (plus 100 crypto pairs and 11 US futures) across 200+ curated technical screens and 7 timeframes, from 1-minute to monthly. When a stock matches a setup, it sends an alert via push and email with a plain-English explanation of why the setup triggered.
The role ChartMath plays in position sizing is specific: it surfaces the candidate and shows you the historical Win Rate and Average Return for that screen. Those two numbers are the inputs you need to assess conviction and choose where in your 1-2% range to size the trade. You do the sizing math yourself. You place the order in your own broker. ChartMath is the copilot, not the autopilot.
The workflow in practice
The sequence looks like this. ChartMath fires a push alert: a stock has entered a screen you have favorited. You open the alert, see the setup card with the Win Rate and Average Return, and decide whether the setup meets your criteria. If it does, you run the sizing calculation: account size times risk percentage, divided by entry minus stop. You get a share count. You place the order in your broker with the stop pre-set. Done.
The whole process takes a few minutes. You do not need to be at a desk. You do not need to scan manually. The alert comes to you, you evaluate it, you size it, you execute. Then you go back to your day.

The exit framework built into ChartMath's screen backtests covers EOD, N-bar, stop-loss, take-profit, and trailing stop-loss exits. When you look at a screen's historical metrics, those metrics are calculated using one of these exit types. That tells you what kind of stop to set in your broker and gives you the stop distance you need for the sizing formula.
ChartMath starts with a 14-day free trial: every screen, every backtest, every alert, no card to start. After the trial, founding pricing is $24.99/mo (locked for your first 12 months) or $149/yr. You can browse all 200+ screens on the web at chartmath.com/screens without signing in, or get the full alert and discovery experience on iOS and Android at chartmath.com/app.
For traders who want to see how the Screener and Discover feed work before downloading, the Daily Chart Swing Trade Setups: A Scanner Workflow post walks through a practical session from start to finish.
8. Common Position Sizing Mistakes Swing Traders Make
The math is simple, but the execution breaks down in predictable ways. Here are the five mistakes that show up most often.
Mistake 1: Sizing by dollar amount instead of risk amount. Buying $5,000 worth of every trade sounds systematic, but it is not. A $5,000 position in a stock with a $0.50 stop risks $500 on 1,000 shares. The same $5,000 in a stock with a $5.00 stop risks $500 on 100 shares. The dollar allocation is the same; the risk is completely different. Always size from the risk calculation.
Mistake 2: Moving the stop to avoid being stopped out. If you widen your stop after entry, you have changed the per-share risk without recalculating the share count. Your actual dollar risk is now larger than you planned. If you cannot watch the trade intraday, a wider stop means a larger potential loss, exactly the opposite of what you want. Set the stop before entry and leave it there.
Mistake 3: Sizing up after a winning streak. Three winners in a row feels like evidence that your edge is working. It might be. It might also be a short run of luck. Recency bias is powerful. The correct response to a winning streak is to keep sizing by the formula, not to increase risk because you feel confident. Let the backtested metrics guide conviction, not recent results.
Mistake 4: Using the same share count for every trade regardless of stop distance. Buying 100 shares every time ignores the fact that stop distances vary. A tight stop on a volatile stock and a wide stop on a slow-moving stock require very different share counts to produce the same dollar risk. Run the formula every time.
Mistake 5: Forgetting gap risk on overnight holds. Swing trades hold overnight. A stock can gap down through your stop at the open, and your actual loss will be larger than the stop implied. This is a real risk that the sizing formula does not fully capture. One way to manage it: keep individual position sizes smaller on stocks with high overnight gap risk (earnings upcoming, high beta, thin float). The 1-2% rule gives you a ceiling; you can always size below it.
For more on managing setups when you cannot watch the market, see How to Trade Stocks Without Watching Screen All Day.
9. Frequently Asked Questions
What account size do I need to use the 1% rule effectively?
There is no hard minimum, but smaller accounts run into a practical constraint: the share count the formula produces may be less than one share, or so few shares that commissions eat a meaningful percentage of the trade. A $5,000 account at 1% risk gives you $50 of account risk per trade. If the per-share risk on a setup is $2.50, that is 20 shares, workable. If the per-share risk is $10.00, that is 5 shares, which is still valid but limits your flexibility. The formula works at any account size; just be aware that very small accounts may need to focus on lower-priced stocks with tighter stops to keep share counts reasonable.
Should I risk 1% or 2% per trade?
Start at 1% until you have at least 20-30 trades of data from your own trading. Once you have a track record, you can use the backtested Win Rate and Average Return from your screens to inform whether 1.5% or 2% is justified on higher-conviction setups. New traders should stay at 1% across the board. The goal early on is to survive long enough to learn, not to maximize returns.
Does position sizing change for crypto or futures?
The formula is the same: account risk divided by per-share (or per-unit) risk equals position size. The inputs change. Crypto trades in fractional units, so your share count becomes a fractional coin amount. Futures have a fixed contract size and a dollar value per point, so you calculate the number of contracts rather than shares. The principle, define your downside first, work backward to size, applies across all three asset classes. ChartMath covers 100 crypto pairs and 11 US futures alongside its 500+ US equities universe, so the same discovery workflow applies regardless of which market you trade.
What if my stop is very tight, does that mean I buy more shares?
Yes, mathematically. A tighter stop means lower per-share risk, which means more shares at the same dollar risk. But be careful: a very tight stop on a volatile stock is likely to get hit by normal price noise before the trade has a chance to work. If the formula is telling you to buy 500 shares because your stop is $0.50 away on a stock that moves $1.00 in a normal session, the stop is probably too tight. The sizing formula assumes your stop is placed at a technically meaningful level. If the stop is arbitrary, the formula produces a misleading result.
How do I handle partial fills or odd lot sizes?
Round down to the nearest whole share. If the formula says 87 shares, buy 87 or 85, not 90 or 100. Rounding up increases your risk above the calculated amount. Rounding down keeps you at or below it. The difference of a few shares is trivial; staying within your risk limit is not.
Start Sizing Every Trade Before You Enter
Position sizing is not a complicated skill. The formula has three inputs and takes under a minute to run. What makes it hard is the discipline to do it every time, on every trade, before you place the order, especially when a setup looks compelling and you want to act fast.
The traders who stay in the game long enough to get good are the ones who define their downside first. They know the worst-case number before the order goes in. They are not surprised when a stop gets hit. They size up modestly on stronger setups and stay small on weaker ones, using data rather than gut feel to make that call.
ChartMath is built to support exactly this workflow. It surfaces candidates from 200+ backtested technical screens across 500+ US equities, shows you the historical Win Rate and Average Return on every setup, and sends alerts via push and email the moment a stock matches a screen. You get the signal, you run the sizing math, you place the trade in your own broker. Copilot, not autopilot.
Every screen, every backtest, every alert is included in the 14-day free trial, no card to start. Browse the full screen library at chartmath.com/screens, or download the app and start getting alerts on the setups that match your criteria: chartmath.com/app.
After the trial, founding pricing is $24.99/mo (locked 12 months) or $149/yr. There is no better time to build the habit of sizing every trade before you enter.

Ankush Jindal
LinkedInSee these setups live in ChartMath
200+ curated screens with backtest data. 14-day free trial.