Post-PDT Small Account? 3 Backtested Swing Screens, Shown With Their Hit Rates

Small account. No PDT cage. Now what?
FINRA eliminated the Pattern Day Trader rule effective June 4, 2026 (FINRA Notice 26-10). The $25,000 minimum equity floor is gone. The three-day-trade-per-five-day-session test is gone. Brokers have until October 20, 2027 to complete their phase-in, and the only equity gate that remains is the pre-existing $2,000 margin minimum — not a new rule, just the old one that was always there. For traders running $3,000 to $15,000 accounts, this is a genuine structural change.
But here is the uncomfortable truth: the PDT rule was accidentally doing you a favor. It forced selectivity. You had three day trades per week, so you had to pick carefully. That constraint is gone now. What replaces it?
For traders with limited capital and limited screen time, the answer is backtested swing trading screens for small accounts — screens with documented win rates, average returns, and sample sizes large enough to mean something. This post walks through three of them, shows you how to read the numbers honestly, and gives you a repeatable weekly routine to run them without staring at charts all day.
Why Proof Matters More When Capital Is Thin
A $100,000 account can absorb a 10% drawdown and still have $90,000 to work with. A $5,000 account absorbs the same percentage drawdown and has $4,500 left — a number that starts to feel personal. The math of ruin is not linear. Thin capital punishes bad selectivity faster and harder than large capital does.
Before June 2026, the PDT rule created an accidental filter. You could only make three day trades per rolling five-day period, so most small-account traders defaulted to swing trading out of necessity. They held positions overnight. They had to be more deliberate about entries because they couldn't just flip in and out. The rule was frustrating, but it imposed a kind of discipline.
Now that the rule is gone, the temptation is to trade more. More setups, more timeframes, more action. That temptation is the trap. The traders who will do well post-PDT with small accounts are the ones who replace the old external constraint with an internal one: only trade setups where you have documented historical evidence of edge.
That is what a backtested swing screen gives you. Not a guarantee, markets change, and past performance is not a promise of future results. But a screen with a meaningful sample size, a positive expected value, and a clear entry rule is a far better basis for a trade than a chart that "looks good" or a Discord call you saw at lunch.
For a deeper look at how the PDT elimination changes the day-trading landscape, see the companion explainer PDT Rule Eliminated 2026: What Changed for Day Traders.
How to Read a Screen's Hit Rate and Expectancy Before You Size a Trade
Win rate alone is not edge. This is the most important sentence in this article, so it is worth sitting with for a moment.
A screen that wins 70% of the time sounds excellent. But if the average winning trade returns 1% and the average losing trade costs 4%, that screen has a negative expected value. You will lose money running it consistently, even though it "wins" more often than it loses. The win rate number feels good. The math does not.
The three numbers you need to evaluate any screen before you size a trade:
- Win Rate: The percentage of historical instances where the setup produced a positive return by the exit condition. Higher is better, but only in context.
- Average Return: The mean return across all historical instances, wins and losses combined. This is the number that tells you whether the win rate is actually worth something.
- Sample Size: How many historical instances the backtest is based on. A 75% win rate on 8 trades is noise. A 75% win rate on 200+ trades is a signal worth paying attention to.
Expected Value (EV) ties these together. The simplified version: EV = (Win Rate × Average Win) minus (Loss Rate × Average Loss). A positive EV means the setup has historically paid out more than it has cost, on average. That is the baseline you want before you commit capital.
ChartMath surfaces all of these metrics on every screen card, Win Rate, Average Return, EV, and sample size, so you are not doing the math manually. But understanding what the numbers mean is what separates a trader who uses them from one who just glances at the win rate and moves on.
One important caveat: ChartMath's backtests use bar-close entries with no look-ahead bias. They do not yet model commissions, slippage, or spread. Real-world returns will differ. Treat the backtested figures as a relative ranking tool, a way to compare screens against each other and filter out the ones with weak historical evidence, not as a precise prediction of what your next trade will return.
For a deeper dive into how backtesting works and what to look for, How to Build Winning Backtesting Strategies: A Complete Guide covers the methodology in detail.
1. Pullback to a Rising Moving Average
The first screen type to understand is the pullback to a rising moving average. The logic is straightforward: a stock in an uptrend will periodically pull back to its 20-day or 50-day EMA before resuming higher. Buying that pullback, with a stop below the moving average, gives you a defined-risk entry in the direction of the trend.
For small accounts, this setup has two structural advantages. First, the stop is clear. You know exactly where you are wrong: if price closes below the moving average, the thesis is broken. That makes position sizing straightforward using a 1-2% account risk rule. Second, you are trading with the trend, not against it, which historically improves the probability of follow-through.
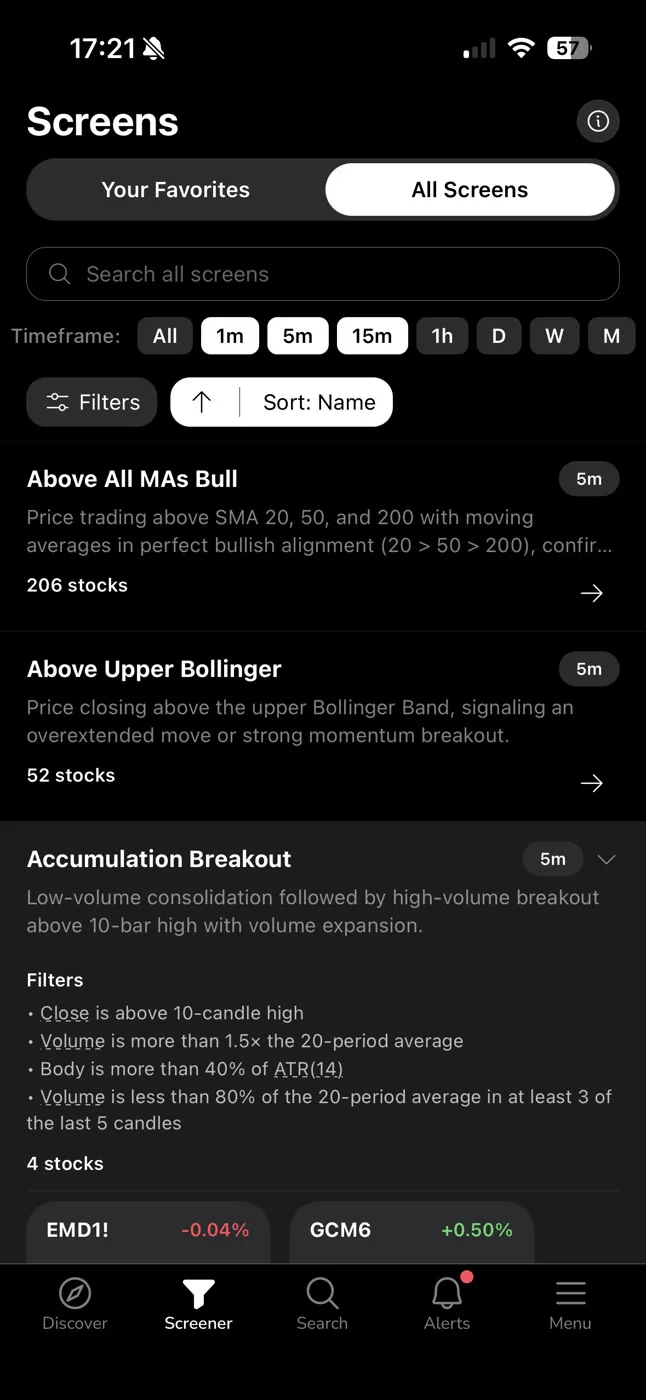
In ChartMath's Screener, screens like Price Above 20/50 EMA and related moving-average pullback setups surface stocks that meet this condition across the 500+ US equity universe. When you open a screen, you see the historical Win Rate and Average Return for that specific pattern, not a generic claim, but the backtested result on the actual universe ChartMath scans.
As an illustrative example of what the app shows: a Price Above 20/50 EMA screen has shown a backtested win rate in the 75% range on the Daily timeframe across the US equity universe. That figure is a historical backtest result on a fixed universe, not a forward guarantee. Check the current sample size and EV on the screen card before you act on it.
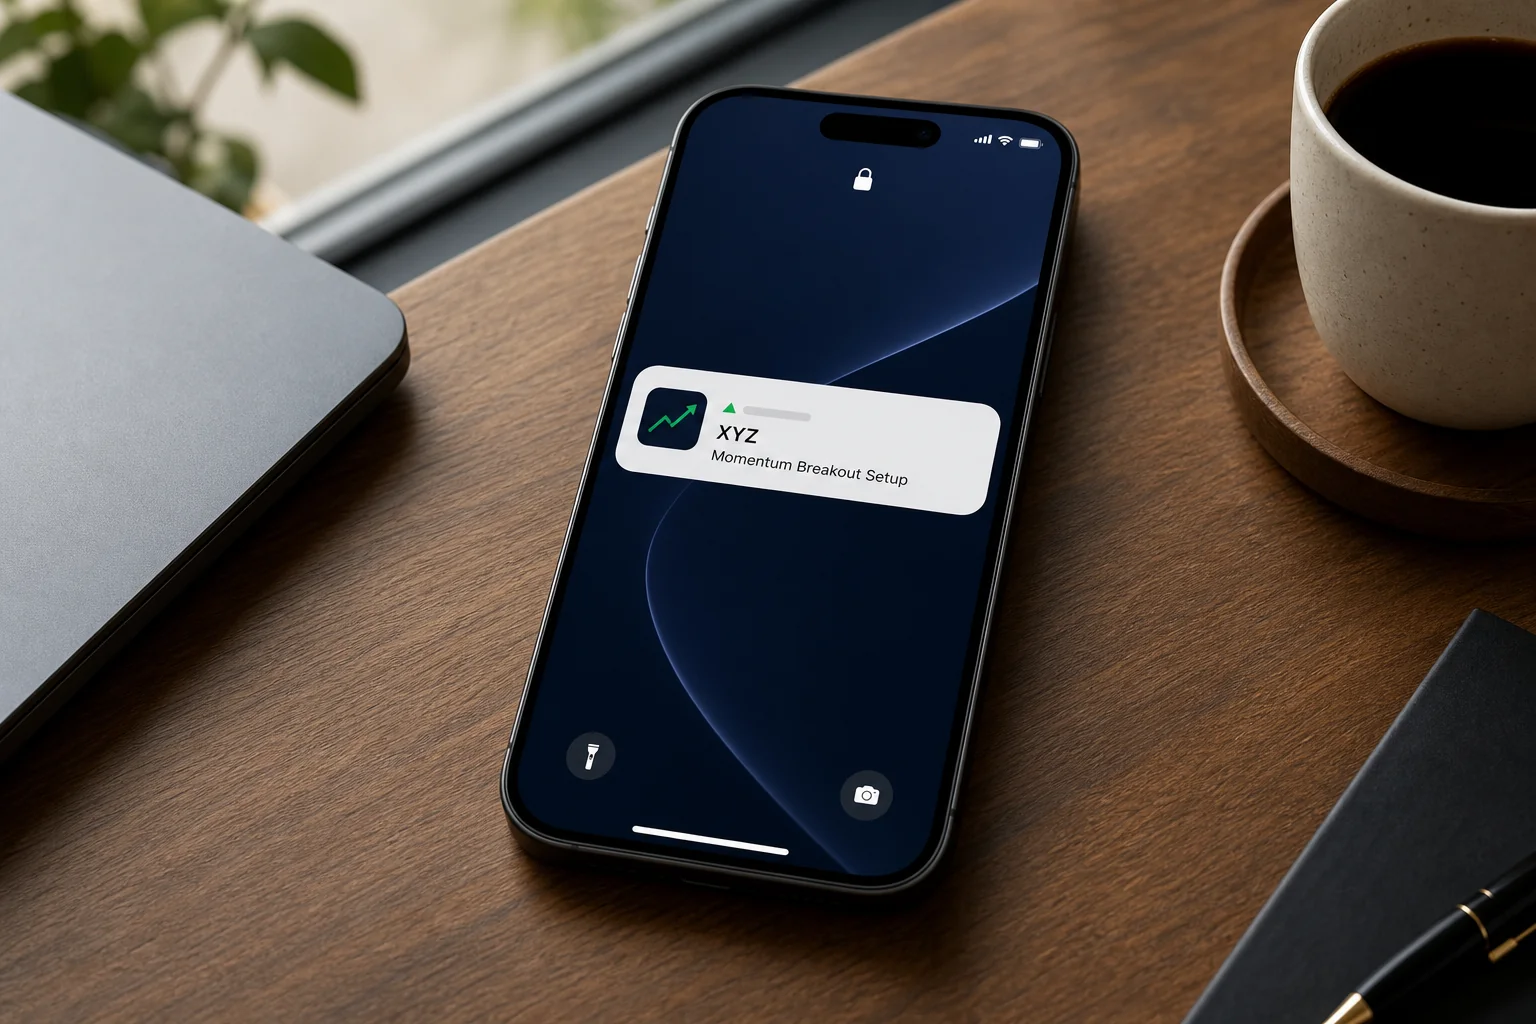
For swing traders with a day job, the Daily timeframe is the right starting point for this screen. You check it in the evening, set a screen-enter alert, and get notified via push and in-app notification when a new ticker qualifies. You are not watching charts during market hours.
What to check on the screen card
- Win Rate above 55% with a meaningful sample size (100+ instances)
- Average Return positive and at least 2x the average loss (check EV)
- Timeframe: Daily for swing trades, not 1m or 5m
- Recent matches: are the tickers that currently qualify in strong sectors?
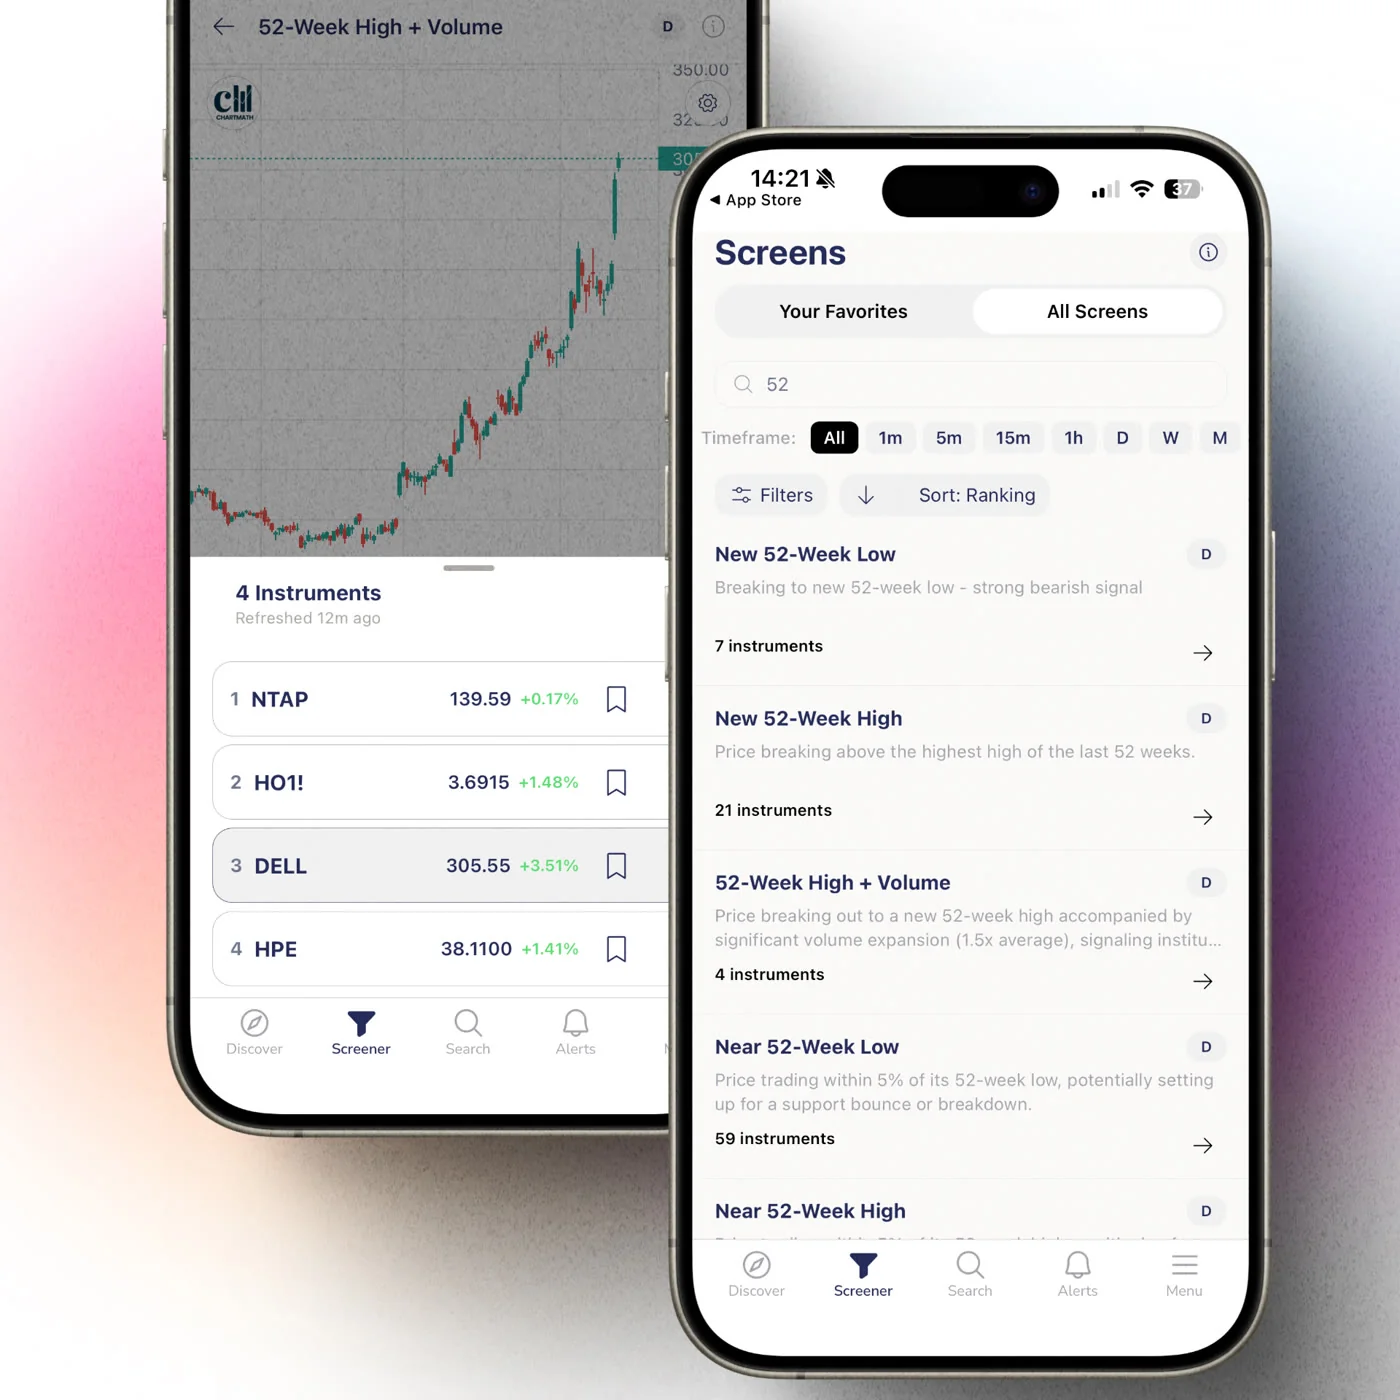
2. Breakout With Volume Confirmation
The second screen type is the breakout with volume confirmation. Price clears a key level, a 52-week high, a multi-week consolidation range, or a prior resistance zone, on above-average volume. The volume spike is what separates a real breakout from a false one.
Without volume confirmation, a price breakout is just a price breakout. It could be a single large order, a thin-float move, or a trap. When volume confirms the move, it means real participation: buyers are stepping in at the new level, not just one actor pushing price through a thin order book.
ChartMath's 52-Week High Breakout screen and Opening Range Breakout (ORB) style screens are examples of this category. The 52-Week High Breakout screen, in particular, is one of the most-referenced setups in the app because the historical data on breakouts to new highs is well-documented in academic and practitioner literature. Stocks making new 52-week highs on elevated volume have historically shown positive momentum over the following weeks.
For more on how the 52-Week High Breakout screen works in practice, see 52-Week High Breakout Screener: Catch Big Moves Early.
The practical workflow for this screen as a small-account swing trader:
- Open the Screener tab in ChartMath and find the 52-Week High Breakout or volume-breakout screen.
- Check the Win Rate, Average Return, and sample size on the screen card. Confirm positive EV.
- Favorite the screen to enable screen-enter alerts. You will get a push and in-app notification when a new ticker qualifies.
- When the alert fires, open the card. Read the screen's rule in plain English alongside its short description and backtested Win Rate. Check the timeframe.
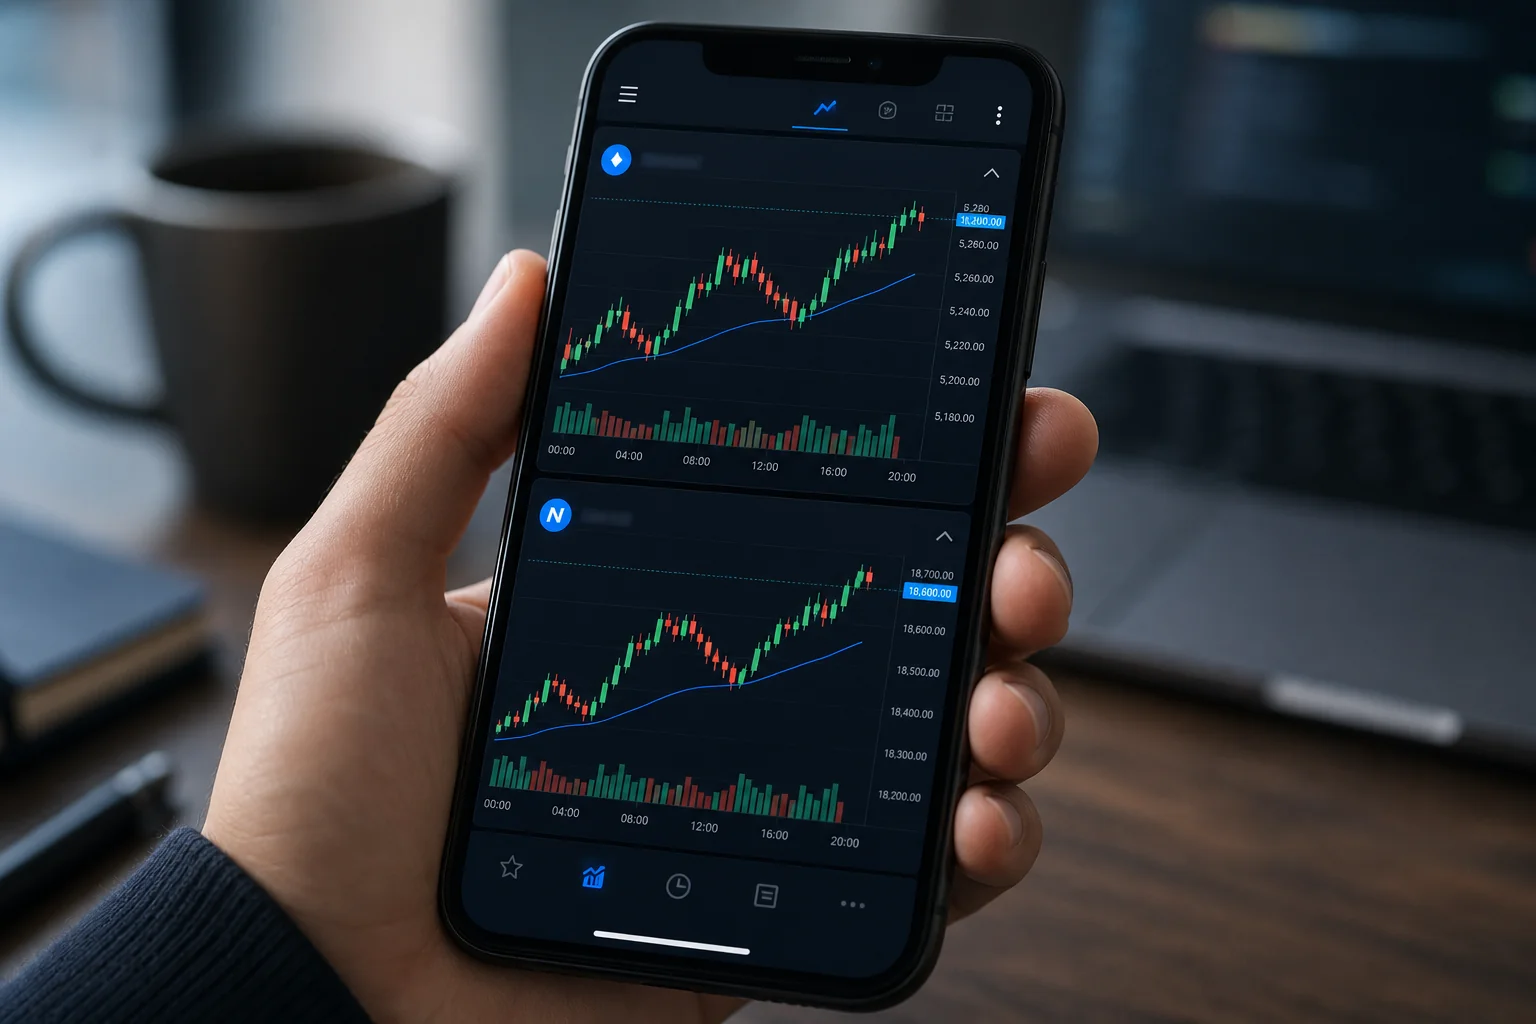
- Verify on your charting platform. Is the volume spike real? Is the breakout level meaningful?
- Size the trade using your 1-2% account risk rule. Set your stop below the breakout level.
Exit types available in ChartMath's strategy configurations include EOD (end of day), N-bar (exit after a fixed number of bars), Stop Loss, Take Profit, and Trailing Stop Loss. The screen card shows the backtested result for each exit configuration, so you can see which exit approach has historically performed best for that specific setup.
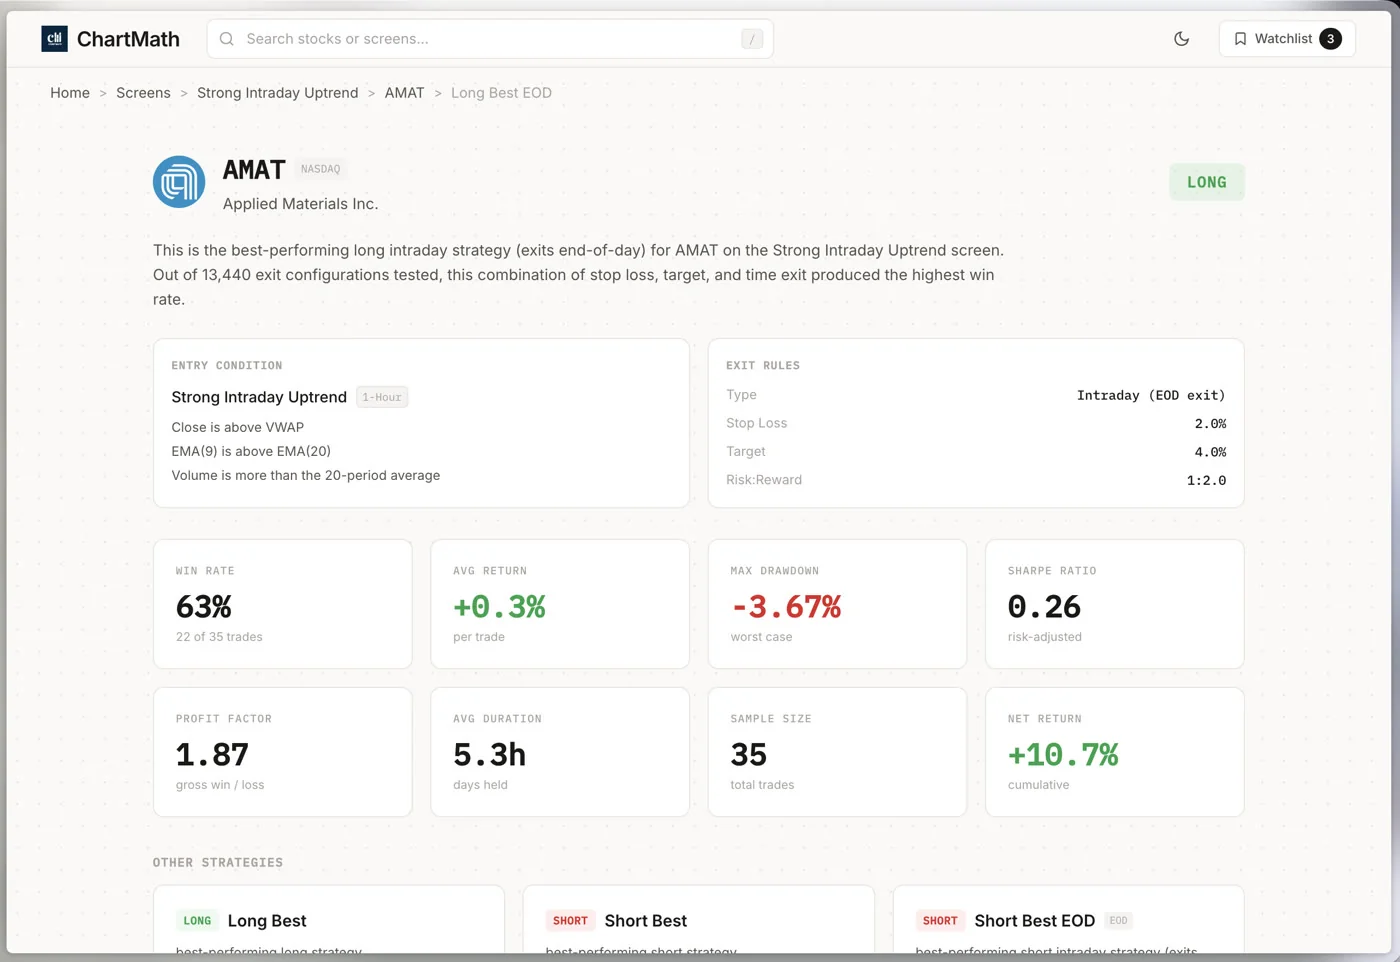
3. Relative-Strength Leader
The third screen type is the relative-strength leader. This screen looks for stocks that are outperforming the broader market on a rolling basis, names that are going up more than the S&P 500 when the market rises, and holding up better when the market pulls back.
For small accounts, relative strength is a particularly useful filter. You have limited capital, so you want to concentrate it in the market's strongest names. A stock that is lagging the market in an uptrend is telling you something: the buyers who are driving the broader rally are not interested in this name. A stock that is leading the market is telling you the opposite.
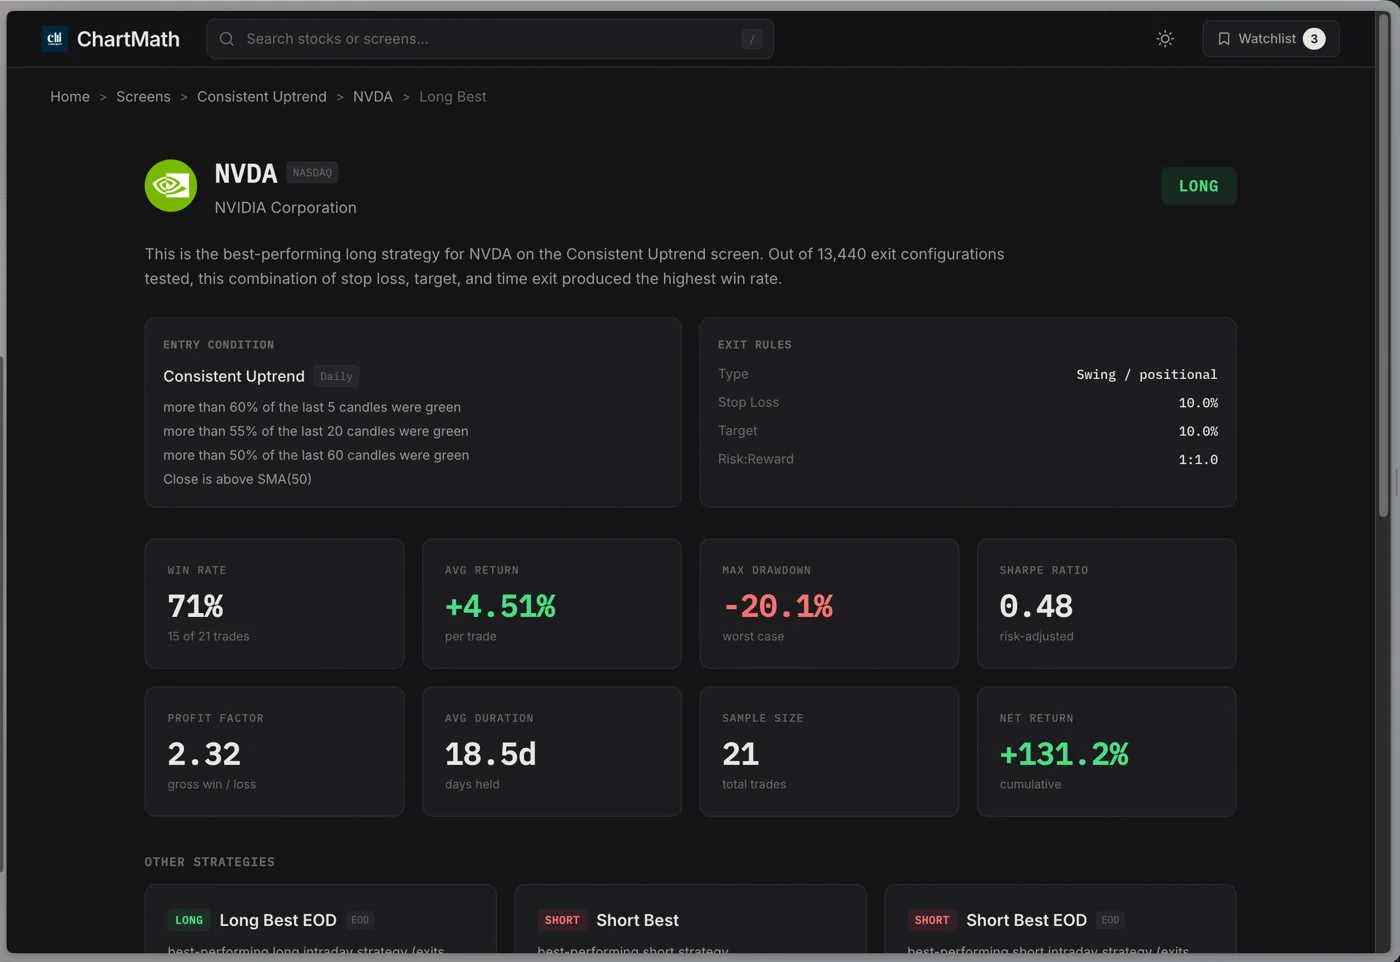
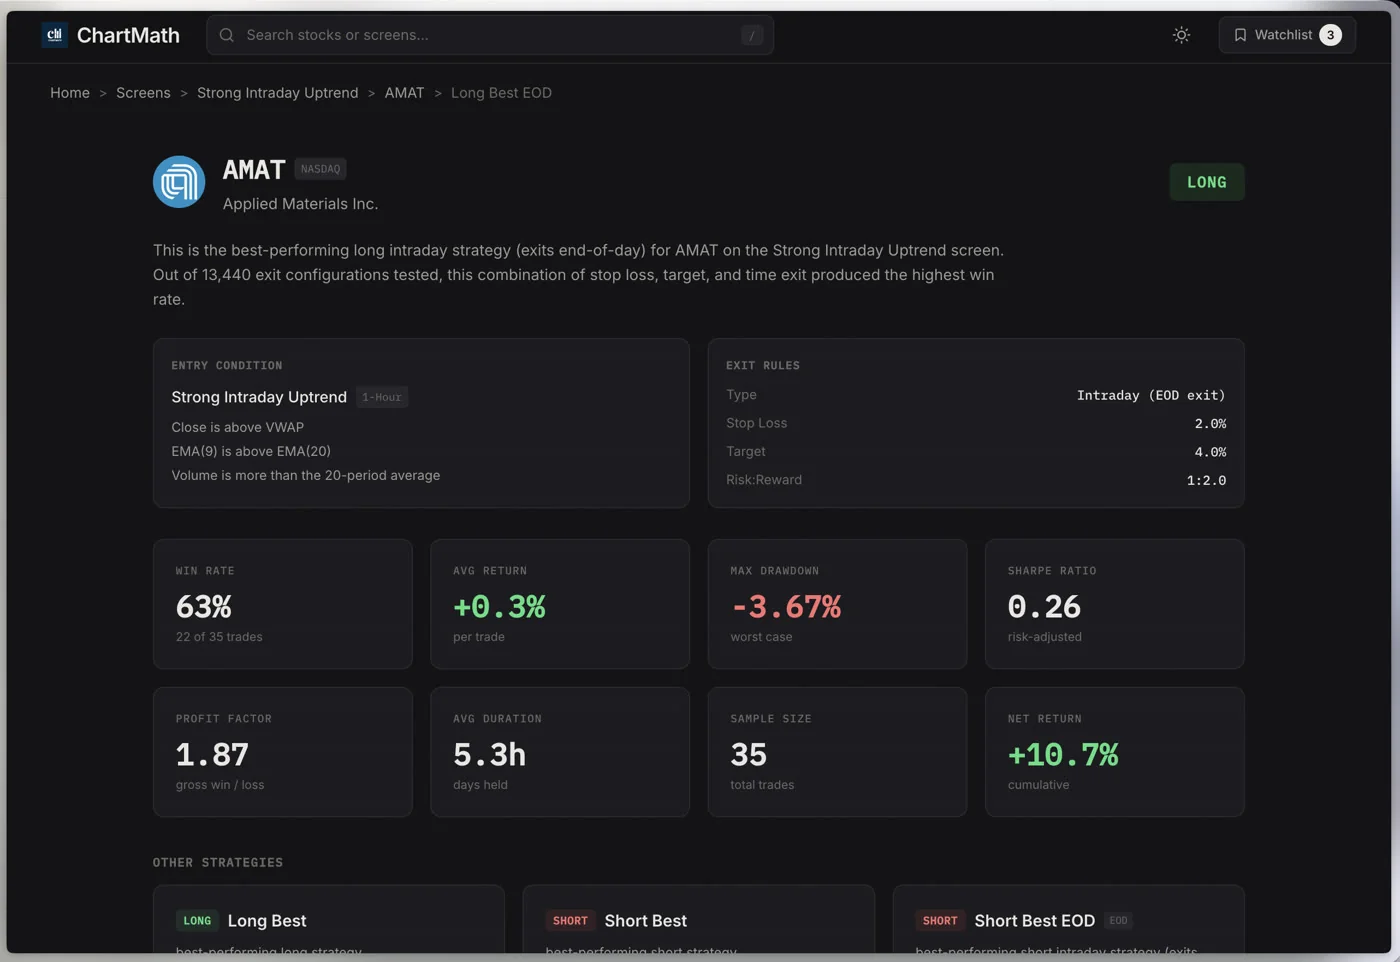
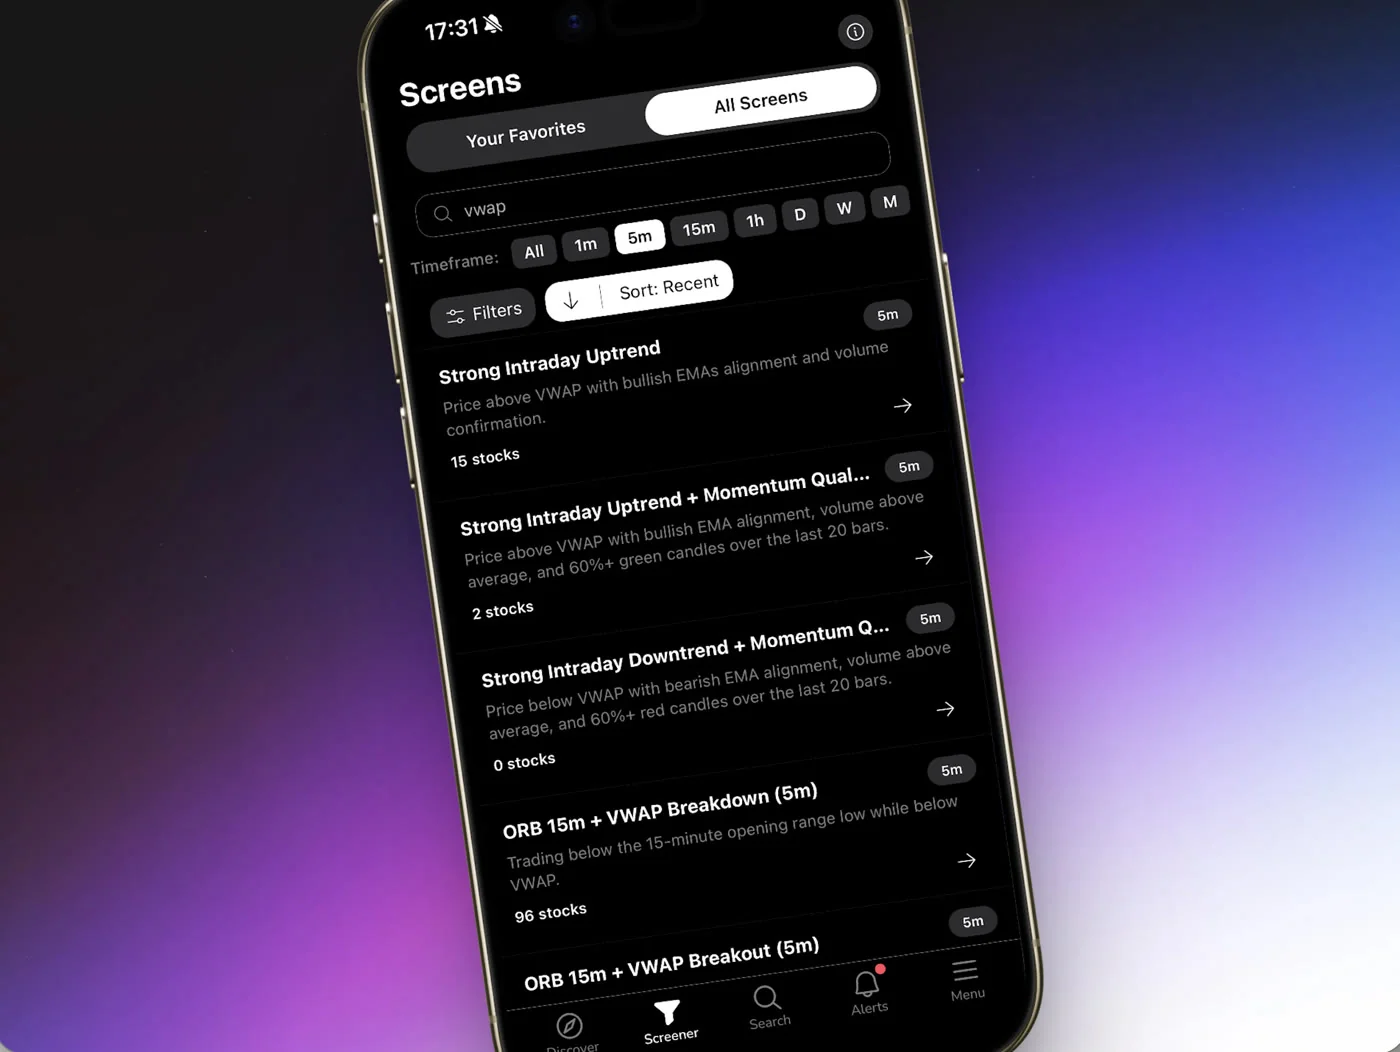
ChartMath's Consistent Uptrend and Strong Intraday Uptrend screens surface stocks that meet relative-strength criteria across the 500+ US equity universe. The Consistent Uptrend screen, as an illustrative example of what the app shows, has historically shown a backtested win rate in the range that makes it one of the higher-confidence screens in the app, but again, check the current sample size and EV on the card before acting.
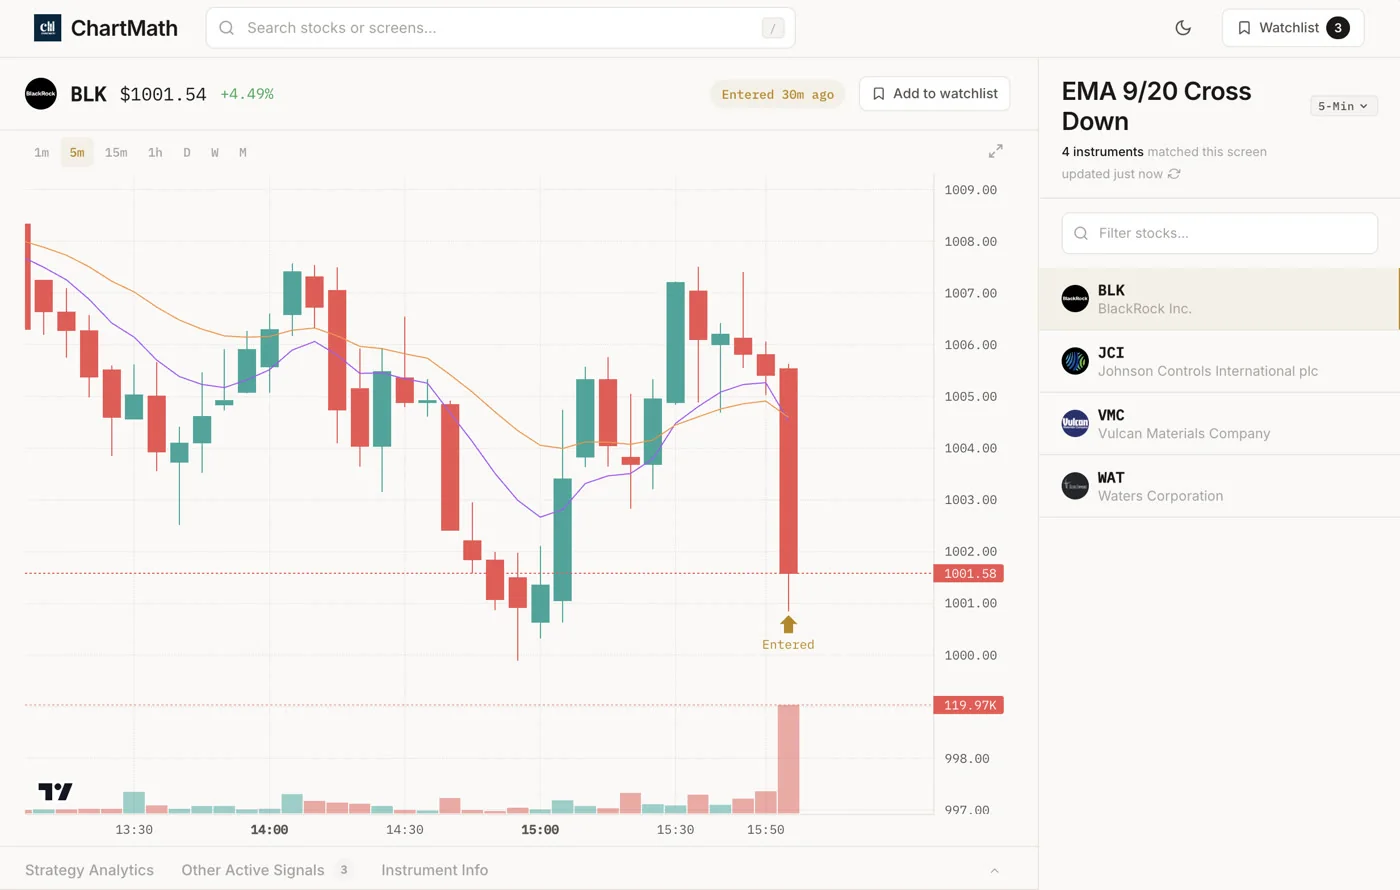
The Discover feed in ChartMath is particularly useful for this screen type. Rather than manually browsing the Screener, the Discover feed surfaces the highest-quality matches across all screens, ranked by backtested reliability and recency. If a relative-strength setup is forming on a stock with strong historical evidence, it will surface in your feed with the matched screen's rule in plain English and its backtested Win Rate.
Pairing relative strength with a pullback entry
The most effective way to use a relative-strength screen for swing trading is to combine it with a pullback entry. Find the relative-strength leaders using the screen, then wait for a pullback to a rising moving average (Screen 1) before entering. You get the best of both: you are in a strong stock, and you are entering at a lower-risk point in its cycle rather than chasing it at the top of a move.
This combination approach is exactly the kind of multi-screen workflow that Daily Chart Swing Trade Setups: A Scanner Workflow covers in detail.
The Backtested Screen Is the Selectivity the PDT Cap Used to Force on You
Here is the honest framing of what changed on June 4, 2026: the PDT rule did not make small-account traders better. It made them more selective by limiting their options. That is a meaningful distinction.
Selectivity imposed by a rule is fragile. The moment the rule disappears, so does the selectivity. Selectivity imposed by evidence is durable. If you only take trades where the screen has a documented positive EV and a sample size above 100, that filter holds regardless of what FINRA does.
The three screens above are not magic. They are filters. They reduce the universe of possible trades from "everything that looks interesting" to "setups with historical evidence of edge." That reduction is the point. A small account cannot afford to be wrong often. A backtested screen with a 65%+ win rate and positive EV is not a guarantee, but it is a meaningful improvement over trading on pattern recognition alone.
ChartMath is a copilot, not an autopilot. It surfaces the setup, shows you the evidence, and states the matched screen's rule in plain English. You decide whether to take the trade. You execute in your own brokerage. There is no broker connection, no order placement, no automation. The discipline is still yours, the tool just gives you better information to apply it to.
For traders who want to understand how to build this kind of systematic approach from the ground up, Swing Trading with a Full-Time Job: A Real System is the right starting point.
Run These Screens as a Repeatable Weekly Routine
A screen you check once is a curiosity. A screen you run on the same schedule every week is a process. The difference between traders who improve and traders who spin their wheels is usually not the quality of their tools, it is whether they use those tools consistently.
Here is a five-step weekly routine built around the three screens above:
- Sunday evening (15 minutes): Open ChartMath's Screener tab. Navigate to each of the three screens, moving average pullback, volume breakout, and relative-strength leader. Check the current matches. Read the Win Rate, Average Return, and sample size on each card. Note any tickers that look interesting for the week ahead.
- Sunday evening (5 minutes): Favorite all three screens if you haven't already. This enables screen-enter alerts. You will receive a push and in-app notification the moment a new ticker qualifies for any of these screens during the week.
- During the week (as alerts arrive): When an alert fires, open the card. Read the plain-English explanation. Check the timeframe and the backtested metrics. If the setup meets your criteria (positive EV, meaningful sample size, ticker in a strong sector), verify it on your charting platform and size the trade using your 1-2% risk rule.
- During the week (trade management): Set your stop and target at entry. Use one of the exit types that matches the screen's backtested configuration, Stop Loss, Take Profit, or Trailing Stop Loss. Do not move your stop based on how the trade feels. The screen's backtested exit is the reference point.
- Friday evening (10 minutes): Review which alerts fired, which you took, and what the outcome was. Note whether you followed your rules. This is not about judging individual trades, it is about tracking whether your process is consistent. For a structured approach to this review, How to Run a Weekly Trading Review in 20 Minutes has a complete framework.
The total time commitment for this routine is under 30 minutes per week of active decision-making, plus the time you spend on individual trade verification when alerts fire. That is a realistic schedule for a trader with a day job. It is also a schedule that compounds: each week's review makes the next week's decisions slightly better.
For a broader look at building this kind of workflow, How to Build an Efficient Trading Workflow in 2026 covers the full infrastructure.
You can browse all 200+ curated screens on the ChartMath web screener without signing in, it is a free, read-only browse layer. When you are ready to set alerts and use the Discover feed, download the iOS or Android app. ChartMath is free during beta: every screen, every backtest, every alert, no card and no feature gates. A paid plan is coming soon; beta users get founding pricing.
Frequently Asked Questions
Do I need a $25,000 account to swing trade after the PDT change?
No. The $25,000 minimum was specific to the PDT rule, which was eliminated effective June 4, 2026. The only remaining equity requirement for margin accounts is the pre-existing $2,000 minimum. Swing trading, holding positions overnight rather than opening and closing within the same session, was never subject to the PDT rule, so the change does not directly affect swing trading mechanics. It does, however, remove the constraint that was pushing small-account traders toward swing trading by default. The case for swing trading with a small account is now a choice, not a forced outcome, which makes the evidence-based approach described in this article more important, not less.
What is a backtested win rate and why does it matter for small accounts?
A backtested win rate is the percentage of historical instances where a specific technical setup produced a positive return by a defined exit condition, measured across a fixed universe of instruments and timeframes. It matters for small accounts because thin capital cannot absorb a long string of losses. A screen with a documented win rate above 60% and a positive expected value gives you a statistical basis for expecting more winning trades than losing ones over a large enough sample. It does not guarantee any individual trade will work. But it is a meaningful improvement over trading setups with no historical evidence at all. For more on this, see How to Build Winning Backtesting Strategies: A Complete Guide.
How many screens should I follow as a small-account trader?
Three to five screens is a reasonable starting point. More screens mean more alerts, which can lead to alert fatigue and worse decision-making. The goal is not to see every setup, it is to see the best setups on the screens with the strongest historical evidence. Start with the three screen types described in this article, run them for four to six weeks, and add more only when you have a clear process for evaluating and acting on the alerts you are already receiving.
Does ChartMath place trades for me?
No. ChartMath is a copilot, not an autopilot. It surfaces setups, shows you the backtested evidence, and sends alerts when a ticker qualifies. You decide whether to take the trade and execute it in your own brokerage. There is no broker connection and no order placement. The tool gives you better information; the discipline is still yours.
Is ChartMath free to use?
ChartMath is free during beta, every screen, every backtest, every alert, no card and no feature gates. A paid plan is coming soon, and beta users get founding pricing. When the paid plan launches, there will be a 14-day free trial with no card required. You can start browsing screens right now at chartmath.com/screens without creating an account.
The PDT rule is gone. The discipline it accidentally enforced is not coming back on its own. For small-account traders who want to trade systematically rather than reactively, backtested swing trading screens are the replacement: a self-imposed filter built on historical evidence rather than regulatory constraint. The three screen types above, pullback to a rising moving average, breakout with volume confirmation, and relative-strength leader, give you a starting framework. The weekly routine gives you a process to run them consistently.
Browse all 200+ curated screens at chartmath.com/screens, or download the ChartMath app to set alerts and start running your first backtested swing routine this week. Free during beta, no card required.

Ankush Jindal
LinkedInSee these setups live in ChartMath
200+ curated screens with backtest data. 14-day free trial.