Bollinger Bands: Two Trades, One Indicator
Bollinger Bands measure how much a stock's price is moving, not which way it's headed. The bands widen when volatility rises and squeeze tight when it falls, and a touch on either band is a volatility event, not a buy or sell signal by itself. Mean reversion at the bands and squeeze breakouts are two different trades hiding inside one indicator, and confusing them is why so many Bollinger setups lose money.
Key Takeaways
- The bands are math, not a forecast: a 20-period simple moving average plus and minus two standard deviations, so they track volatility, not direction.
- A squeeze predicts movement, not direction: bandwidth contraction says a move is coming, and you need a separate bull rule and a separate bear rule to catch which way it goes.
- Band touch alone is a weak signal: in a real downtrend, price can ride the lower band for weeks without ever bouncing.
- Confirmation is what separates a trade from a guess: a higher low, a reclaim of the band, or an oversold reading behind the touch changes the odds meaningfully.
- Timeframe changes what a touch even means: a 1-minute lower-band tag is noise most days; a Daily or Weekly tag is a structural level worth watching.
Bollinger Bands At a Glance
| Trade type | What triggers it | What confirms it | Common failure mode |
|---|---|---|---|
| Mean reversion (raw touch) | Price closes at or below the lower band | None by default | Price rides the band lower for weeks in a downtrend |
| Mean reversion (confirmed) | Price touches the lower band | Higher low, band reclaim, or RSI oversold reading | Confirmation lags, entry is later and smaller |
| Squeeze breakout (bull) | Bandwidth contracts, then price breaks the range to the upside | Close beyond the band with expanding volume | Fakeout back into the range |
| Squeeze breakout (bear) | Bandwidth contracts, then price breaks the range to the downside | Close beyond the band with expanding volume | Fakeout back into the range |
| Centerline (basis) | 20-period SMA | N/A, it's the reference line | Not a trade signal on its own |
| Outer bands | SMA ± 2 standard deviations | N/A | Width changes with volatility, not price level |
Bollinger Bands sit on more chart-pattern screens than almost any other overlay because they're one of the few indicators that describe volatility instead of momentum. That's also why they get misread. Traders see a line and treat it like a fence, when it's closer to a weather report.
What Bollinger Bands Actually Measure
A Bollinger Band setup is a centerline, usually a 20-period simple moving average, with two outer bands plotted at plus and minus two standard deviations of price around that average. StockCharts describes them as a tool for confirming trend strength or spotting turning points, not as a standalone system. Investopedia makes the same point: a touch of the upper band can signal overbought conditions and a touch of the lower band can signal oversold conditions, but neither is a trade on its own.
The part traders skip is what a standard deviation actually does. It measures how spread out recent closes are from the average. When prices barely move, the spread shrinks and the bands pull in tight. When prices swing hard, the spread grows and the bands flare out. Nothing about that math looks at where price is headed next.
That's why a squeeze, the bands pulling in close to the centerline, is a volatility statement, not a direction call. It tells you the market has gone quiet and something usually follows quiet. It says nothing about whether that something is a breakout up or a breakdown down. Traders who forget this buy every squeeze expecting an upside pop and get burned roughly half the time.
Why This Matters for the Two Trades You Actually Take
Once you accept that the bands describe volatility rather than direction, the two common Bollinger trades stop looking like variations of the same idea. One trade bets that price snaps back toward the average after stretching too far. The other bets that a quiet range is about to break, in either direction. They need different confirmation, different risk placement, and honestly, different mindsets.
Trade One: Mean Reversion at the Bands
Mean reversion at the bands works when a stretched price snaps back toward its average, and touching the lower band alone doesn't prove that snap is imminent. In a real downtrend, price can ride the lower band for weeks, so the touch needs a second piece of evidence, like a higher low or an oversold reading, before it's tradeable.
Here's the trap. A stock drops hard, tags the lower band, and a trader buys because "it's oversold." Sometimes that works. Often the stock is in a genuine downtrend, and the lower band just keeps sliding down with it. Price hugs that band candle after candle, taking out every buyer who thought the tag meant a bottom. The band isn't a floor. It's a moving line that follows the trend, including a bad one.
ChartMath runs the raw version of this signal as the Below Lower Bollinger (Daily) screen, which flags any stock closing under its lower band with no other filter attached. It's useful as a baseline, and it's a good place to see exactly how often an unconfirmed touch fails on its own.
What Confirmation Actually Looks Like
Confirmation means adding a second, independent signal before you treat the touch as a reason to buy. Three that hold up reasonably well:
- A higher low forms: price makes a lower low, then a subsequent low that's higher than the last one, showing sellers are losing steam.
- Price reclaims the band: a close back inside the lower band, rather than a wick that dips below and closes back inside on the same bar.
- An oversold reading lines up: RSI or a similar momentum reading sits in oversold territory at the same time as the touch, adding a second, unrelated data point to the same read.
ChartMath's Bollinger Lower Bounce and Oversold Confirmation (Daily) screen builds that second layer in directly, requiring the oversold confirmation before the alert fires. Comparing its backtested win rate against the raw touch screen is the fastest way to see what confirmation is actually worth in dollars, not just theory.
Trade Two: The Squeeze Breakout
A squeeze breakout trade waits for the bands to contract tightly, then trades the direction price actually breaks, rather than guessing ahead of the move. Because a squeeze only tells you volatility is compressed, not which way price resolves, a bull breakout and a bear breakdown need two separate rules, not one rule read two ways.
This is where a lot of retail traders go wrong. They watch bandwidth shrink, feel the tension building, and pre-commit to a direction based on a hunch about the news cycle or a moving average slope. The squeeze doesn't care about either. It resolves when it resolves, and it resolves in whatever direction the order flow decides.
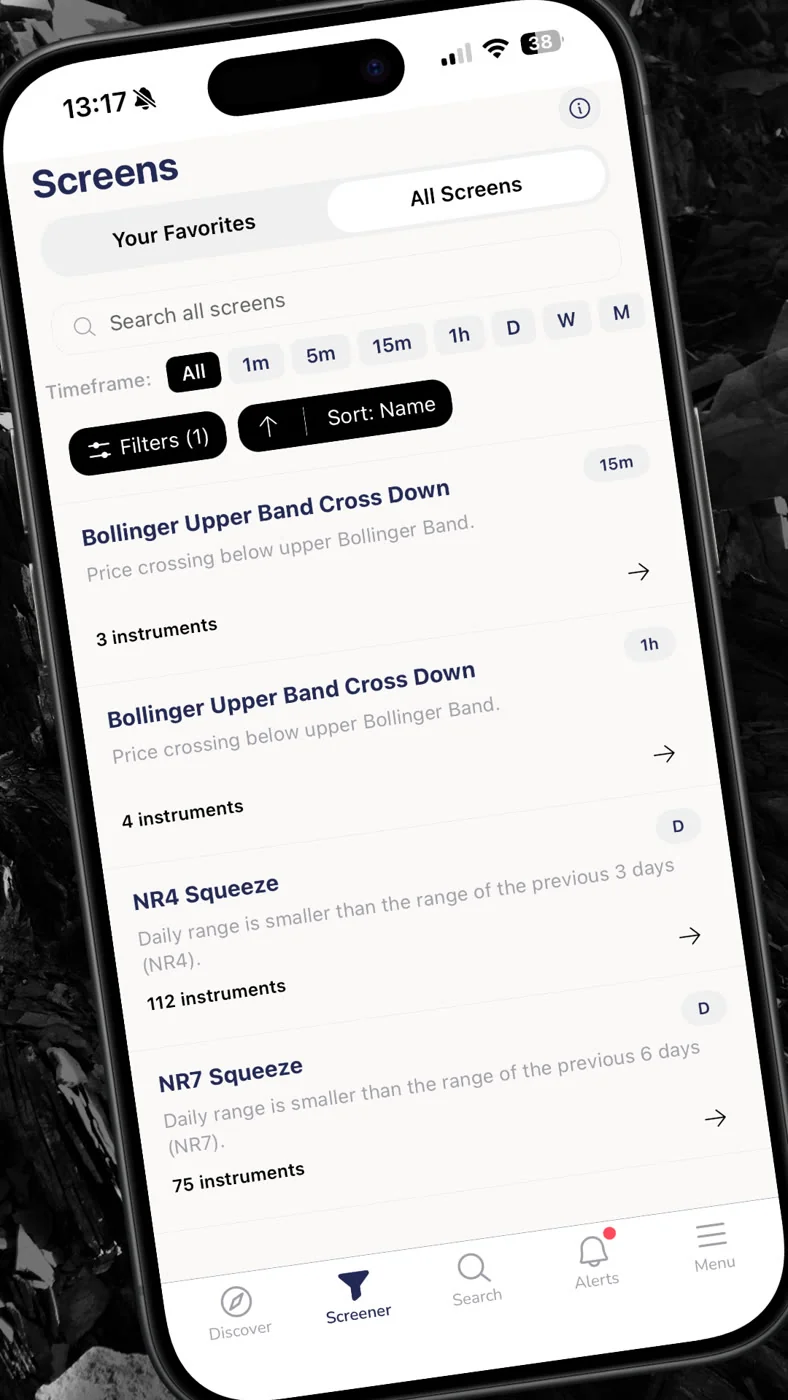
The fix is to treat "a move is coming" and "which way it goes" as two separate questions with two separate answers. ChartMath splits this exactly that way: Bollinger Squeeze Break Bull (Daily) fires only when a compressed range resolves upward, and Bollinger Squeeze Break Bear (Daily) fires only when the same setup resolves down. Same compression, opposite outcome, opposite alert.
The Failure Mode You Need to Plan For
The most common way a squeeze breakout trade loses is the fakeout: price pokes outside the band, traders pile in, and the move snaps back into the range within a day or two. That's why waiting for a close beyond the band, not just an intraday poke, matters. Volume confirmation on the breakout bar helps filter out the weakest fakeouts, though nothing removes them entirely. Some squeezes just fail. That's part of trading volatility, not a flaw you can engineer away.
Why the Timeframe Changes the Rule Entirely
The timeframe you apply Bollinger Bands on changes what a band touch or squeeze actually means, because a 1-minute chart reacts to noise that a Daily or Weekly chart filters out entirely. A lower-band tag on a 1-minute candle can reverse in seconds; the same tag on a Weekly chart reflects weeks of accumulated selling and carries far more weight.
Intraday traders running Bollinger setups on 5-minute or 15-minute bars will see squeezes form and resolve multiple times a session. That's normal on those timeframes, and the confirmation window has to shrink to match, sometimes down to a single following candle. Swing traders working off the Daily chart get fewer signals, but each one tends to hold up longer once confirmed, because it takes more sustained buying or selling pressure to move a 20-day average enough to matter.
This is also why comparing a squeeze on a 1-hour chart against one on a Weekly chart as if they're the same signal is a mistake. They're built from the same formula, but they're measuring compression over completely different time horizons. If you're building a multi-timeframe confirmation routine, treat each timeframe's Bollinger read as its own independent vote, not a rubber stamp on the others. ChartMath runs Bollinger screens across seven timeframes for exactly this reason, so a Daily squeeze and a 1-hour squeeze show up as the distinct signals they are.
How to Actually Trade Bollinger Bands Without Getting Faked Out
You trade Bollinger Bands reliably by pairing every band touch or squeeze with an independent confirmation signal and waiting for a closed candle beyond the band rather than a wick. Skipping either step is how a volatility read gets mistaken for a directional call, which is the single most common Bollinger Band mistake.
A short checklist that holds up across both trade types:
- Never trade a touch or a squeeze in isolation. Attach a second, independent piece of evidence, like RSI, a volume spike, or a structural higher low.
- Wait for a close, not a wick. Intraday pokes beyond the band reverse constantly; closes hold up better.
- Match the setup to the timeframe you actually trade. A day trader on 5-minute bars and a swing trader on Daily bars need different confirmation windows entirely.
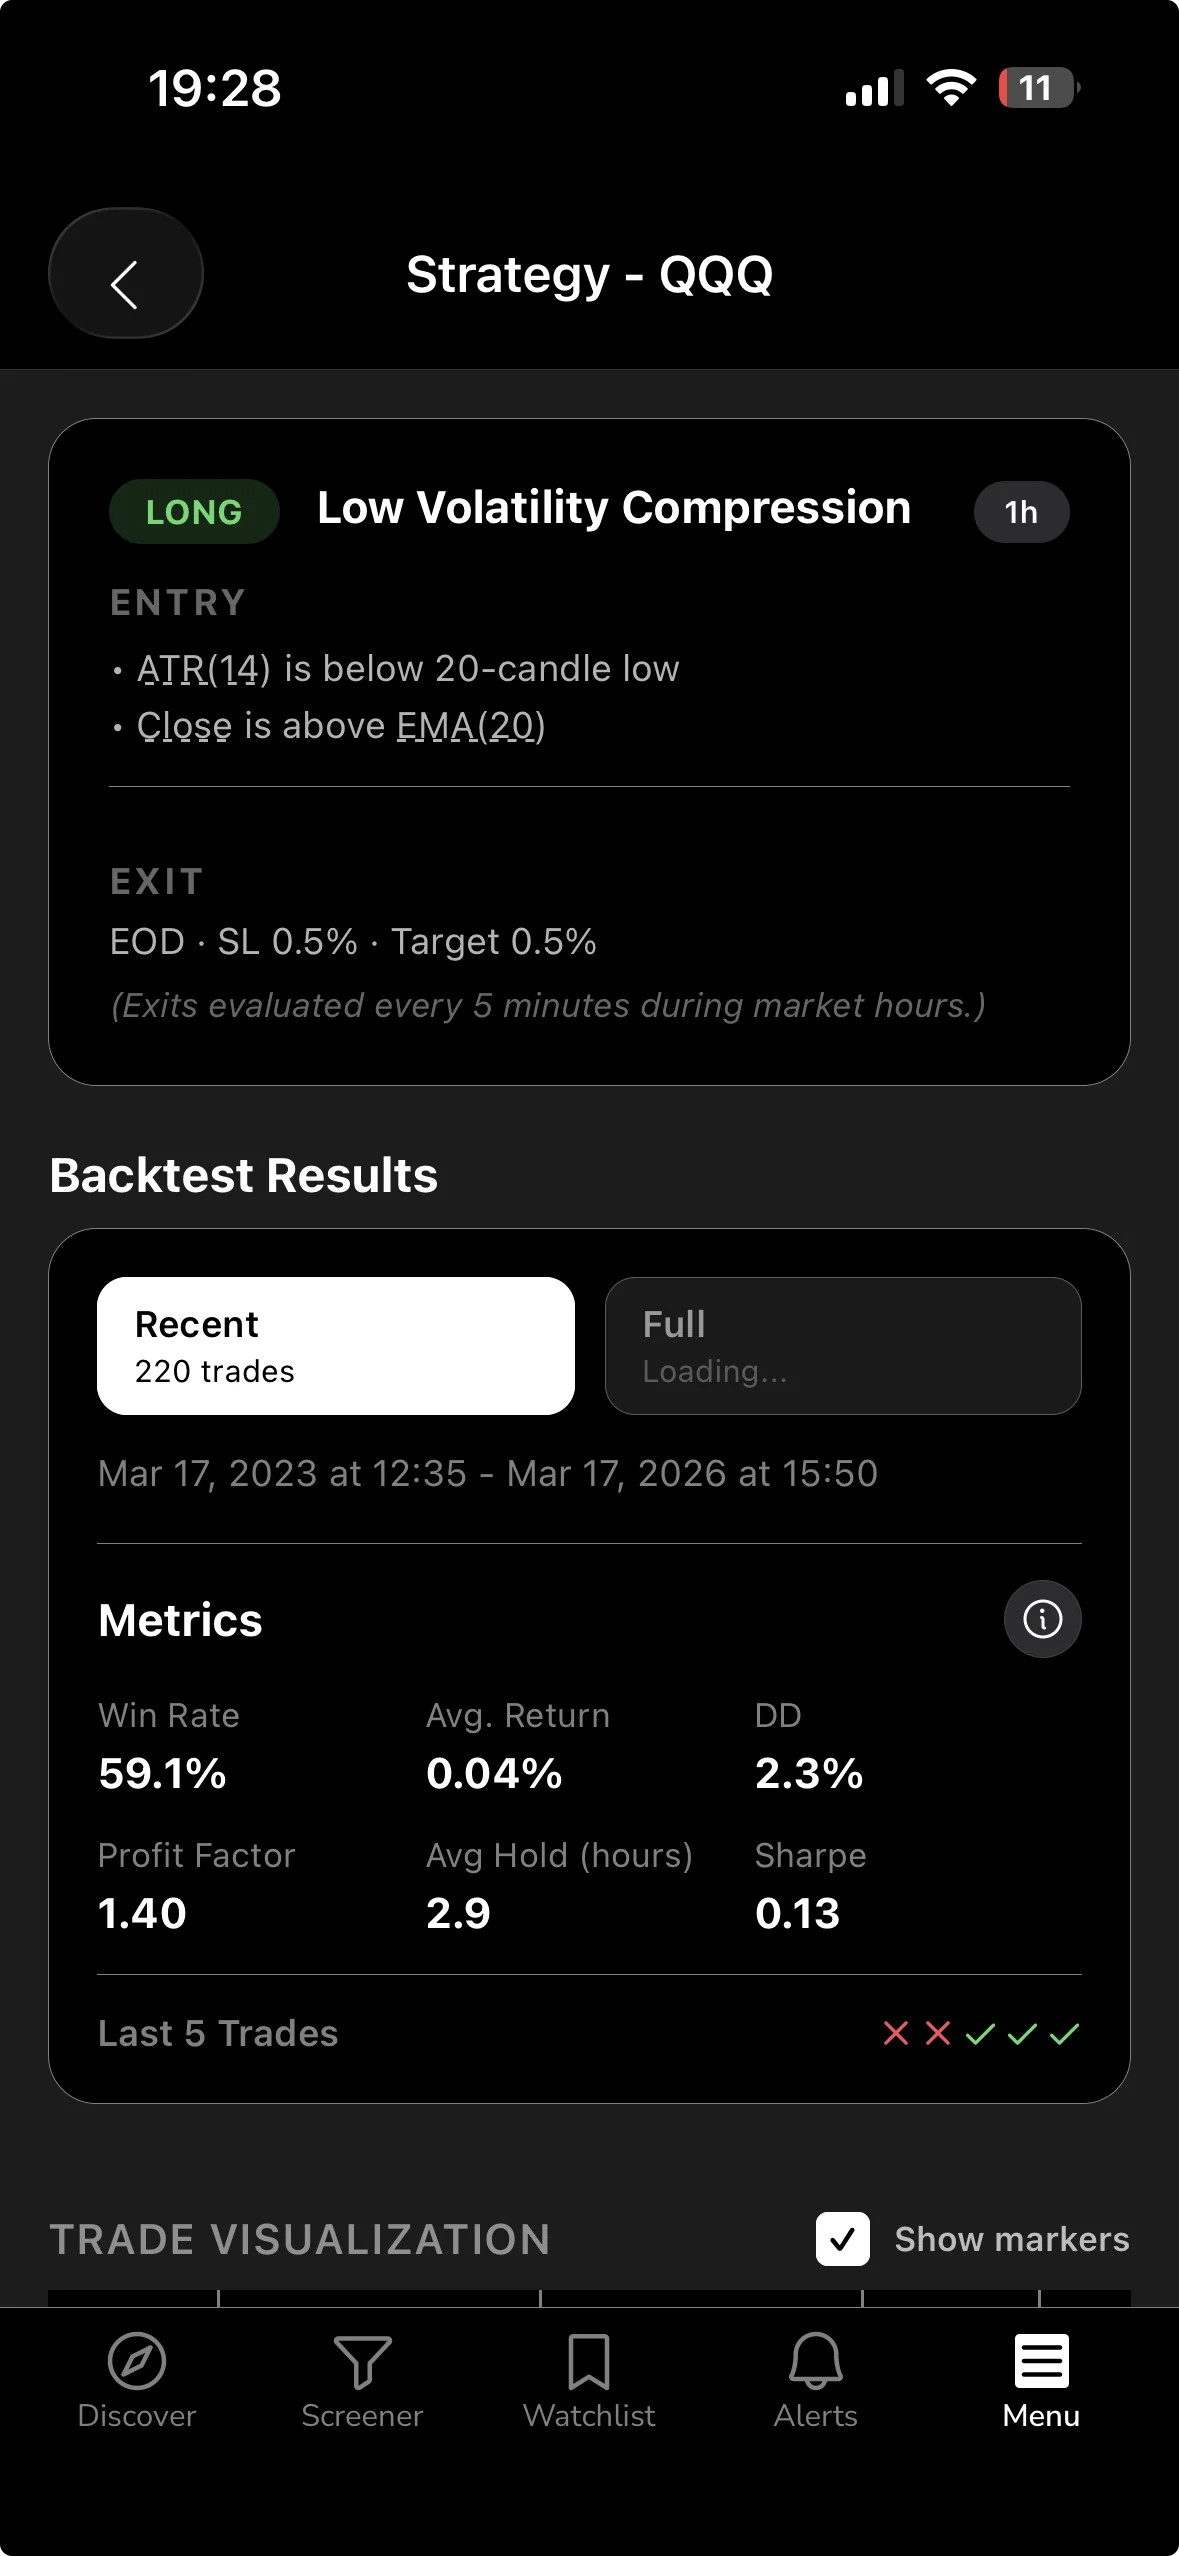
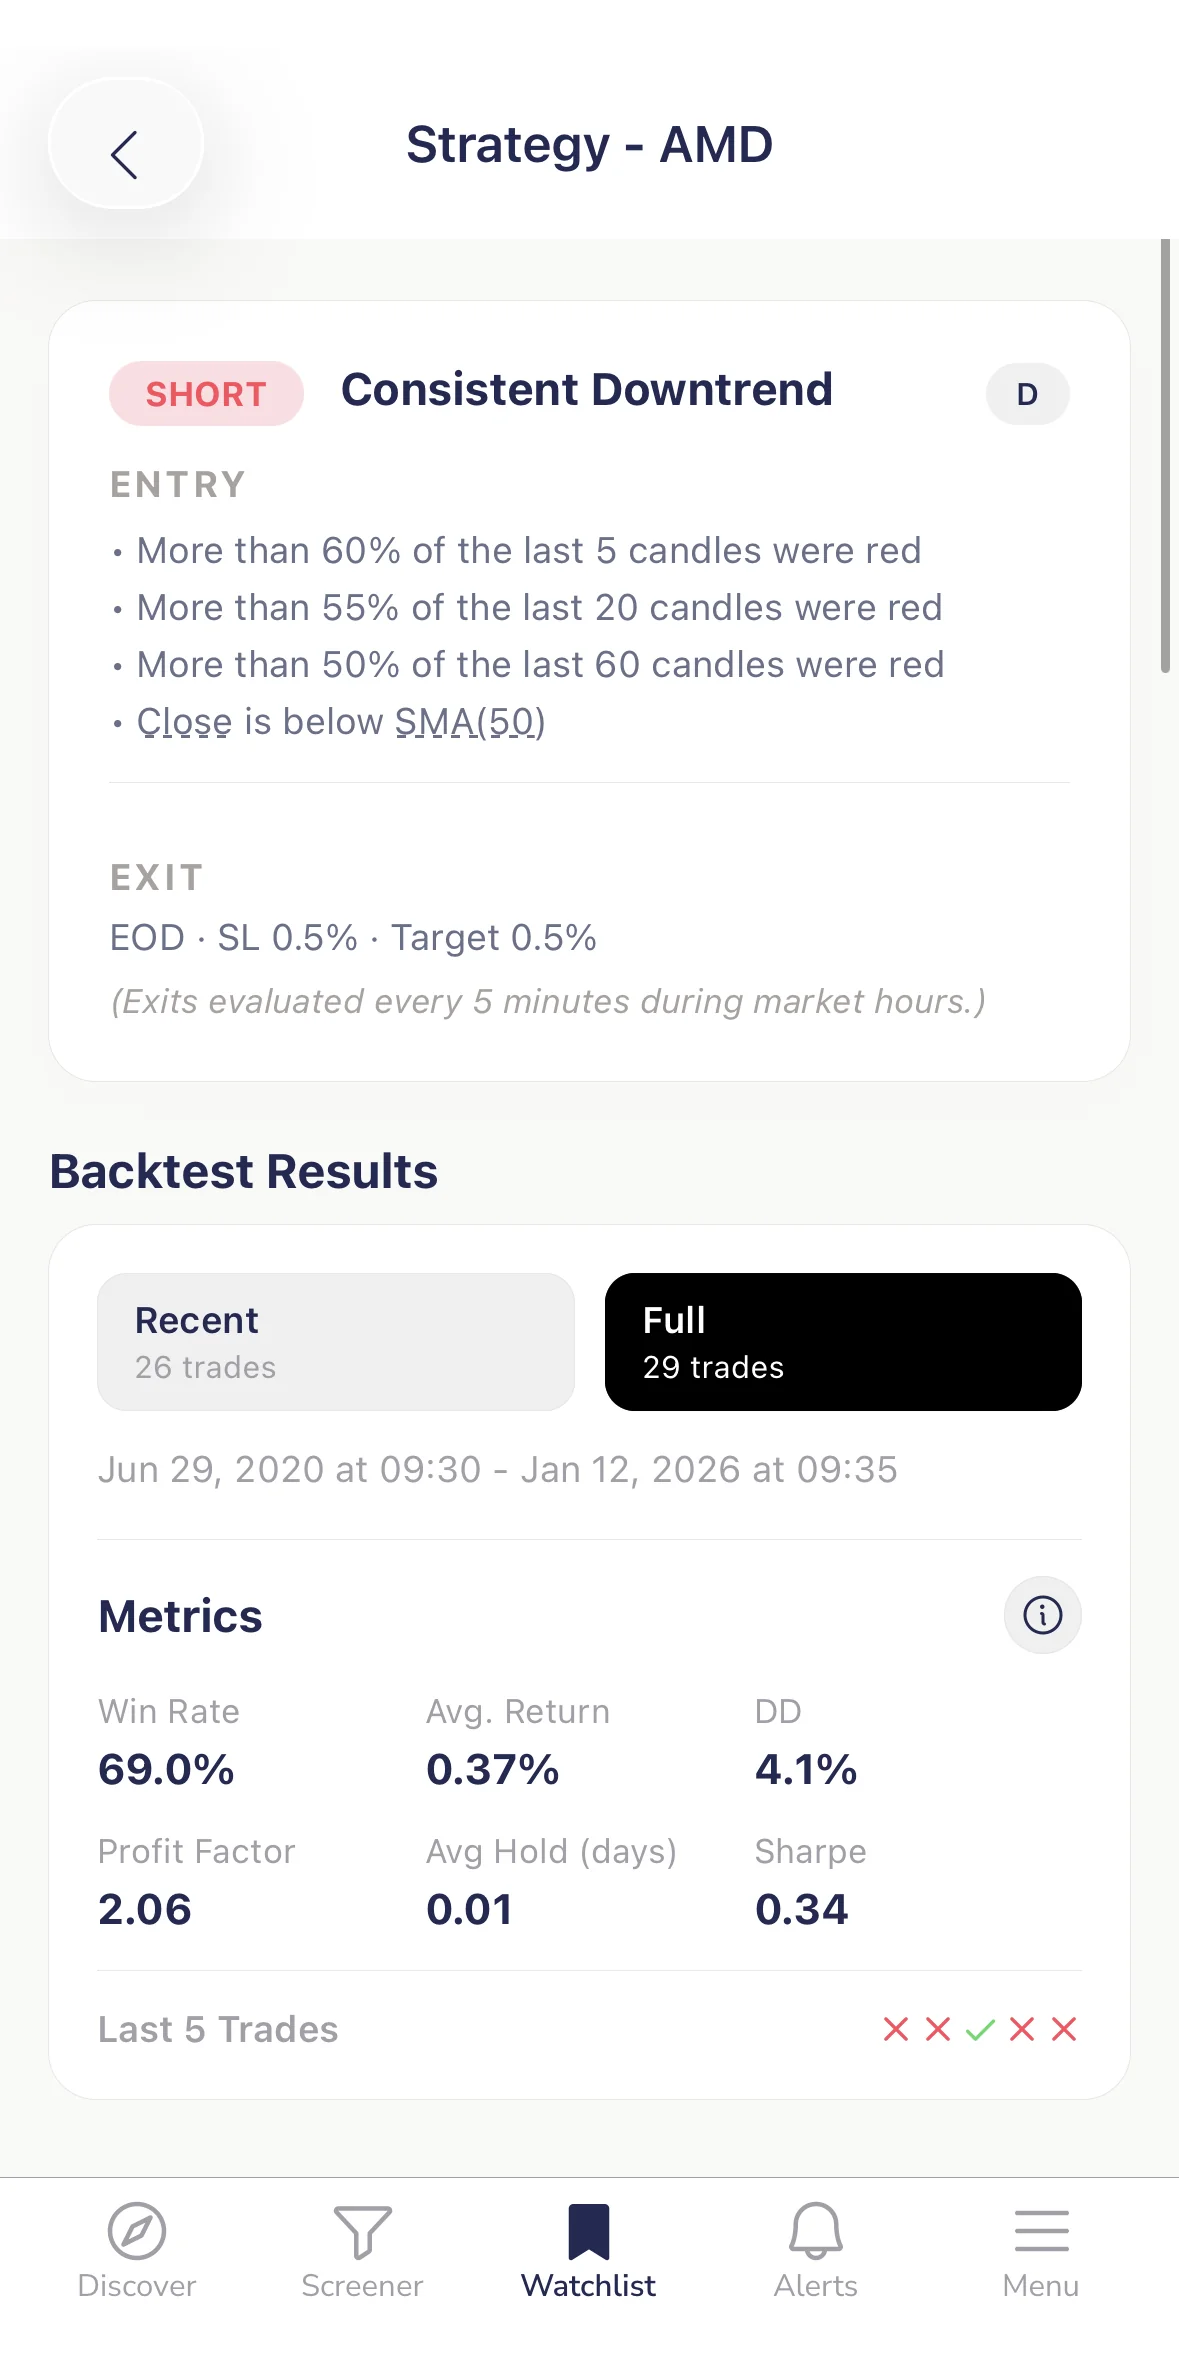
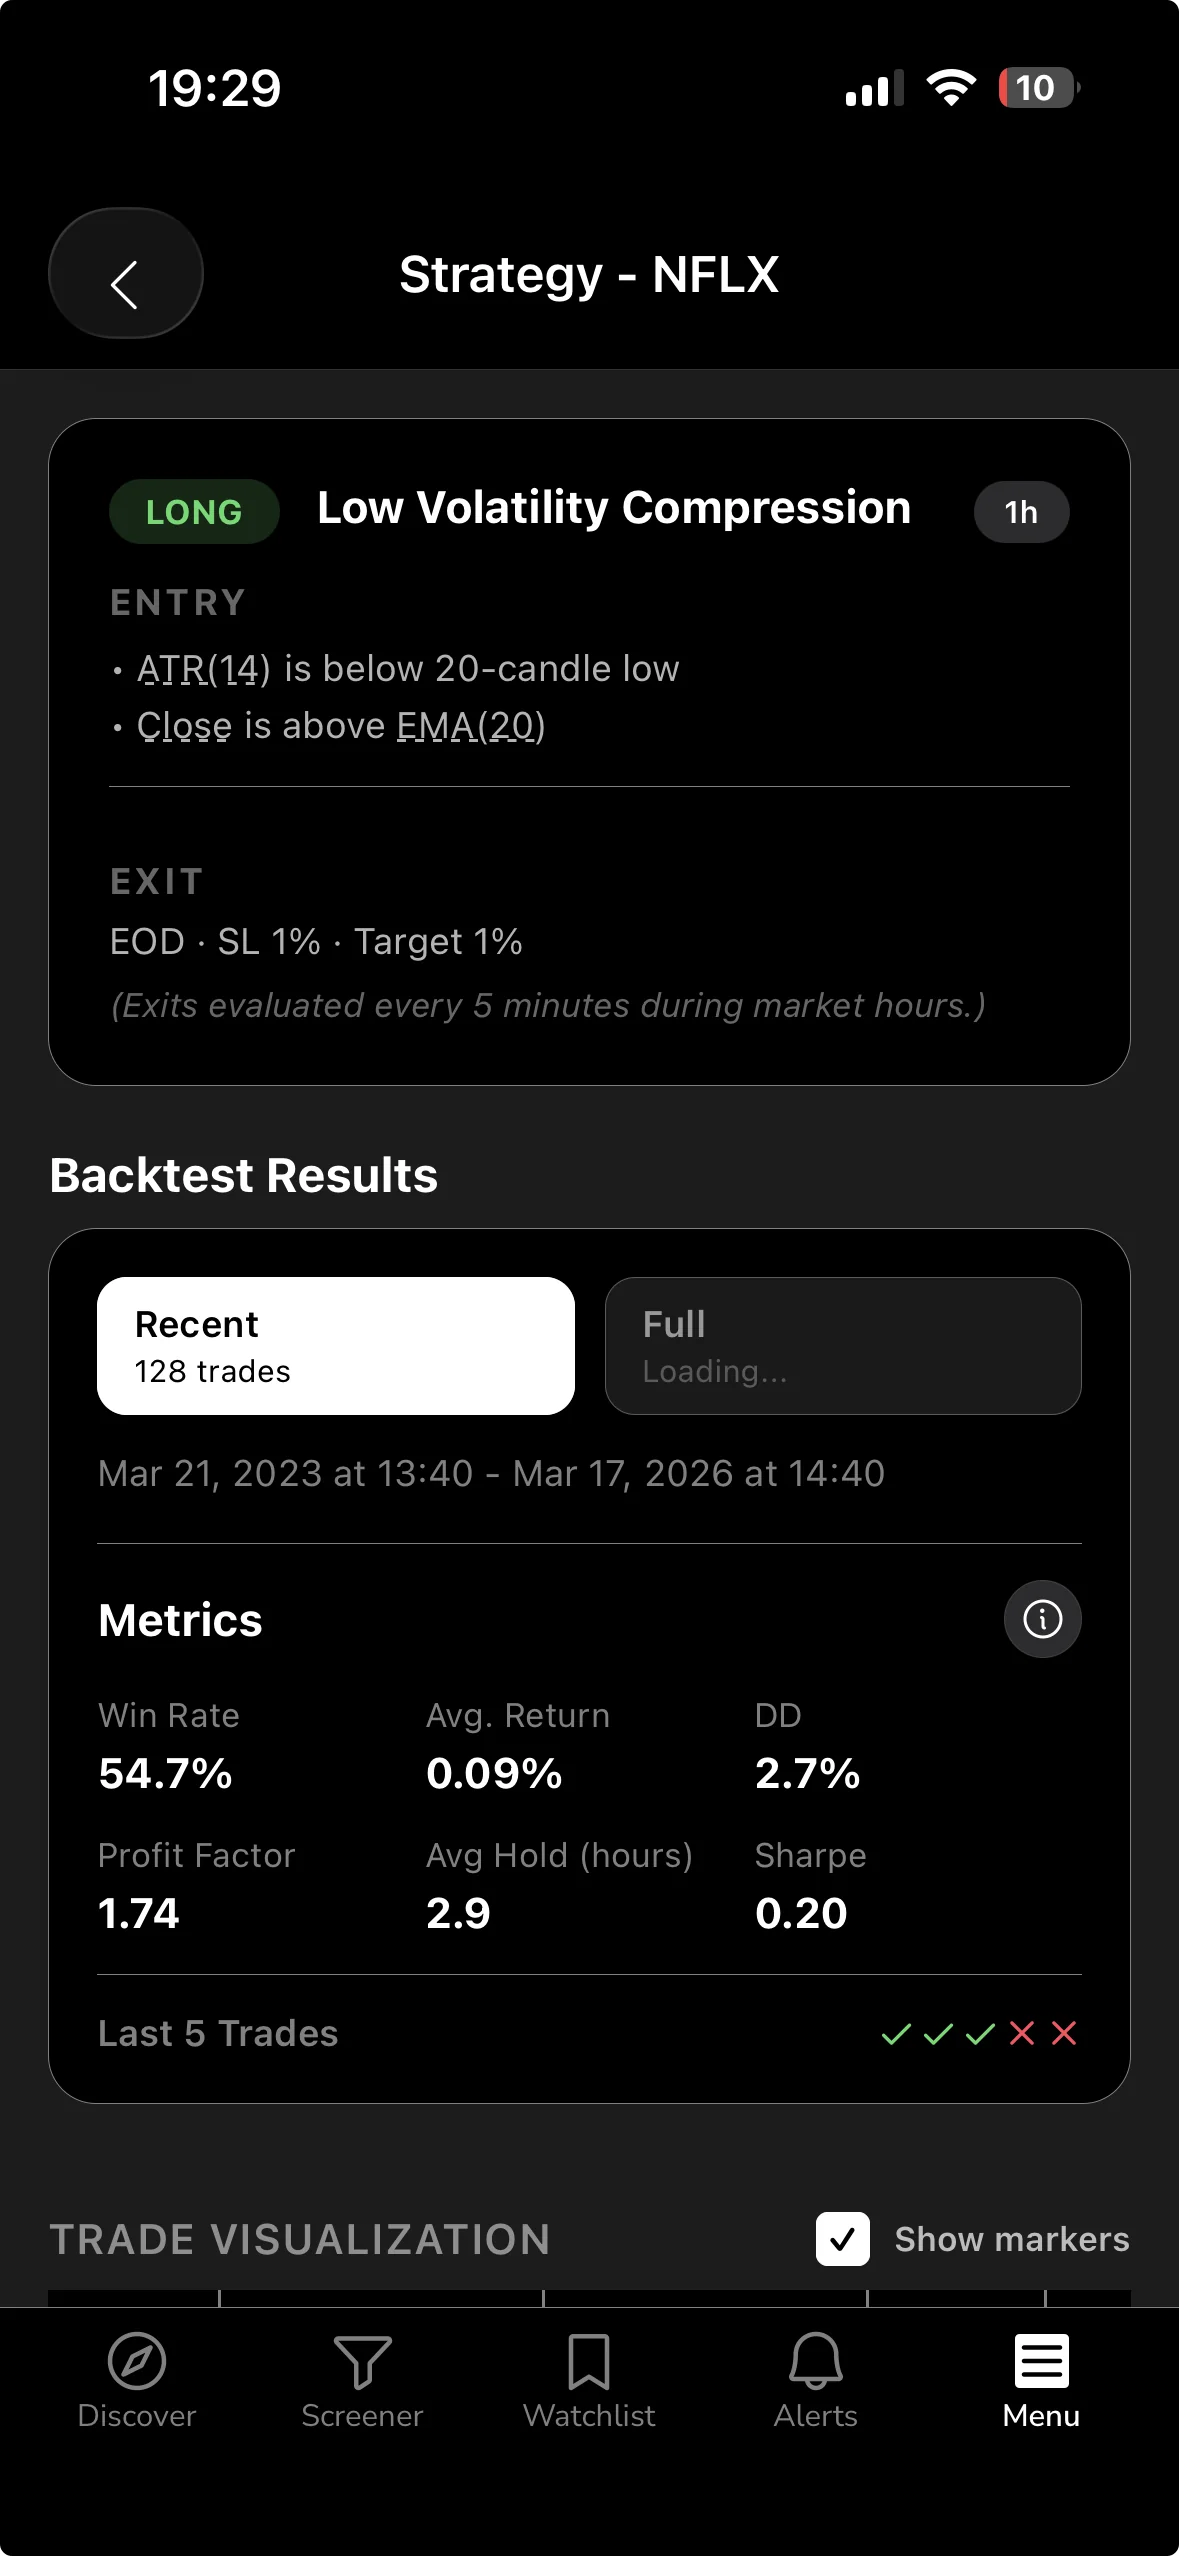
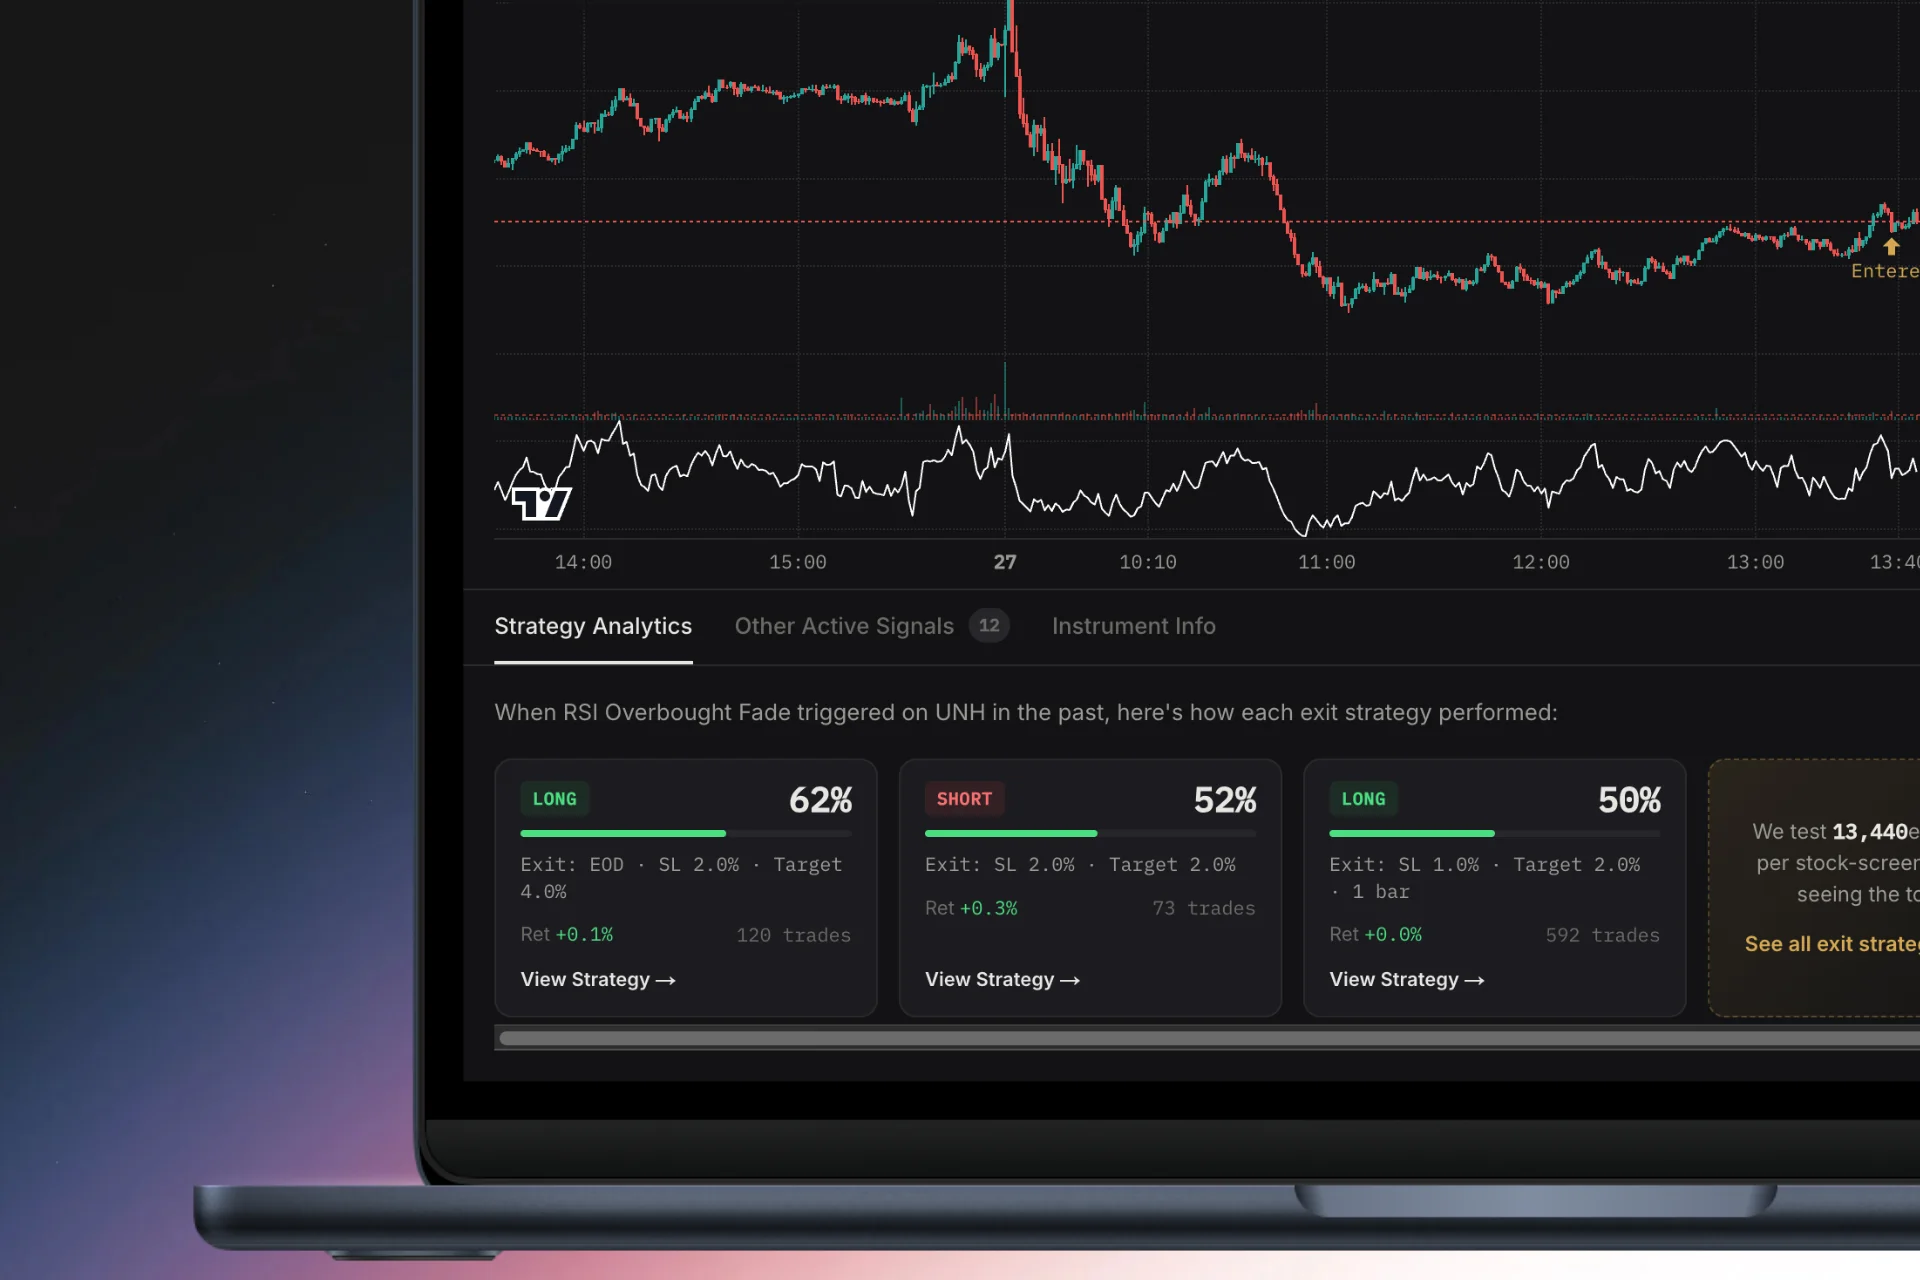
- Check the historical record before you trust the read. A backtested win rate on a fixed rule tells you far more than eyeballing three good-looking examples on a chart.
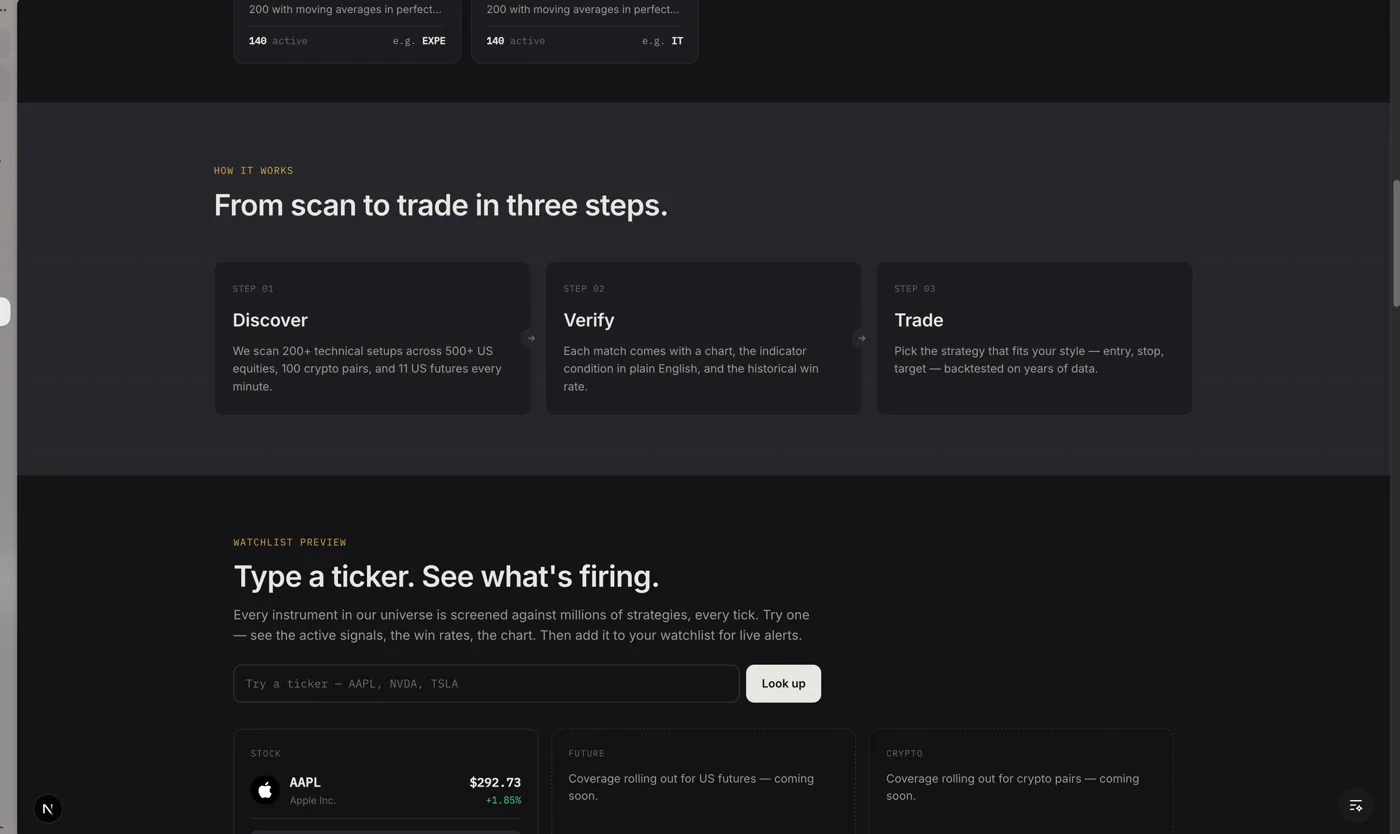
That last point is the whole reason ChartMath runs 23 live Bollinger Band screens instead of one generic "band touch" alert. Each variant, mean reversion, confirmed reversion, bull squeeze, bear squeeze, across multiple timeframes, carries its own backtested win rate and average return on a fixed universe of 500+ US equities. You're not asking "does this look like a good setup." You're checking whether the specific rule has actually worked historically, and by how much.
The app is free to download, no credit card required, and every Bollinger screen listed here runs live inside it. If you'd rather browse the rules first, the web-based screener lets you check a screen's backtested record before you ever open the app.
Frequently Asked Questions
Is touching the lower Bollinger Band a buy signal?
No, touching the lower band alone is not a reliable buy signal. In a downtrend, price can hug the lower band for weeks without reversing, so a touch needs confirmation, like a higher low or an oversold reading, before it means anything actionable.
What does a Bollinger Band squeeze actually mean?
A squeeze means volatility has contracted and a bigger price move is statistically more likely soon. It does not tell you which direction that move will go, which is why bull and bear squeeze breakouts require separate confirmation rules.
Which timeframe works best for Bollinger Bands?
There's no single best timeframe; the right one matches your holding period. Daily bands suit swing traders holding for days, while 5-minute or 15-minute bands suit intraday traders, and each timeframe needs its own confirmation window because compression resolves at different speeds.
Do I need to code anything to run these Bollinger screens?
No. Each of the screens referenced in this guide, including the squeeze breakout and confirmed bounce variants, is pre-built and backtested inside ChartMath. There's no Pine Script and no screen builder involved; you open the screen and see the current matches and the historical record.
A chart with an arrow drawn on it is an opinion. A screen with a win rate and a sample size behind it is a rule you can check. That difference is the entire point of running Bollinger Bands as backtested screens instead of eyeballing a live chart.
Bollinger Bands reward traders who treat them as a volatility gauge and punish traders who treat a single touch as an entry signal. The mean-reversion bounce and the squeeze breakout are genuinely different trades that happen to share one formula, and each needs its own confirmation before it's worth risking capital on. If you want to see exactly how these rules have performed historically rather than take a chart's word for it, watch a quick demo of how ChartMath's backtested screens work, then pull up the Bollinger screens yourself and check the numbers behind each one.
Recommended Resources
- Watch Demo
- Web Based Screener

See these setups live in ChartMath
200+ curated screens with backtest data. Free. No credit card required.