NR7: The Volatility Contraction Setup Retail Traders Miss
NR7 stands for narrowest range in seven sessions: today's high-low range is tighter than any of the previous six trading days. It doesn't tell you whether a stock is about to break up or down. It tells you that a move is likely coming soon, because volatility has compressed to a multi-day low and markets don't stay quiet forever.
Key Takeaways
- Timing, not direction: NR7 flags when a breakout is likely, not which way it will go. That's why ChartMath runs separate bull-break and bear-break rules on top of it.
- Short holding period: a seven-session range window resolves in days, not weeks. Treat NR7 as a short-horizon setup, not a long-term thesis.
- Real failure mode: contraction can persist. A quiet day followed by more quiet days costs you the spread while you wait for a breakout that never shows up.
- Fits a day job: the scan runs off the daily close, the setup is visible on an end-of-day chart, and there's nothing to babysit intraday.
- Test before you trust it: fix the rule, define the universe, set stop and target in advance, then judge the screen on its full sample, not the last chart you happened to look at.
NR7 At A Glance
| Attribute | Detail |
|---|---|
| What it measures | Today's high-low range is the smallest of the last 7 sessions |
| Signal type | Volatility contraction (timing), not a direction call |
| Typical horizon | Days, since the range window itself is 7 sessions |
| Chart cadence needed | Daily bars, checked once after the close |
| Main failure mode | Contraction persists; anticipated breakout doesn't arrive and costs the spread |
| Direction confirmation | Separate bull-break / bear-break rules, or a general range-expansion screen |
| Related ChartMath screens | NR7 Squeeze, NR7 Bull Break, NR7 Bear Break, Range Expansion (all daily) |
What NR7 Actually Measures
NR7 is arithmetic, not opinion. Take the daily high-low range for today and compare it against the same range on each of the prior six sessions. If today's is the smallest of the seven, the day qualifies. That's the whole rule.
The logic behind it comes from how markets actually move. Price alternates between periods of contraction, where ranges shrink and volume often thins out, and periods of expansion, where ranges widen sharply as new information or new buyers and sellers show up. NR7 is one way to spot the contraction phase near its tightest point.
This isn't a new idea. Range-contraction concepts have circulated in technical trading literature for decades, under names like inside days and Bollinger Band squeezes. NR7 is a specific, mechanical version: no visual judgment call about what counts as "tight," just a seven-day lookback and a comparison.
Why NR7 Is A Timing Signal, Not A Direction Call
NR7 tells you a stock's range has compressed to a seven-day low, which historically precedes a period of wider daily ranges. It says nothing about whether that expansion will be up or down. That ambiguity is the entire reason direction needs its own rule.
This is why treating NR7 alone as a buy signal misreads it. A trader who sees a narrow range and assumes the next move is up is guessing, not reading the setup. The contraction only tells you when volatility is likely to return, not where price is headed.
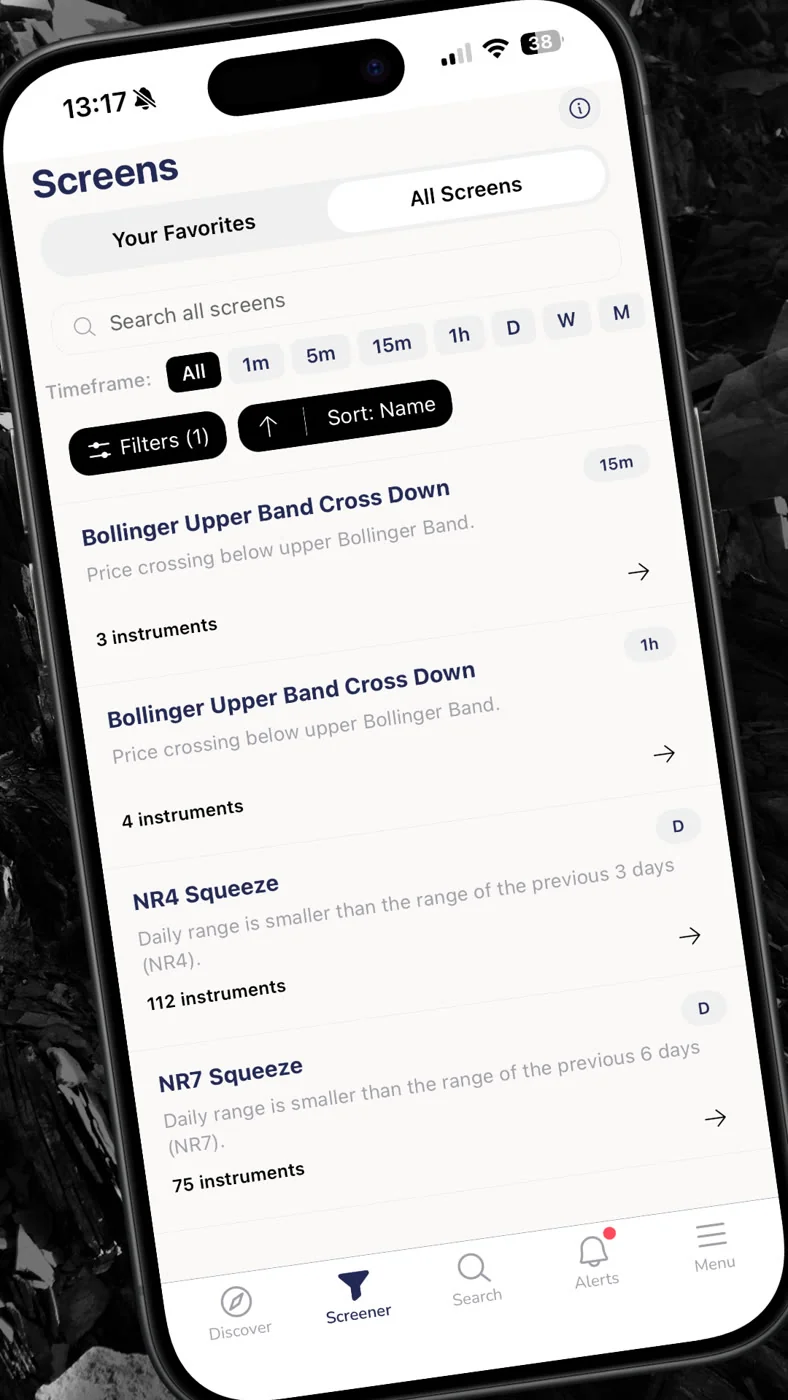
ChartMath splits this into separate rules for exactly this reason. The NR7 Squeeze (Daily) screen identifies the contraction itself, with no direction attached. The NR7 Bull Break (Daily) screen only fires when price resolves the contraction to the upside, and the NR7 Bear Break (Daily) screen only fires on a downside resolution. Each is a distinct, backtestable rule with its own win rate and sample size, rather than one blended signal pretending to know direction it can't know.
There's also a fourth angle worth separating out. The Range Expansion (Daily) screen looks for the resolution itself, a day where the range widens sharply, independent of whether an NR7 day preceded it. Not every expansion follows a textbook contraction, and treating the two screens as separate tools keeps you honest about which condition you're actually trading.
How Long Should You Expect To Hold?
An NR7 setup implies a short holding period, typically a handful of sessions. The seven-day lookback that defines the contraction resolves quickly once volatility returns, so this isn't a position you carry for months on a story.
If your plan for an NR7 trade stretches into a multi-week thesis, you've drifted away from what the setup actually measures. Range compression is a near-term condition. Trade it near-term, with a stop and target sized for a few days of movement, not a quarter.
The Honest Failure Mode: Contraction Can Persist
Here's the part most write-ups skip. A narrow range today doesn't guarantee an explosive range tomorrow. Volatility can stay compressed for several more sessions before anything happens, or it can grind sideways indefinitely without ever producing the breakout you positioned for.
That matters because entering a position anticipating a move that doesn't arrive still costs something. You pay the bid-ask spread on entry and again on exit, and if you sized a stop around expected volatility that never showed up, you can get stopped out on ordinary noise before the real move ever starts.
A quiet stock can simply stay quiet. Waiting for volatility to expand is a bet with a real cost of being wrong, even when nothing dramatic happens.
This is the honest version of the setup, and it's also the reason a backtest matters more here than on most patterns. If NR7 days on a given ticker or universe frequently fail to expand within a reasonable window, that's information you want before risking money, not after.
Why NR7 Suits A Trader With A Day Job
NR7 is built around the daily close, which fits a schedule that doesn't include watching a screen during market hours. You run the scan once the market closes, review whatever qualifies, and place any resulting orders calmly instead of reacting mid-session.
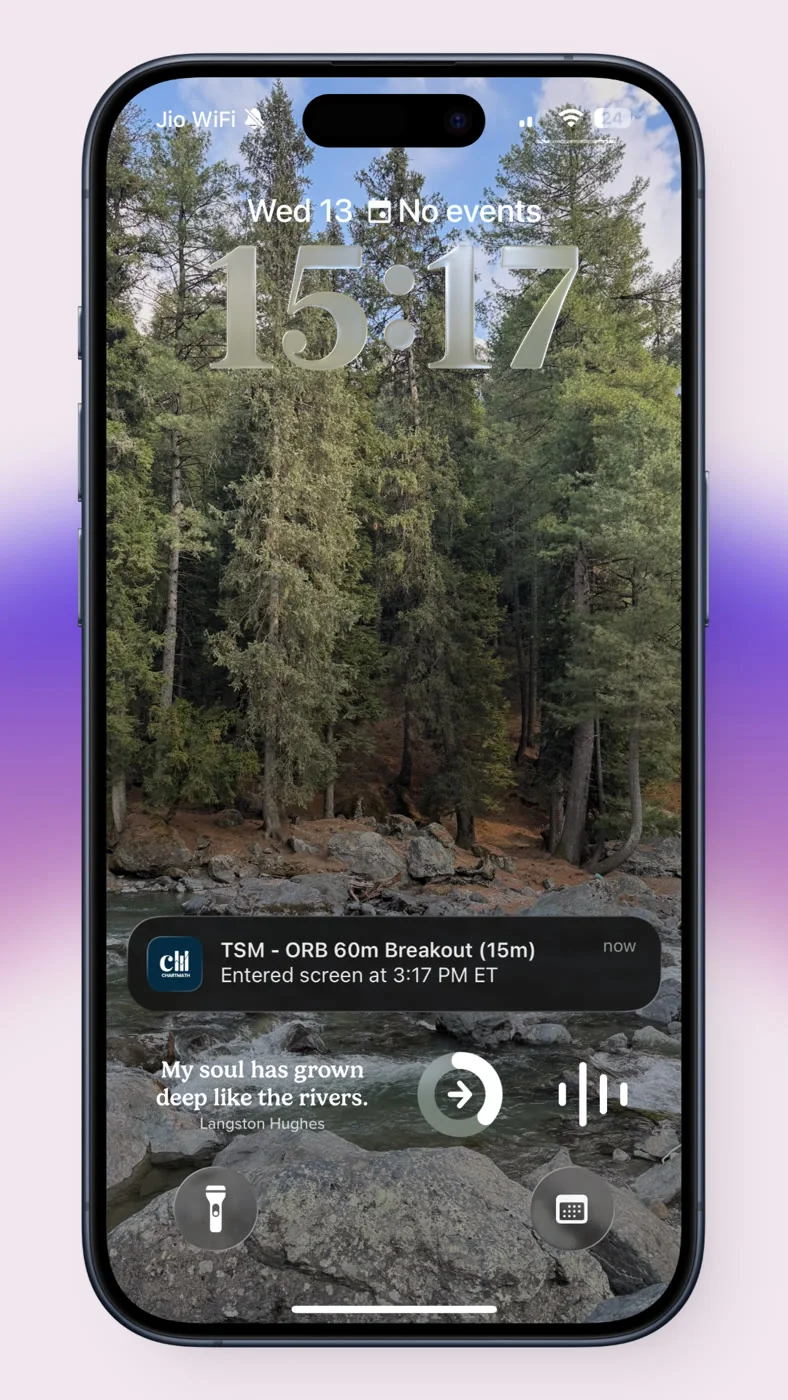
There's nothing to monitor intraday for this setup to work. The range that defines it is already closed and locked in by the time you look at it. Compare that to an opening-range breakout or a VWAP reclaim, where missing a five-minute window means missing the trade; see our guide on the ORB trading strategy for a setup that does require intraday attention.
For someone juggling a full-time job, this cadence matters more than the edge itself. A setup you can evaluate in twenty minutes after dinner is one you'll actually execute consistently, instead of half-watching a chart between meetings and entering late.
How To Test NR7 Before You Trade It
Do you need to test NR7 yourself before trusting it? Yes. A pattern description on a blog post, including this one, is not evidence. You confirm an edge exists by fixing the rule, running it against a real universe, and reading the full sample, not by eyeballing a few recent charts.
- Fix the rule. Write down the exact definition: today's high-low range must be smaller than each of the prior six sessions' ranges. No judgment calls, no "close enough."
- Define the universe. Decide which stocks you're scanning and over what history. A rule that only works on a handful of hand-picked tickers isn't a rule, it's a story you told yourself after the fact.
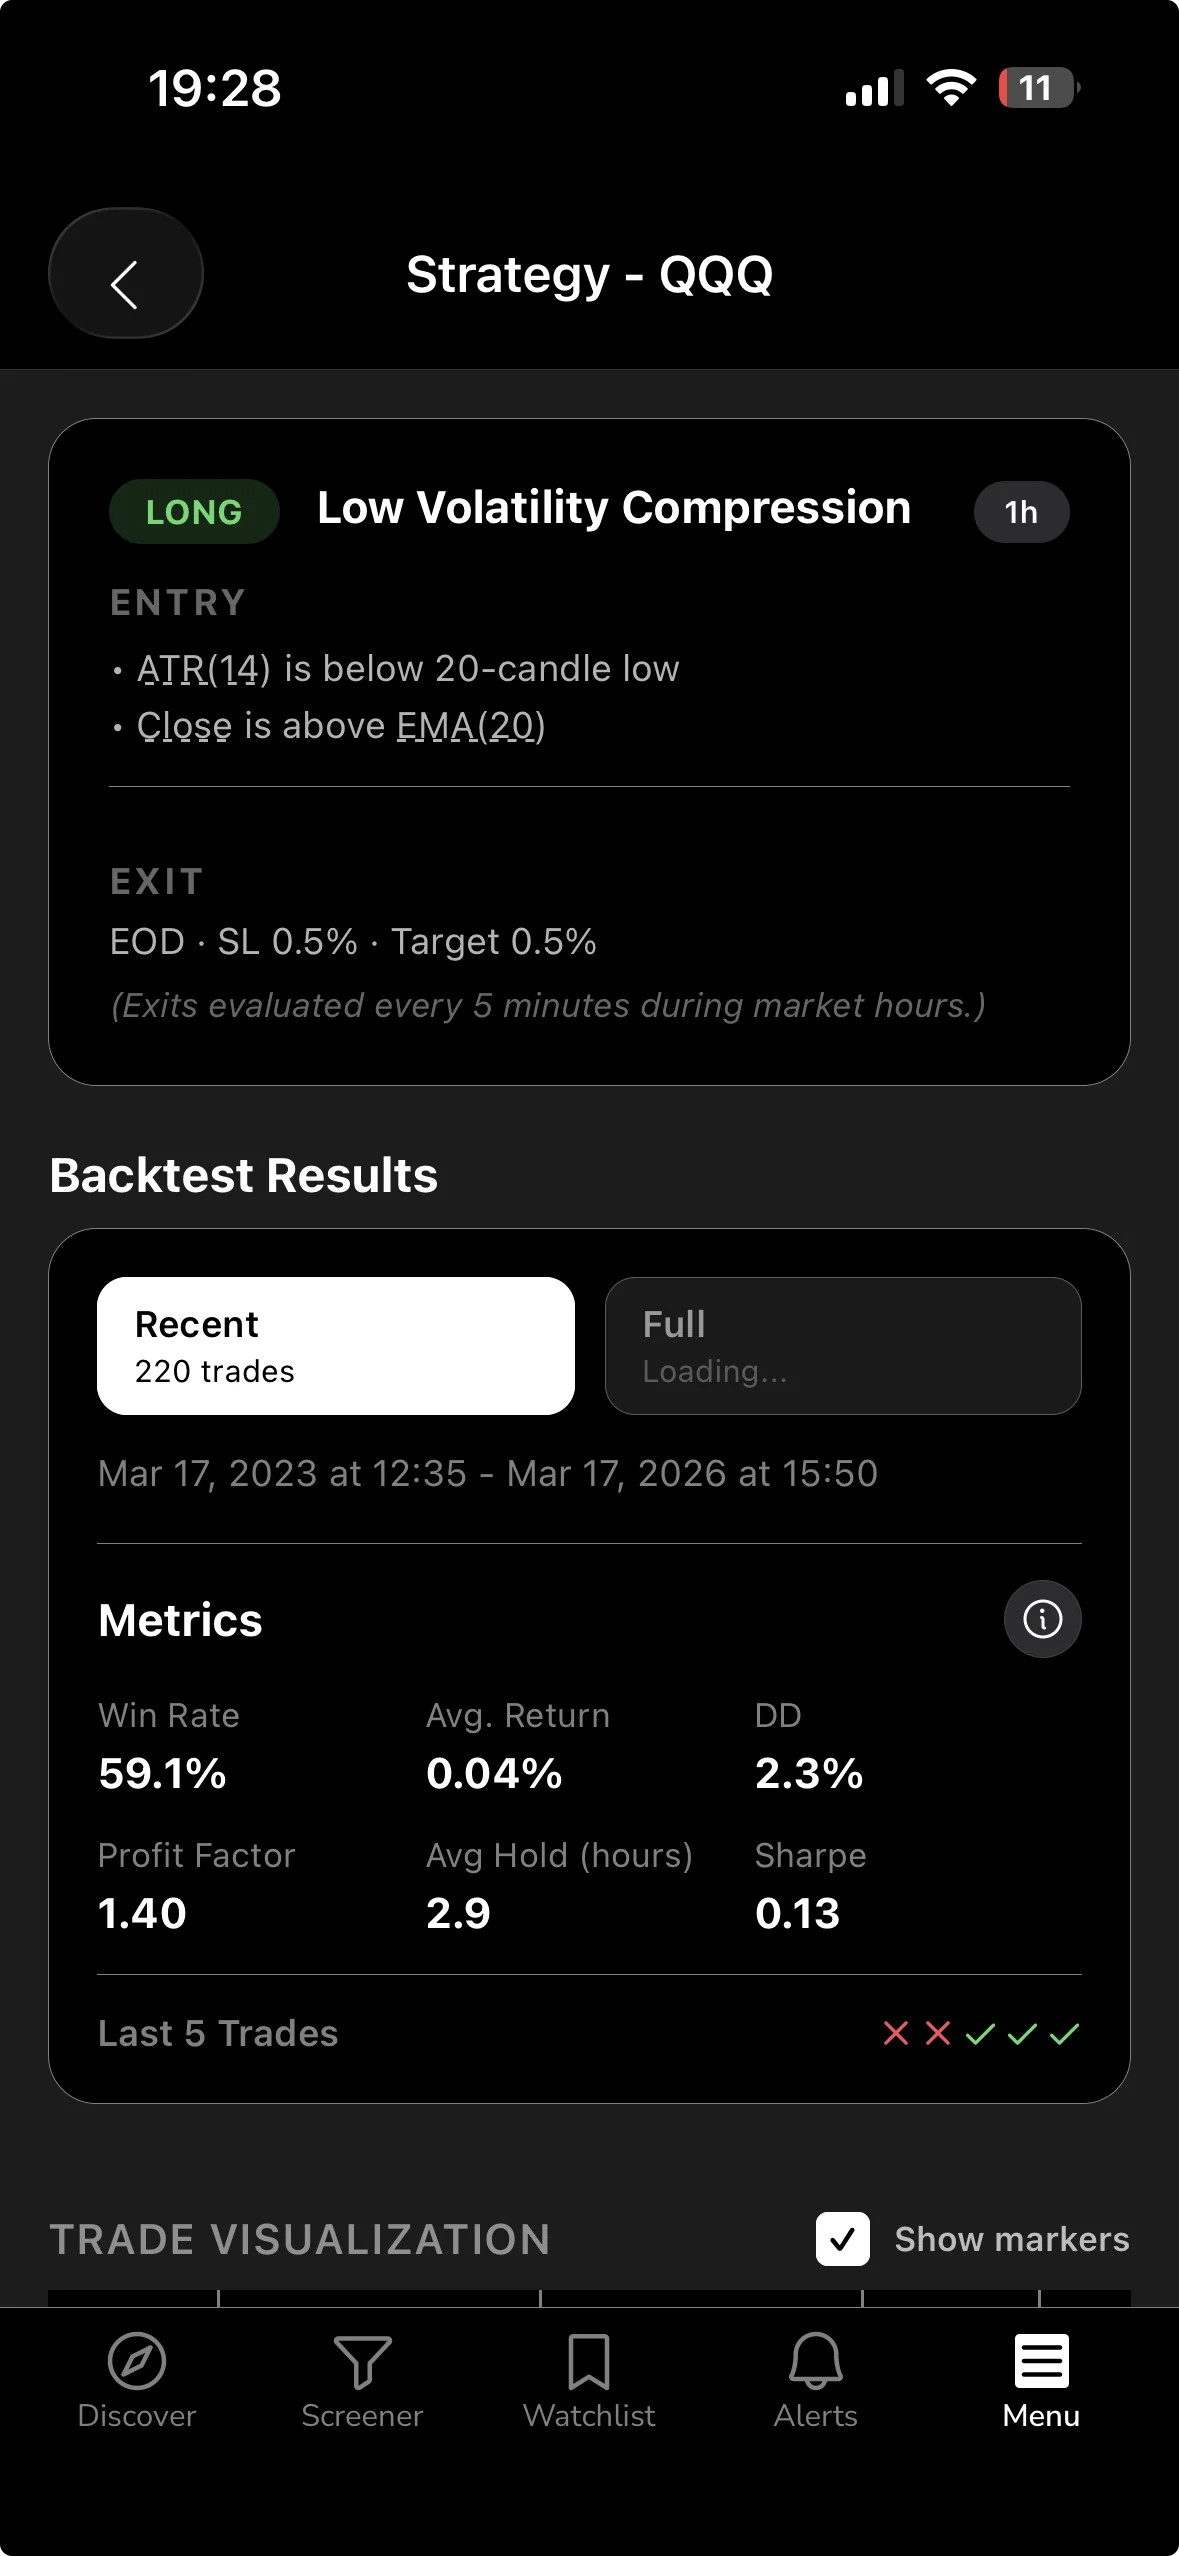
- Set the stop and target before entry. Decide your exit plan, both the loss you'll accept and the gain you're targeting, before you're in the trade. Deciding under pressure after a fast move starts is how discipline breaks down.
- Judge the screen on its whole sample. Look at the win rate and average return across every historical instance, not just the last chart you happened to notice. Five recent trades, good or bad, tell you very little; see our piece on becoming a systematic trader for why small samples mislead.
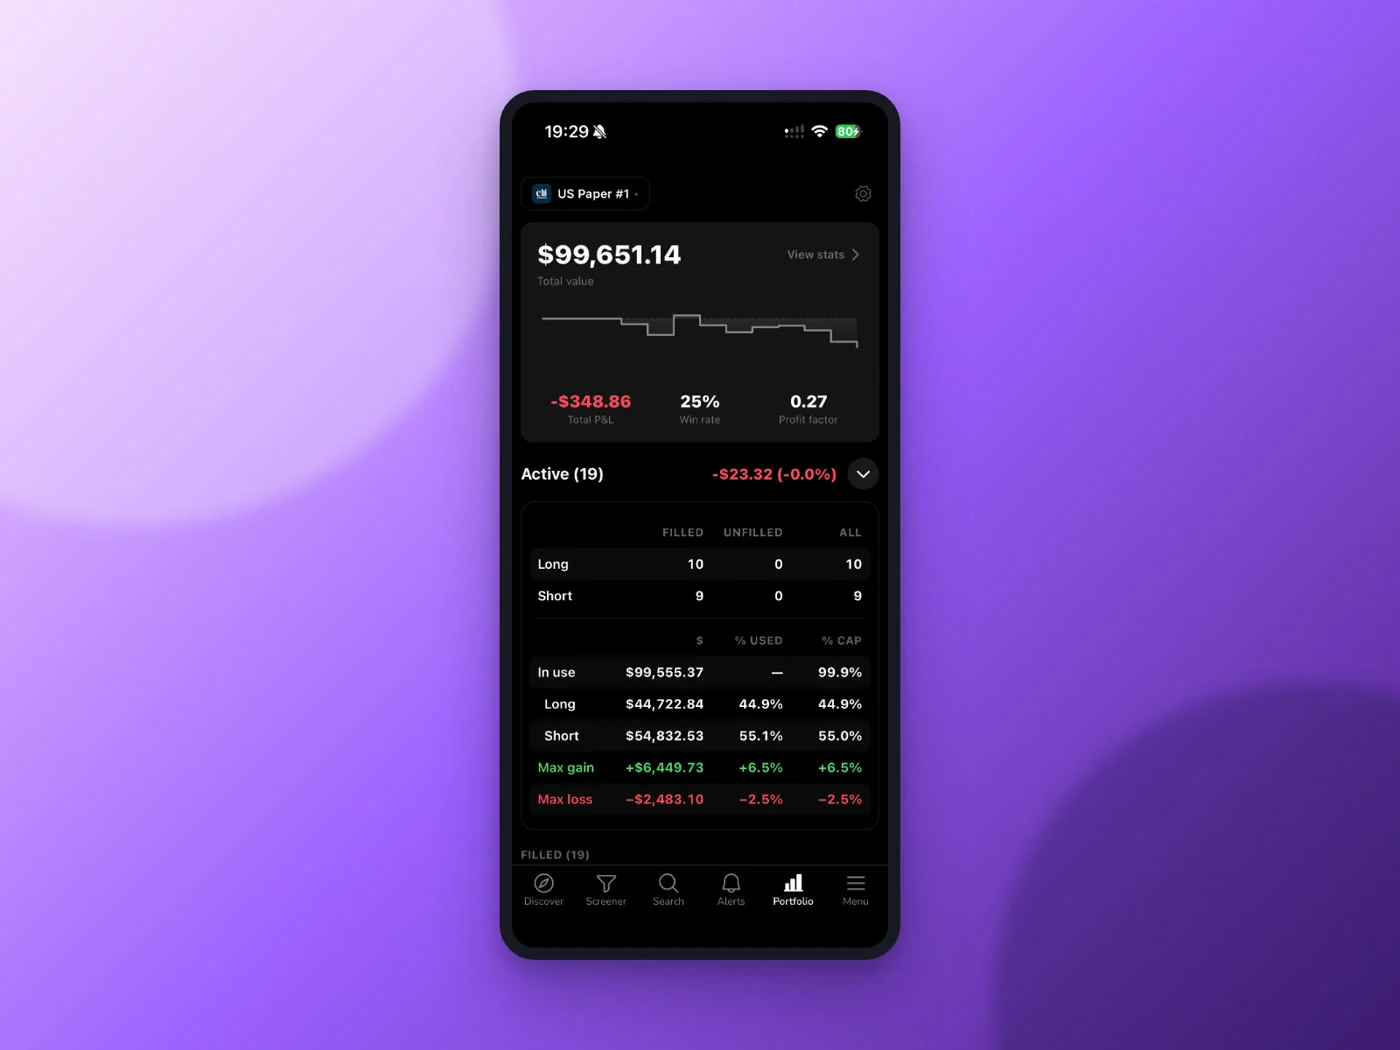
This is also where paper trading earns its keep. Rehearsing an NR7 breakout as a simulated order, with stop, target, and size already worked out, lets you see how the setup behaves in real time without capital on the line. It's a rehearsal step, not a substitute for the historical read.
Where NR7 Fits Next To Other Contraction Signals
NR7 isn't the only way traders spot compression. An inside day, where the entire range sits inside the prior day's range, is a looser, single-day version of the same idea. A Bollinger Band squeeze measures compression through a band-width statistic instead of a raw range comparison. Both point at the same underlying phenomenon: volatility that's due to normalize.
What sets NR7 apart is its mechanical simplicity. There's no band-width threshold to tune, no subjective read on how "inside" a candle needs to be. It's a straight seven-day comparison, which makes it easier to backtest consistently and harder to fudge after the fact.
None of these signals need to be traded in isolation. Some traders add a volume filter, only acting on an NR7 day that also shows below-average volume, since thin volume often accompanies genuine compression rather than a pause inside a bigger move. Our guide on volume analysis and RVOL covers how to layer that confirmation in.
Putting NR7 To Work In ChartMath
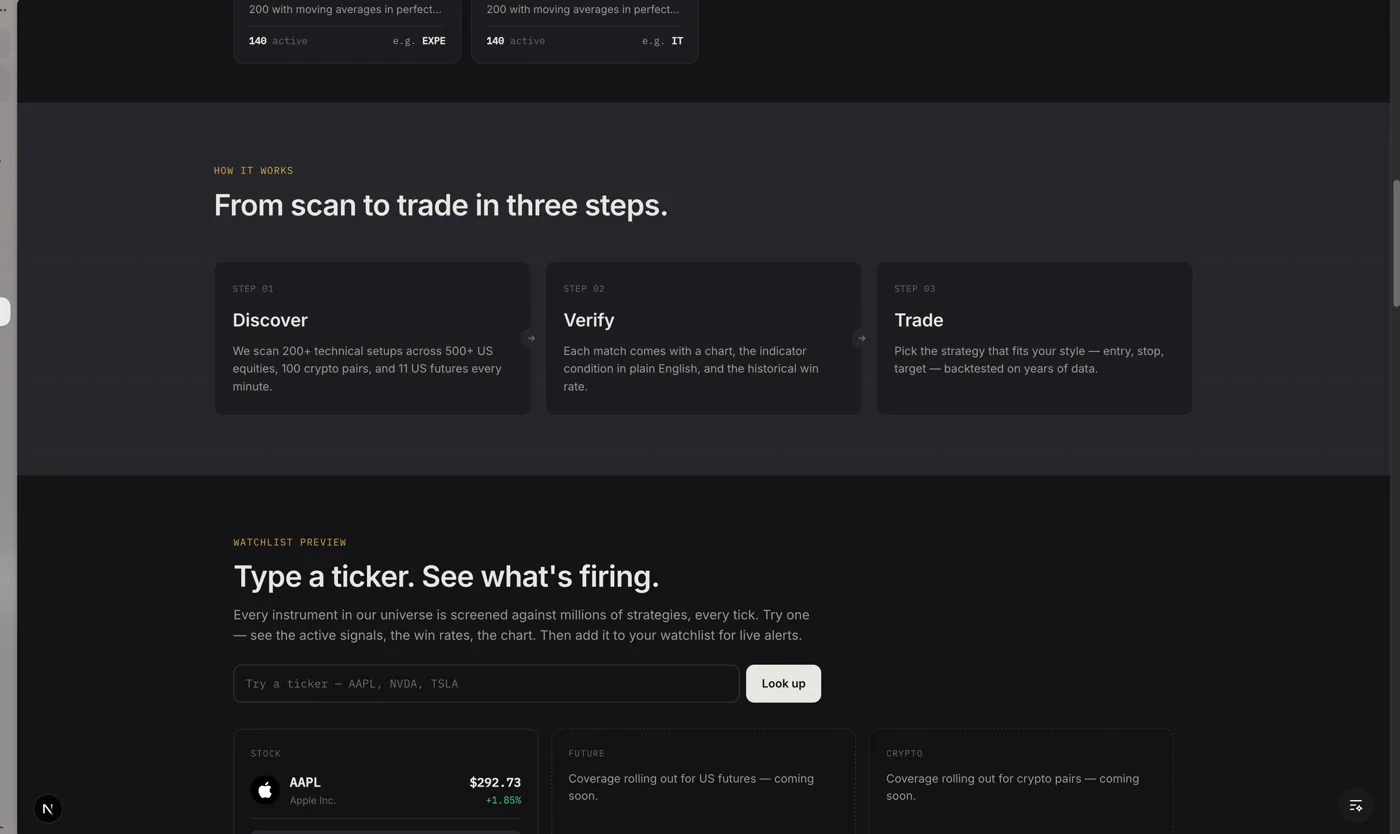
ChartMath runs the NR7 concept as a set of separate, backtested daily screens rather than one blended signal. The contraction, the bullish resolution, the bearish resolution, and the general range expansion each carry their own historical win rate and average return, computed off a fixed rule, so the record is something you can check rather than take on faith.
That structure matters given how the market's information gap is shifting. As recent coverage of retail trading tools notes, institutional desks have long had an edge in proprietary data and execution infrastructure; a documented, recomputable rule is one of the few ways a retail trader narrows that gap without guessing.
Once a screen matches, you can rehearse the trade through paper trading before risking real capital, with the stop, target, and share count already worked out. If you'd rather see the mechanics before committing to a routine, browse the screens directly at the web-based screener, where the NR7 family sits alongside 200+ other rule-based setups.
Building a habit around a setup like this works best inside a repeatable routine rather than a one-off check. Our guide on building a trading workflow walks through how to slot an end-of-day scan like NR7 into a schedule that doesn't require watching charts during work hours.
If you've been relying on a scanner that only shows you a chart without a track record attached, or a signal group promising calls with no backtest behind them, NR7 is a useful test case for the difference. A rule you can define in one sentence and check against years of history is a different category of tool than a chart pattern someone eyeballed once and posted.
Start Testing NR7 The Right Way
NR7 isn't a shortcut and it isn't a guess. It's a documented volatility observation you can verify, size around, and rehearse before it ever touches real money. Pull up the NR7 Squeeze screen, check its full sample, and decide for yourself whether the setup earns a place in your routine, then confirm direction separately with the bull break or bear break rule before sizing anything. When you're ready to see the whole workflow end to end, from a matched screen to a pre-filled paper order, download the app and run it against a real ticker on today's close.
Recommended Resources
- Watch Demo
- Web Based Screener

See these setups live in ChartMath
200+ curated screens with backtest data. Free. No credit card required.