Death Cross: What It Actually Predicts
Your phone buzzes. A stock you own just printed a death cross, and by lunchtime three finance headlines have called it a warning sign for the whole market. Here's what that crossing actually tells you: the 50-day moving average has fallen below the 200-day moving average, confirming a downtrend that has likely been running for weeks already. It is not a forecast of a crash. It is a lagging, backward-looking signal, and testing it honestly shows it works best as a trend filter, not a trigger to act on today.
Key Takeaways
- The rule itself is narrow: a death cross is the 50-day moving average crossing below the 200-day moving average, but SMA vs EMA and rising vs falling 200 DMA are different rules that need separate testing.
- It confirms, it doesn't predict: because it's built on 200 days of price, a large chunk of the decline has usually already happened by the time the cross prints.
- Choppy markets punish it: sideways price action makes the 50 and 200 DMA cross back and forth, so a golden cross and a death cross can both fire on the same stock within weeks.
- Its real job is regime detection: it answers "is this name still in an uptrend," not "should I short today."
- A fair test needs structure: a fixed rule, a named universe, a pre-chosen exit, and dozens of instances, with win rate always read next to average return.
Death Cross at a Glance
| Attribute | Detail |
|---|---|
| Core definition | 50-day moving average crosses below the 200-day moving average |
| Common variants | SMA vs EMA basis; rising vs falling 200 DMA at time of cross |
| Signal type | Lagging trend-confirmation signal, not a forecast |
| Best use case | Trend-regime filter for exposure and position management |
| Weak use case | Standalone short entry or crash-timing tool |
| Failure mode | Whipsaws in choppy or range-bound markets |
| Minimum sample for a real test | Dozens of historical instances across a defined universe |
| What to check alongside win rate | Average return per trade, since a high win rate with a tiny average return can still lose to trading costs |
1. What the Death Cross Rule Actually Says
Stated exactly, a death cross forms when a stock's 50-day moving average drops below its 200-day moving average, as LegalClarity explains. That's the whole rule on paper. In practice, three variants hide inside that one sentence, and they are not interchangeable.
First, SMA vs EMA. A simple moving average weighs every day in the lookback window equally. An exponential moving average weighs recent days more heavily, so it reacts faster and crosses earlier. A death cross built on EMAs will fire before one built on SMAs on the same chart, sometimes by days or weeks.
Second, the slope of the 200 DMA at the moment of the cross matters. A death cross where the 200-day line is already falling is a very different situation from one where the 200-day line is still rising and only just got caught by a sharp 50-day drop. Traders sometimes lump both into "death cross" and then wonder why their backtest results are noisy.
Treat each combination, SMA daily, EMA daily, rising 200 vs falling 200, as its own rule with its own track record. Quantified Strategies' 65-year backtest makes this same point: the signal "identifies short-term weakness" reasonably well, but nuance in how you define it changes what you find.
2. Why It Is a Lagging Signal, Not a Warning
The death cross lags because it's mathematically built to lag. A 200-day average needs 200 days of closing prices to move meaningfully, so by definition it reacts slowly to new information. The 50-day average moves faster, but it still needs weeks of declining prices to drop far enough to cross underneath.
That lag has a direct consequence: a stock is often deep into a decline by the time the cross confirms. As Edgeful's breakdown puts it, the 200-day average tracks nearly a full year of price action, and "by the time the cross prints, price has usually already moved." A trader who waits for confirmation and then shorts is often selling near a local low, not near the top.
This doesn't make the signal useless. It makes it a lagging indicator doing a lagging indicator's job: confirming that a trend shift has already taken hold, not warning you before it starts. Anyone reading it as an early alarm is asking it to do something it was never built to do.
3. The Whipsaw Problem in Choppy Markets
Trending markets are where crossover rules earn their reputation. Choppy, range-bound markets are where they lose it. When price oscillates without committing to a direction, the 50 and 200 DMA drift close together and cross back and forth repeatedly.
Each crossing looks like a fresh signal. Traded mechanically, each one generates a trade, and in a sideways market both the golden cross entries and the death cross exits tend to lose small amounts, over and over, to noise and slippage. Arxum's review of the data notes that both crosses "lag" and that by the time either prints, "price has usually already" made its move, which is exactly the setup for a whipsaw: you react late, then reverse late again.
It gets worse on a single name. A stock can print a death cross in March, chop sideways, then print a golden cross in May, then death-cross again in July. None of those crossings individually failed the definition. All three together describe a stock that never picked a clear direction long enough for the rule to pay off.
A golden cross and a death cross firing on the same ticker weeks apart isn't a bug in the indicator. It's the indicator correctly describing a market that hasn't decided what it's doing.
4. What a Death Cross Is Actually Useful For
The death cross earns its keep as a trend-regime filter, not a trade trigger. It answers a narrower, more honest question: is this stock currently in a longer-term uptrend or downtrend, based on where its short-term average sits relative to its long-term average? That's a useful input for deciding exposure, not for timing an entry.
Used this way, a death cross might tell a swing trader to reduce position size in a name, tighten stops, or stop looking for long setups on that ticker until the trend resets. It should not, on its own, tell anyone to open a short position. Confirmation from faster signals, volume, or a specific setup still has to do the actual timing work.
This distinction between filter and trigger shows up across systematic trading generally. A rule that's mediocre as a standalone entry can still be genuinely useful as a background condition that other signals get checked against. If you're building that kind of layered approach, the guide on building a full trading workflow covers how regime filters and entry signals fit together.
5. How to Test a Death Cross Rule Properly
You can't evaluate "the death cross" as one thing. You have to fix a specific version of it and test that version alone, on a defined universe, with an exit rule chosen before you look at the results.
Start by locking down the exact definition: SMA or EMA, which two periods, and whether you're also filtering by the 200 DMA's slope. Changing any of those turns it into a different rule with a different history.
- Name the universe. Testing on five stocks you remember doing well proves nothing. Test across a defined list, ideally hundreds of names, so the result isn't cherry-picked survivorship bias.
- Choose the exit before you start. Time-based exit, trailing stop, or a fixed target, decide it up front, or you'll unconsciously tune the exit to make the entry look good.
- Require dozens of instances minimum. A death cross that only fired six times on your test universe hasn't given you enough data to trust a win rate at all.
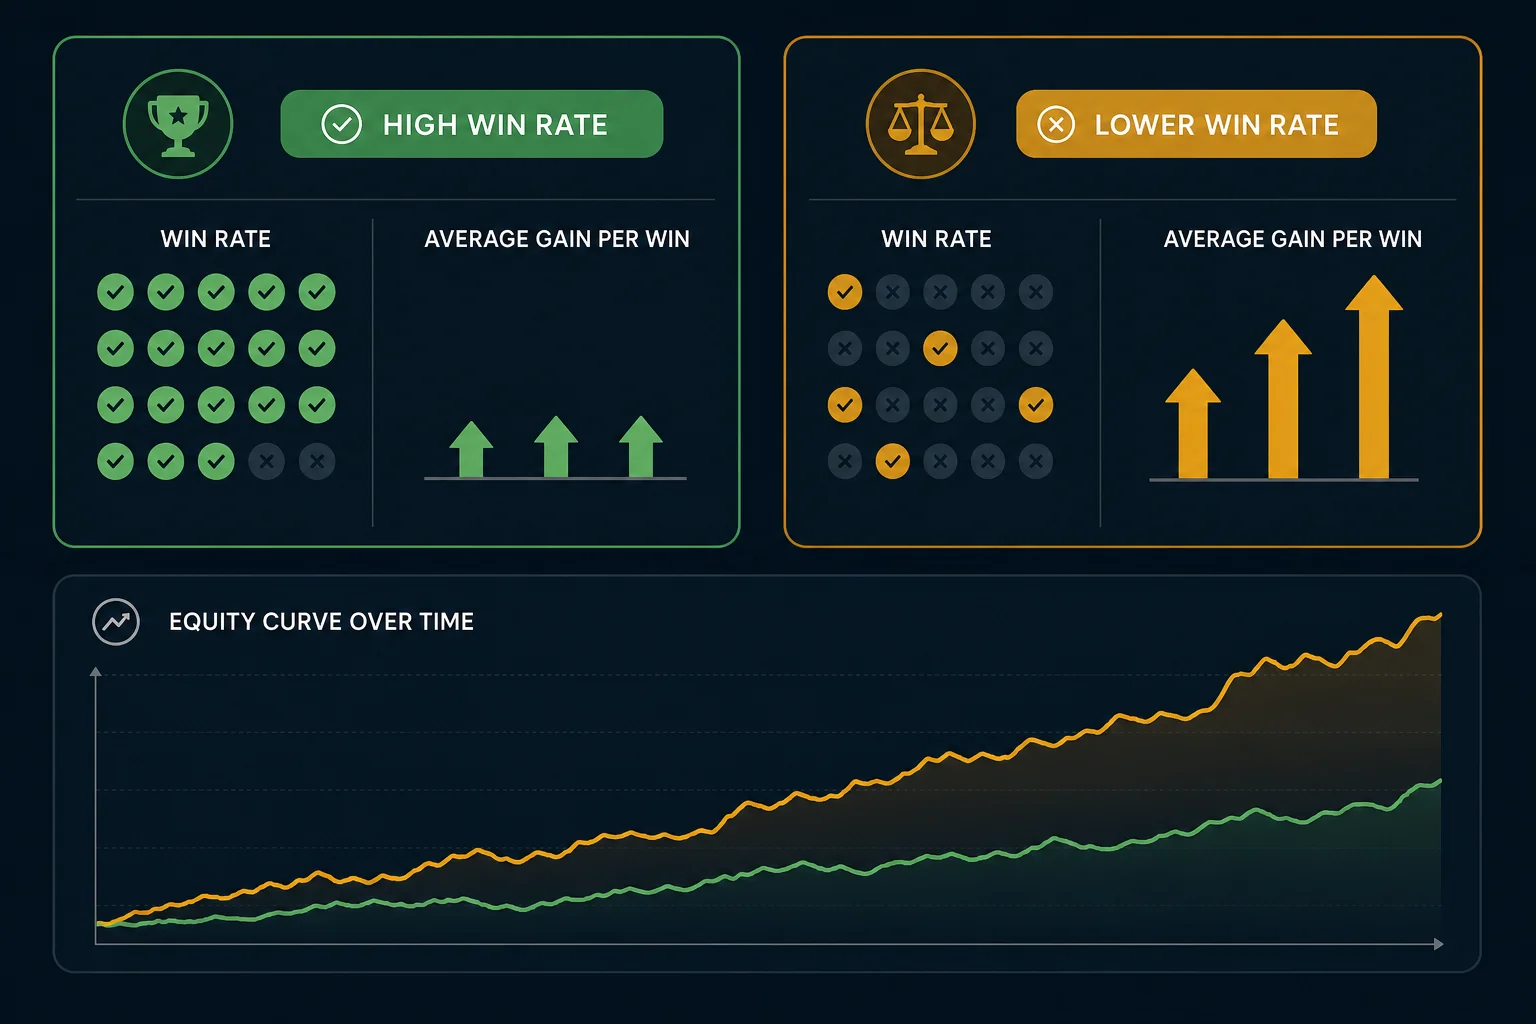
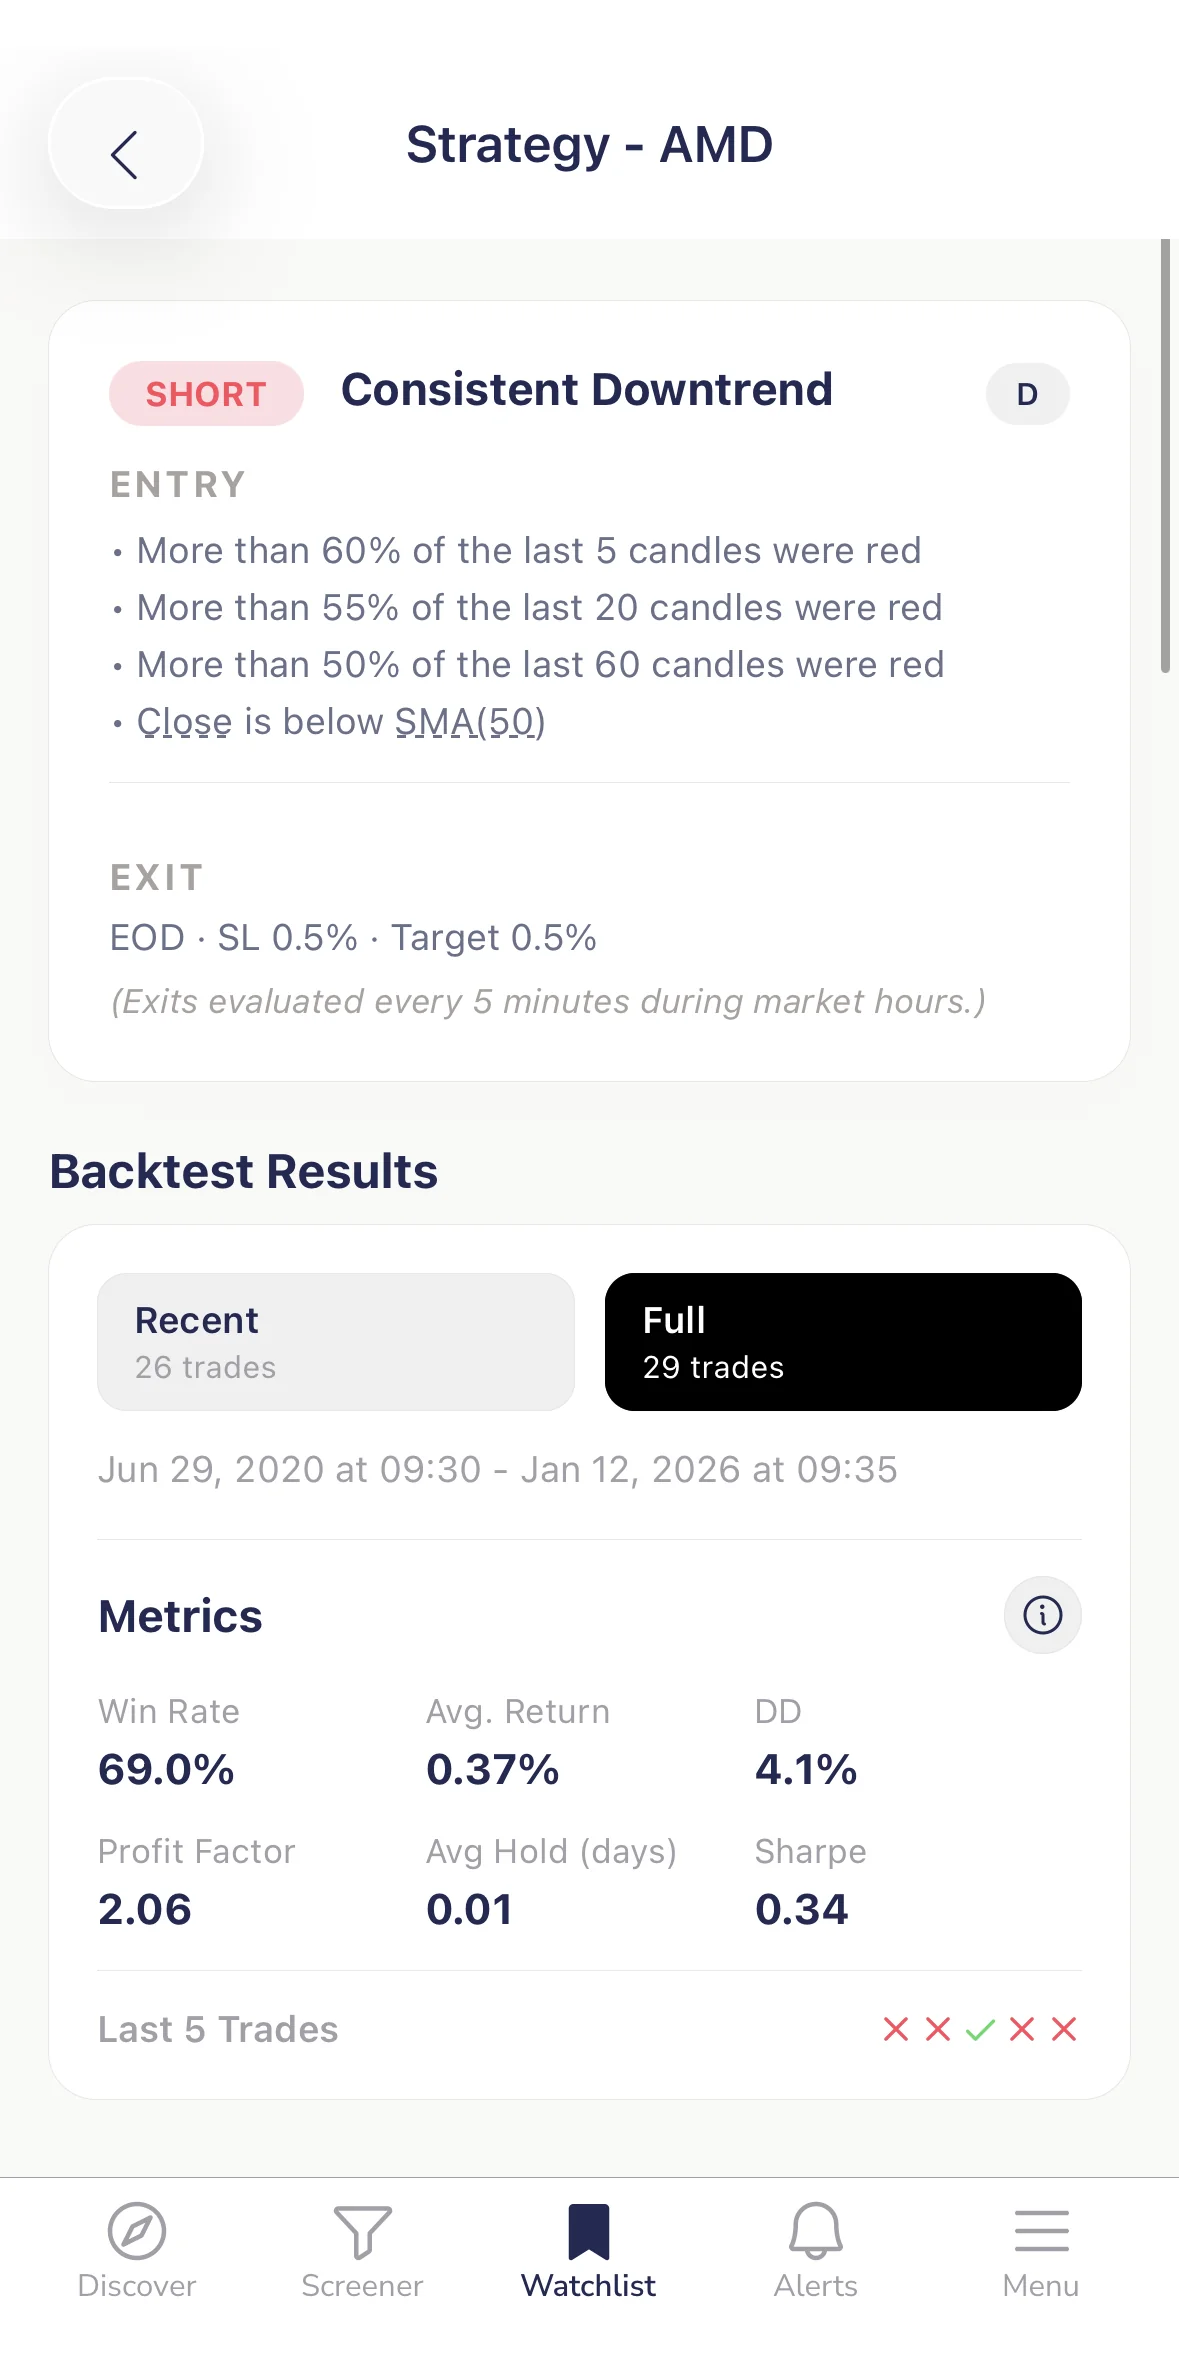
- Read win rate next to average return. A rule that wins 70% of the time but averages a tiny gain per trade can still lose money once spreads, slippage, and commissions are subtracted. A rule that wins 45% of the time with a large average return might be the better trade.
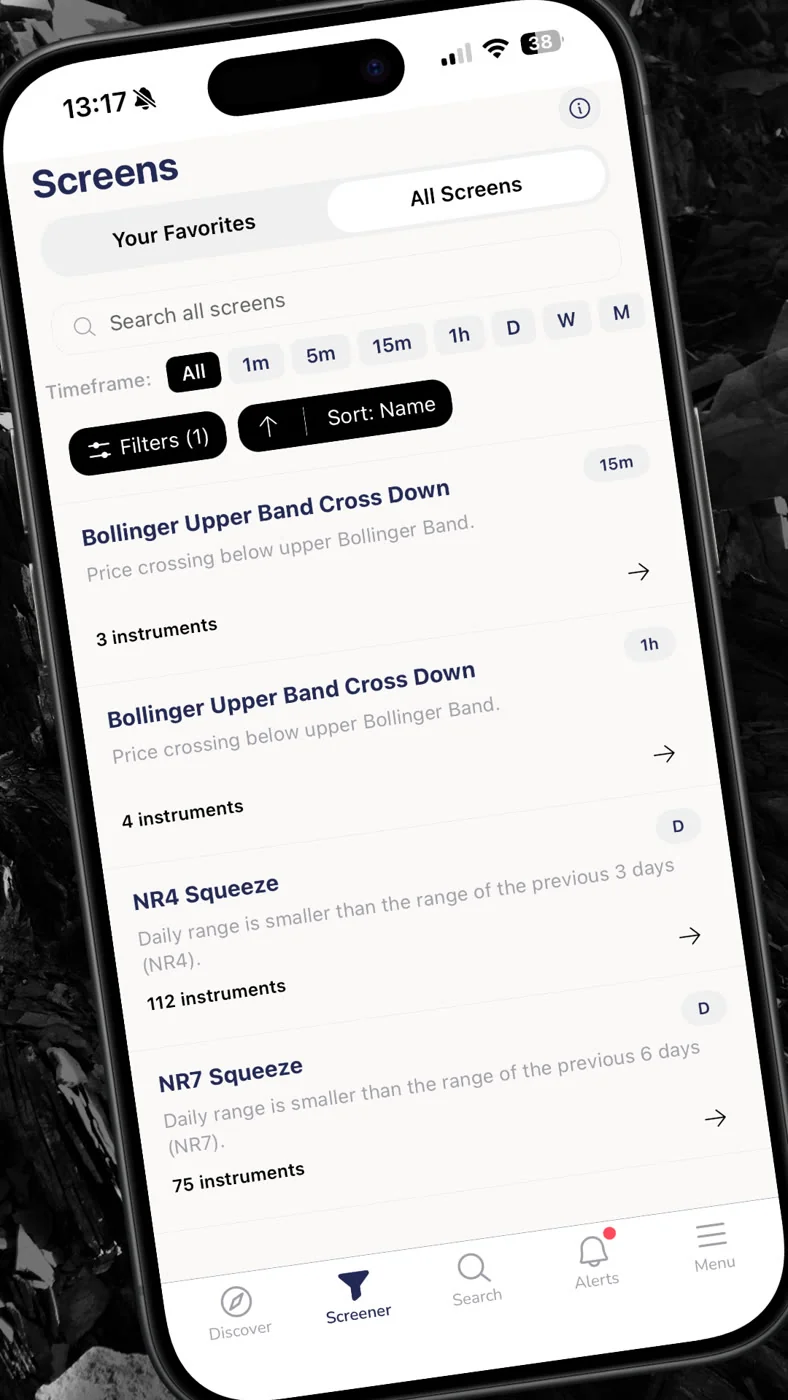
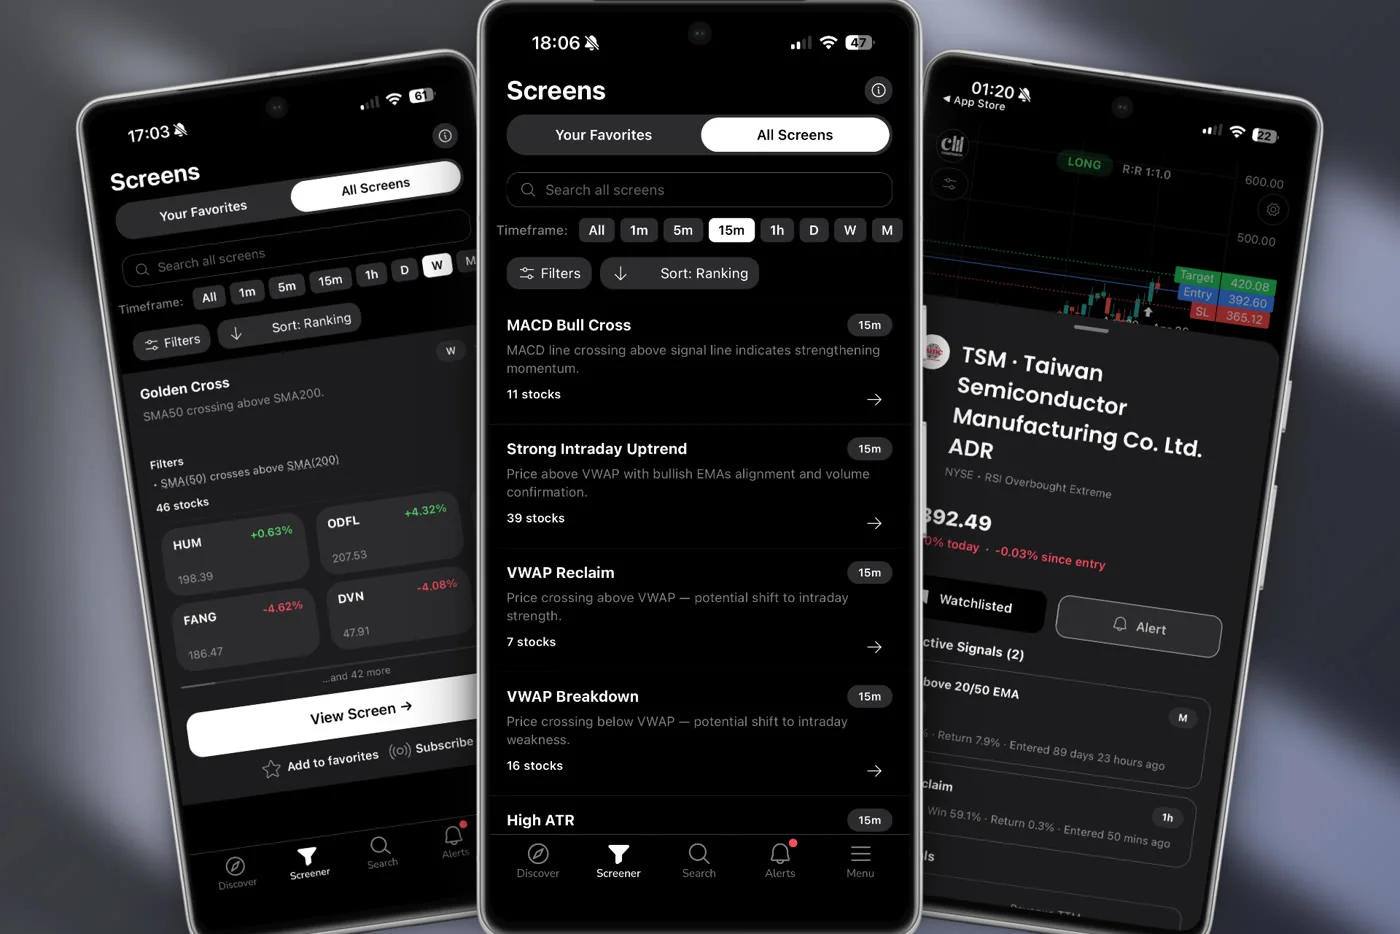
Also test timeframes separately. A daily death cross, a weekly death cross, and a 1-hour death cross share a name and nothing else. The Death Cross Daily screen is the classic version most people mean when they say "death cross." The Death Cross Weekly screen fires far less often and answers a slower, more structural question about a stock's multi-month trend. The Death Cross 1h screen is a genuinely different trade: same rule, same name, unrecognizably different frequency and holding period. If you want the mirror image for comparison, the Golden Cross Daily screen lets you test both directions of the same underlying idea.
Death Cross vs Golden Cross Across Timeframes
Comparing the daily, weekly, and 1-hour versions side by side makes the timeframe dependency concrete instead of abstract.
| Variant | Signal frequency | What it answers | Best paired with |
|---|---|---|---|
| Death Cross Daily | Moderate, the version most commonly discussed | Has the medium-term trend on this name turned down? | Position sizing and exposure decisions |
| Death Cross Weekly | Low, fewer and slower signals | Has the multi-month structural trend broken? | Portfolio-level trend review, not day-to-day trades |
| Death Cross 1h | High, frequent crossings | Is short-term intraday momentum fading right now? | Faster confirmation signals, tighter risk management |
| Golden Cross Daily | Moderate, mirror of the daily death cross | Has the medium-term trend turned back up? | Re-entry timing after a downtrend filter clears |
Putting the Death Cross to Work Without Overtrading It
The honest conclusion is that the death cross is a mediocre entry signal and a decent context clue. That's not a knock on it, it's just what the lag and the whipsaw problem force it to be. Treat it as one filter feeding a larger process, alongside volume, momentum, and the kind of setup confirmation covered in a rules-based stock selection method if that page exists, or more generally in a systematic approach to choosing a trading style that matches your schedule.
If you want to see the actual historical record behind each variant instead of taking a headline's word for it, the daily, weekly, and 1-hour death cross screens above are backtested and free to open on ChartMath: no card required. You can also rehearse a trend-filter approach with a simulated order before risking real money, using the built-in paper trading tracked in the app's Portfolio tab.
For traders comparing tools to run this kind of test at all, what to look for in a screener with real backtest data covers the same fixed-rule, named-universe, defined-exit checklist applied more broadly.
FAQ
Does the death cross mean a crash is coming?
No. It confirms a downtrend that's often already partly played out, since it needs 200 days of price to form. It's a lagging signal, not a forecast of a future crash.
How long after a death cross does the market usually bottom?
There's no fixed answer, and outcomes vary widely by market condition and the specific universe tested. This is exactly why a named universe and a large sample size matter more than any single historical anecdote.
Is the golden cross more reliable than the death cross?
Neither is inherently more reliable; both share the same lag and the same whipsaw risk in choppy markets. A golden cross and a death cross can fire on the same stock within weeks of each other, which is why both need to be tested with a fixed rule and a real sample size rather than trusted on reputation.
One thing this piece leaves open on purpose: nobody has published a definitive answer on the "right" period pair (50/200 vs alternatives like 20/100) across every market regime, and that question is still worth testing yourself rather than accepting secondhand.
Ready to see the death cross's actual backtested win rate and average return instead of guessing from a headline? Open the Death Cross Daily screen free on the web-based screener, or download the app to get a push alert the moment a name you're watching actually crosses, with the plain-English reason attached. Free, no credit card required.
Recommended Resources
- Watch Demo
- Web Based Screener

See these setups live in ChartMath
200+ curated screens with backtest data. Free. No credit card required.