Swing Trading with a Full-Time Job: A Real System

Ask ten traders with day jobs what their biggest problem is, and nine of them will say the same thing: "I keep missing the entry." Not because they picked the wrong setup. Not because their strategy is broken. Because the stock moved at 10:43 AM on a Wednesday, and they were in a budget review.
That's not a strategy problem. That's a system problem. And the fix isn't to become a better trader — it's to build a workflow that doesn't require you to watch a screen all day. Swing trading with a full-time job is genuinely possible, but only if you stop trying to trade like someone who doesn't have one.
This guide lays out a real, repeatable system: what to do before the market opens, how to let alerts do the scanning while you're at your desk, how to use your lunch break without getting sucked into noise, and how to run a postmarket review that sets you up for tomorrow. No quitting your job required.
Why Most Day-Job Traders Fail (And It's Not Their Strategy)
The trading education industry has a dirty secret: almost everything it teaches was designed for people who trade full-time. Wake up at 9:25 AM, watch the open, adjust positions at 10:30, review at 2:00 PM. That's a full-time job. If you already have one of those, following that playbook doesn't make you a better trader. It makes you a distracted employee and a stressed trader at the same time.
The traders who succeed with a day job aren't the ones who sneak more screen time. They're the ones who accept a simple constraint: you cannot monitor the market intraday, so your system has to work without you. That means three things.
- Your scanning has to be automated. Manually refreshing a screener at 6:00 PM and hoping you catch everything is not a system. It's a lottery.
- Your alerts have to be explainable. A push notification that says "AAPL alert" tells you nothing. An alert that says "AAPL entered the 52-Week High Breakout screen on the daily chart, with RVOL at 2.4x" tells you whether it's worth pulling up a chart.
- Your entries and exits have to be pre-planned. If you need to be at your desk to decide whether to enter, you'll miss most of your setups. If your stop-loss and take-profit are set at entry, you don't need to babysit the position.
Most traders fail at the first one. They're still manually scanning 30 to 80 tickers every night, which takes 45 minutes on a good day and still misses half the market. The solution isn't more discipline. It's a better tool. For a deeper look at building the right foundation, see How to Build an Efficient Trading Workflow in 2026.
1. Build Your Premarket Routine (15 Minutes Max)
The best premarket routines are short, repeatable, and focused on preparation rather than prediction. You're not trying to call the market. You're trying to know which setups are live and which alerts to pay attention to during the day.
The Night Before (10 Minutes)
Your most important premarket work actually happens the evening before. After the close, spend ten minutes on three things:
- Review your alerts from the day. Which screens fired? Which tickers entered setups you care about? Add the strongest ones to your watchlist.
- Set tomorrow's alerts. If you're using a tool like ChartMath, favorite the screens that match your strategy. The app will push an alert the moment a ticker enters that screen, so you don't have to check manually.
- Note key levels. For any ticker on your watchlist, write down the entry trigger, your stop-loss, and your target. If the setup triggers tomorrow, you already know what you're doing.
Morning of (5 Minutes)
Before you open your laptop for work, spend five minutes on a quick premarket scan. Check for overnight gaps on your watchlist tickers, any news that changes the setup, and whether the broader market (SPY, QQQ) is opening in a direction that supports your trades. That's it. Resist the urge to add new tickers at this stage. Your list is already built. See Premarket Trading: 7 Strategies to Find High-Probability Setups for a deeper breakdown of what to look for before the open.
The goal of premarket prep is to arrive at 9:30 AM knowing exactly which setups you're watching and what would trigger an entry. Everything else is noise.
2. Let Alerts Do the Scanning While You Work
This is the part most day-job traders skip, and it's the most important part of the whole system. While you're in meetings, on calls, or heads-down on a project, the market is moving. Setups are triggering. Breakouts are happening. The only way to catch them without watching a screen is to have a system that watches for you.
What a Good Alert Actually Tells You
Most alert systems fail the day-job trader in the same way: they send a ticker and a price, and nothing else. "NVDA: $127.40." Great. What does that mean? Is it a breakout? A reversal? Is the volume confirming? You have no idea, and you're in a meeting, so you can't pull up a chart to find out.
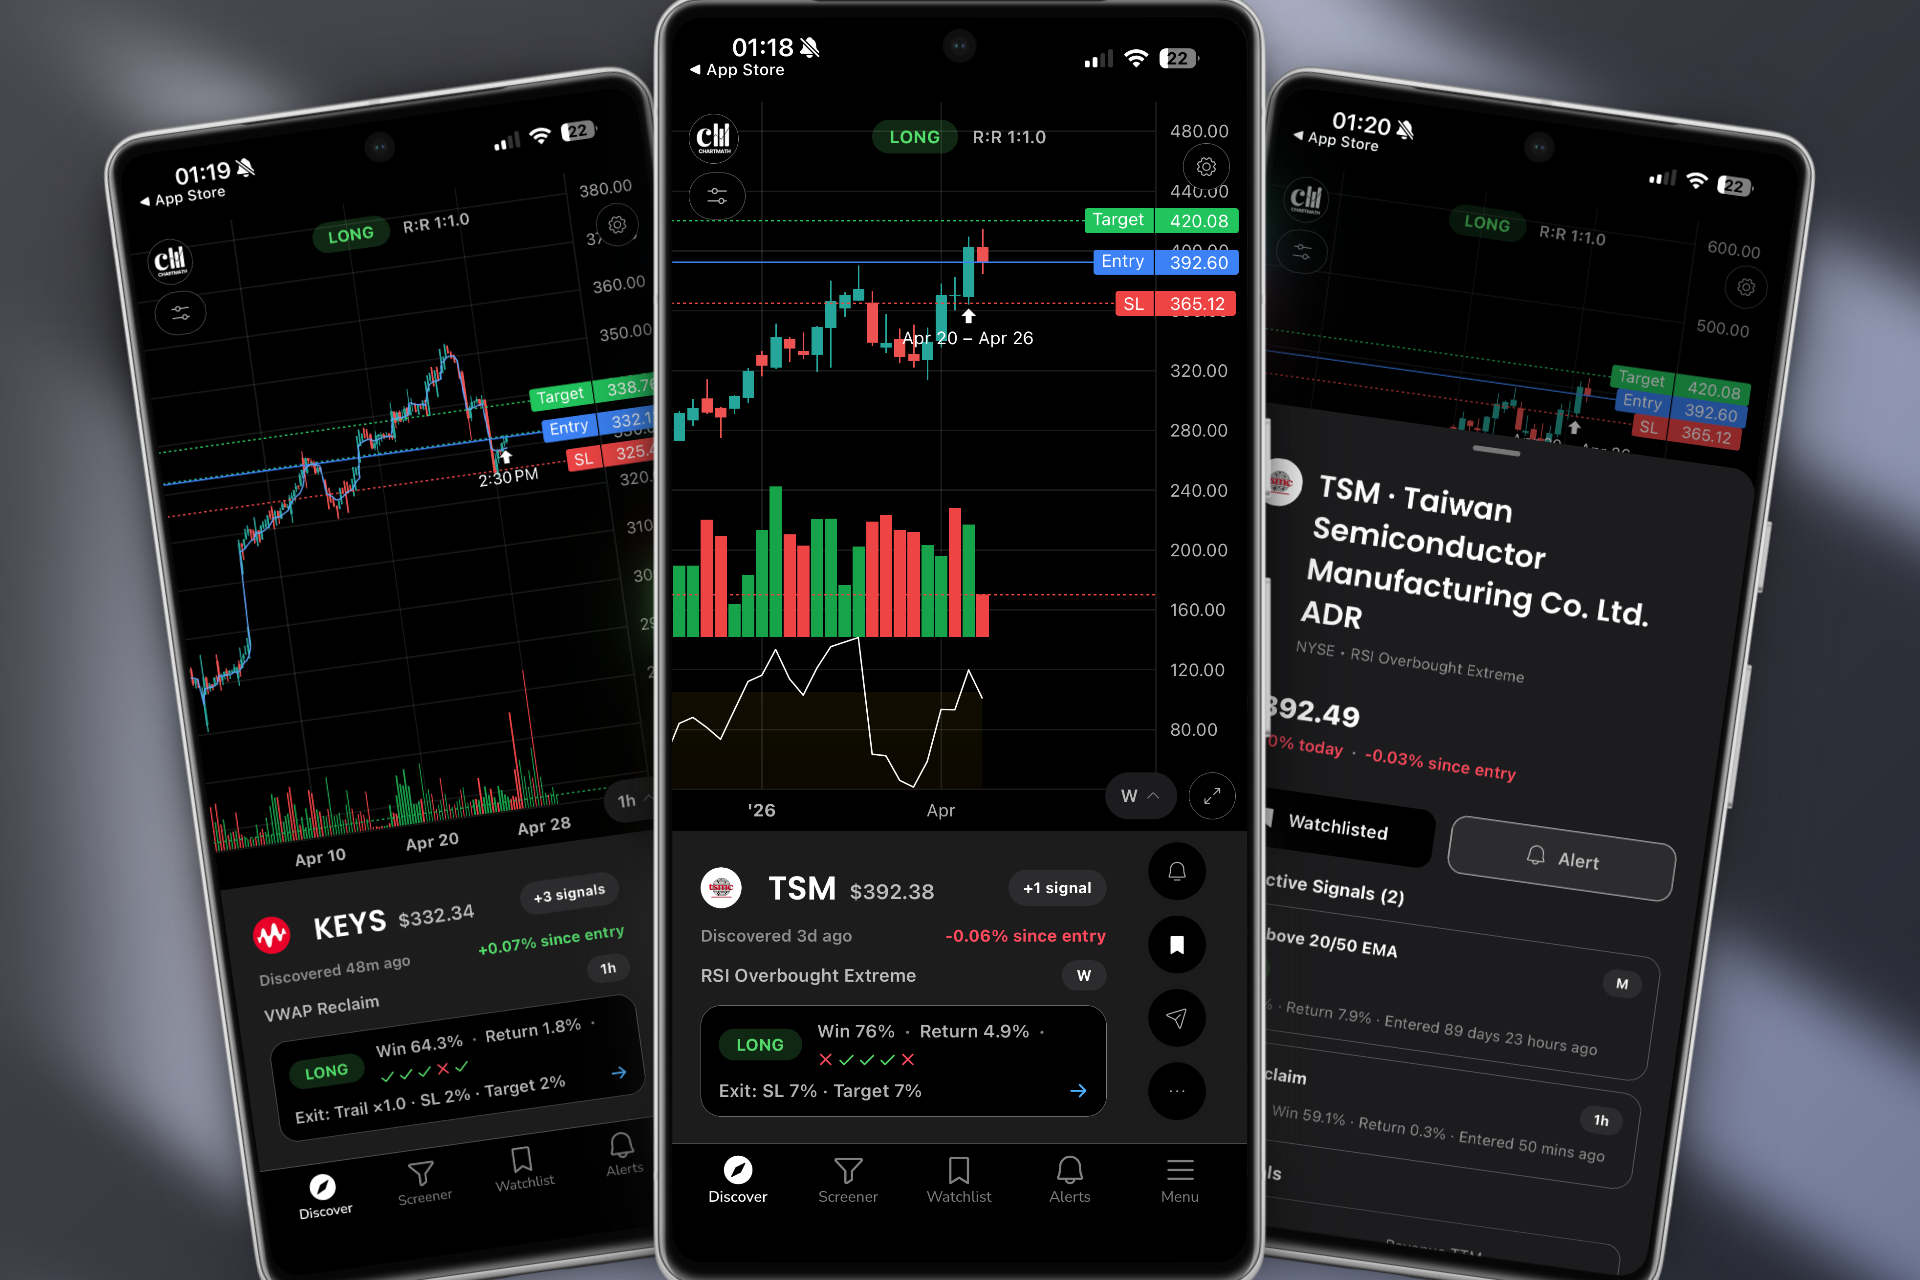
A useful alert for a day-job trader carries context. It tells you the ticker, the timeframe, the screen it matched, and a plain-English reason it fired. Something like: "NVDA entered the VWAP Reclaim screen on the 1-hour chart. Volume is elevated." Now you know whether it's worth stepping out to check. That's the difference between an alert that helps you and one that just adds to your anxiety.
ChartMath sends alerts via push and email, and each one carries exactly that context: ticker, timeframe, screen name, and a plain-English explanation of why it triggered. No SMS spam, no mystery pings. For more on how VWAP-based alerts work in practice, see VWAP Trading: How to Use Volume-Weighted Average Price.
Alert Fatigue Is a Real Problem
The other failure mode is the opposite: too many alerts. Platforms that send 50 to 100 notifications a day train you to ignore all of them. You stop checking. You miss the one that mattered. This is alert fatigue, and it's one of the most common reasons day-job traders give up on automated scanning entirely.
The fix is curation, not volume. You want alerts that fire only when a setup genuinely matches your criteria, backed by backtest data showing the setup has a real edge. ChartMath's 200+ curated technical screens are pre-validated: every screen ships with its historical Win Rate and Average Return, so you can choose which ones to follow based on evidence, not gut feel. Fewer alerts, higher signal. That's the goal.
For a full breakdown of how to manage alert volume without missing setups, see How to Trade Stocks Without Watching Screen All Day.
3. The Lunch-Break Check-In (10 Minutes)
You get roughly 30 to 45 minutes at lunch. That's enough time to review what fired during the morning session, evaluate one or two setups, and decide whether anything is worth acting on before the close. It is not enough time to start scanning from scratch.
What to Review at Lunch
Open your alerts from the morning. For each one that fired, ask three questions:
- Is the setup still intact? If a breakout triggered at 9:45 AM and the stock has already run 4%, the entry is gone. Move on.
- Does the broader market support this trade? A long breakout in a stock that's fighting a down-trending SPY is a harder trade. Not impossible, but harder.
- Do I have a pre-planned entry, stop, and target? If you did your postmarket prep the night before, you already know the answer. If you didn't, this is not the time to figure it out from scratch.
The lunch check-in is a filter, not a research session. You're deciding which of the morning's alerts are still actionable, not generating new ideas. Keep it to ten minutes and get back to your day.
Swing Setups vs. Intraday Setups at Lunch
One important distinction: swing setups on the daily chart are far more forgiving of a delayed entry than intraday setups. A daily chart breakout that triggered at 10:00 AM is often still valid at 12:30 PM. A 5-minute VWAP reclaim that fired at 10:00 AM is almost certainly over. If you're trading with a day job, daily and weekly timeframe setups are your friend. They give you a wider entry window and don't require you to act in the first five minutes.
4. The Postmarket Review: Your Most Important 20 Minutes
If you only have one block of focused trading time per day, make it the postmarket review. This is where the real work happens: evaluating what moved, understanding why, updating your watchlist, and setting tomorrow's alerts. Done consistently, this 20-minute routine compounds into a genuine edge over time.
What to Cover in Your Postmarket Review
Structure your review around four questions:
- What setups triggered today, and did they work? Review the alerts that fired. Did the setup follow through? If not, was it a setup failure or a market-conditions issue? This is how you build pattern recognition over time.
- What almost triggered? Tickers that came close to a screen entry but didn't quite get there are often the best candidates for tomorrow's watchlist. They're already in motion.
- What does the backtest data say about the setups I'm considering? Before adding a ticker to your watchlist, check the Win Rate and Average Return for the screen it's approaching. A screen with a strong historical win rate and a meaningful average return is worth watching. One with a weak track record isn't worth your capital.
- What are my levels for tomorrow? For every ticker on your watchlist, write down the entry trigger, stop-loss, and target before you close your laptop. Tomorrow-morning-you will thank tonight-you.
For a structured approach to validating setups before you risk capital, see How to Build Winning Backtesting Strategies: A Complete Guide.
Using Backtest Data in Your Review
One of the biggest advantages of using a tool with built-in backtest data is that you can evaluate setups objectively rather than emotionally. Instead of asking "does this chart look good?" you can ask "what has this screen historically done when it fires on a daily chart?" That's a fundamentally different question, and it leads to better decisions.
ChartMath shows Win Rate and Average Return for every screen, so your postmarket review can include a quick data check on any setup you're considering. You're not guessing at the edge. You're reading it. Note that backtests use bar-close entries with no look-ahead and do not model commissions, slippage, or spread, so treat them as directional evidence, not guarantees.
5. Which Tools Actually Support a Day-Job Trader's Schedule
Not all trading tools are built for people with jobs. Most of the major platforms were designed for traders who are at their desks all day, and it shows in their feature sets. Here's an honest breakdown of where the common tools fall short for day-job traders, and what to look for instead.
The Problem with Desktop-Only Platforms
Trade Ideas is a powerful scanner, but it's desktop-only and starts at $118 per month. If you're not at your desk, you're not using it. There's no mobile app, no push alerts to your phone, and the interface is complex enough that it takes real time to set up and interpret. For a full-time trader running a momentum strategy from a dedicated workstation, it's a serious tool. For someone checking in at lunch from their phone, it's the wrong fit. See Switching from Trade Ideas to a Cheaper Scanner: What You'll Gain and Lose for a detailed comparison.
Finviz is the first screener most traders bookmark, and for good reason: it's fast, free, and the filter interface is solid. But Finviz updates end-of-day. If a breakout happens at 11:00 AM, Finviz won't show it until after the close. For a swing trader doing postmarket prep, that's fine. For catching intraday setups while you're at work, it's a dead end.
What a Day-Job Trader Actually Needs
The tool requirements for a day-job swing trader are specific:
- Mobile-first design. You're checking setups on your phone, not a second monitor. The app needs to be fast, readable, and actionable on a 6-inch screen.
- Push alerts with context. Not just a ticker and price. A reason. What screen fired, what timeframe, why it matters.
- Backtested screens, no coding required. You don't have time to write Pine Script. You need screens that are already validated and ready to use.
- Curated universe, not the whole market. Scanning 8,000 stocks generates noise. A curated universe of high-quality setups generates signal.
ChartMath is built around exactly this profile. It scans 500+ US equities, 100 crypto pairs, and 11 US futures across 200+ curated technical screens and 7 timeframes (1-minute to monthly). Every screen ships with its Win Rate and Average Return. Alerts go out via push and email the moment a ticker matches a setup. No Pine Script, no coding, no desktop required. It's designed to be a discovery layer alongside the charting platform you already use, whether that's TradingView, TrendSpider, or something else. You can browse all 200+ screens directly at chartmath.com/screens before downloading anything.
For a broader look at how to build a complete trading stack around a day-job schedule, see Daily Chart Swing Trade Setups: A Scanner Workflow.
6. Position Sizing and Risk Management for Part-Time Traders
Position sizing matters more for day-job traders than for anyone else. When you can't monitor a position intraday, you need to know that your downside is defined before you enter. A trade that requires active management is a trade you shouldn't be in.
Set Your Levels at Entry
Every swing trade you place should have three things defined before you hit the buy button: your entry price, your stop-loss, and your take-profit target. Not "I'll figure out the stop when I check at lunch." Defined, in your broker, before the position is open.
ChartMath's exit framework covers five types: end-of-day, N-bar (exit after a set number of bars), stop-loss, take-profit, and trailing stop-loss. When you're reviewing a setup in the app, you can see how different exit configurations have historically performed for that screen. That gives you a data-informed starting point for setting your levels, rather than guessing.
Size for the Worst Case
A simple rule for part-time traders: size every position so that if your stop-loss hits, you lose no more than 1% to 2% of your total account. This is standard risk management advice, but it's especially important when you can't watch the position. A 1% loss on a bad trade is recoverable. A 10% loss because you sized too large and couldn't cut it in time is not.
The math is straightforward. If your account is $25,000 and you're willing to risk 1% per trade, that's $250 of risk. If your stop-loss is $2 below your entry, you can buy 125 shares. That's your position size. Do this calculation before every trade, not after.
Let Backtest Data Inform Your Confidence
Position sizing isn't just about limiting losses. It's also about sizing up on high-conviction setups. A screen with a strong historical Win Rate and a meaningful Average Return, across a large sample size, gives you more reason to size toward the higher end of your range. A screen with a thin track record warrants a smaller position. The data doesn't guarantee anything, but it gives you a rational basis for your sizing decisions. For more on using RVOL and volume data to confirm setup quality, see Volume Analysis for Day Traders: How to Use RVOL and Volume Spikes.
7. Putting It All Together: Your Weekly Swing Trading Schedule
Here's what a realistic weekly schedule looks like for a trader with a 9-to-5. This isn't aspirational. It's the minimum viable routine that keeps you in the game without burning out or missing your day job.
Sunday (30 Minutes): Weekly Setup
- Review the weekly chart on your watchlist tickers. Which ones are approaching key levels?
- Check the broader market trend. Is SPY in a healthy uptrend, consolidating, or breaking down?
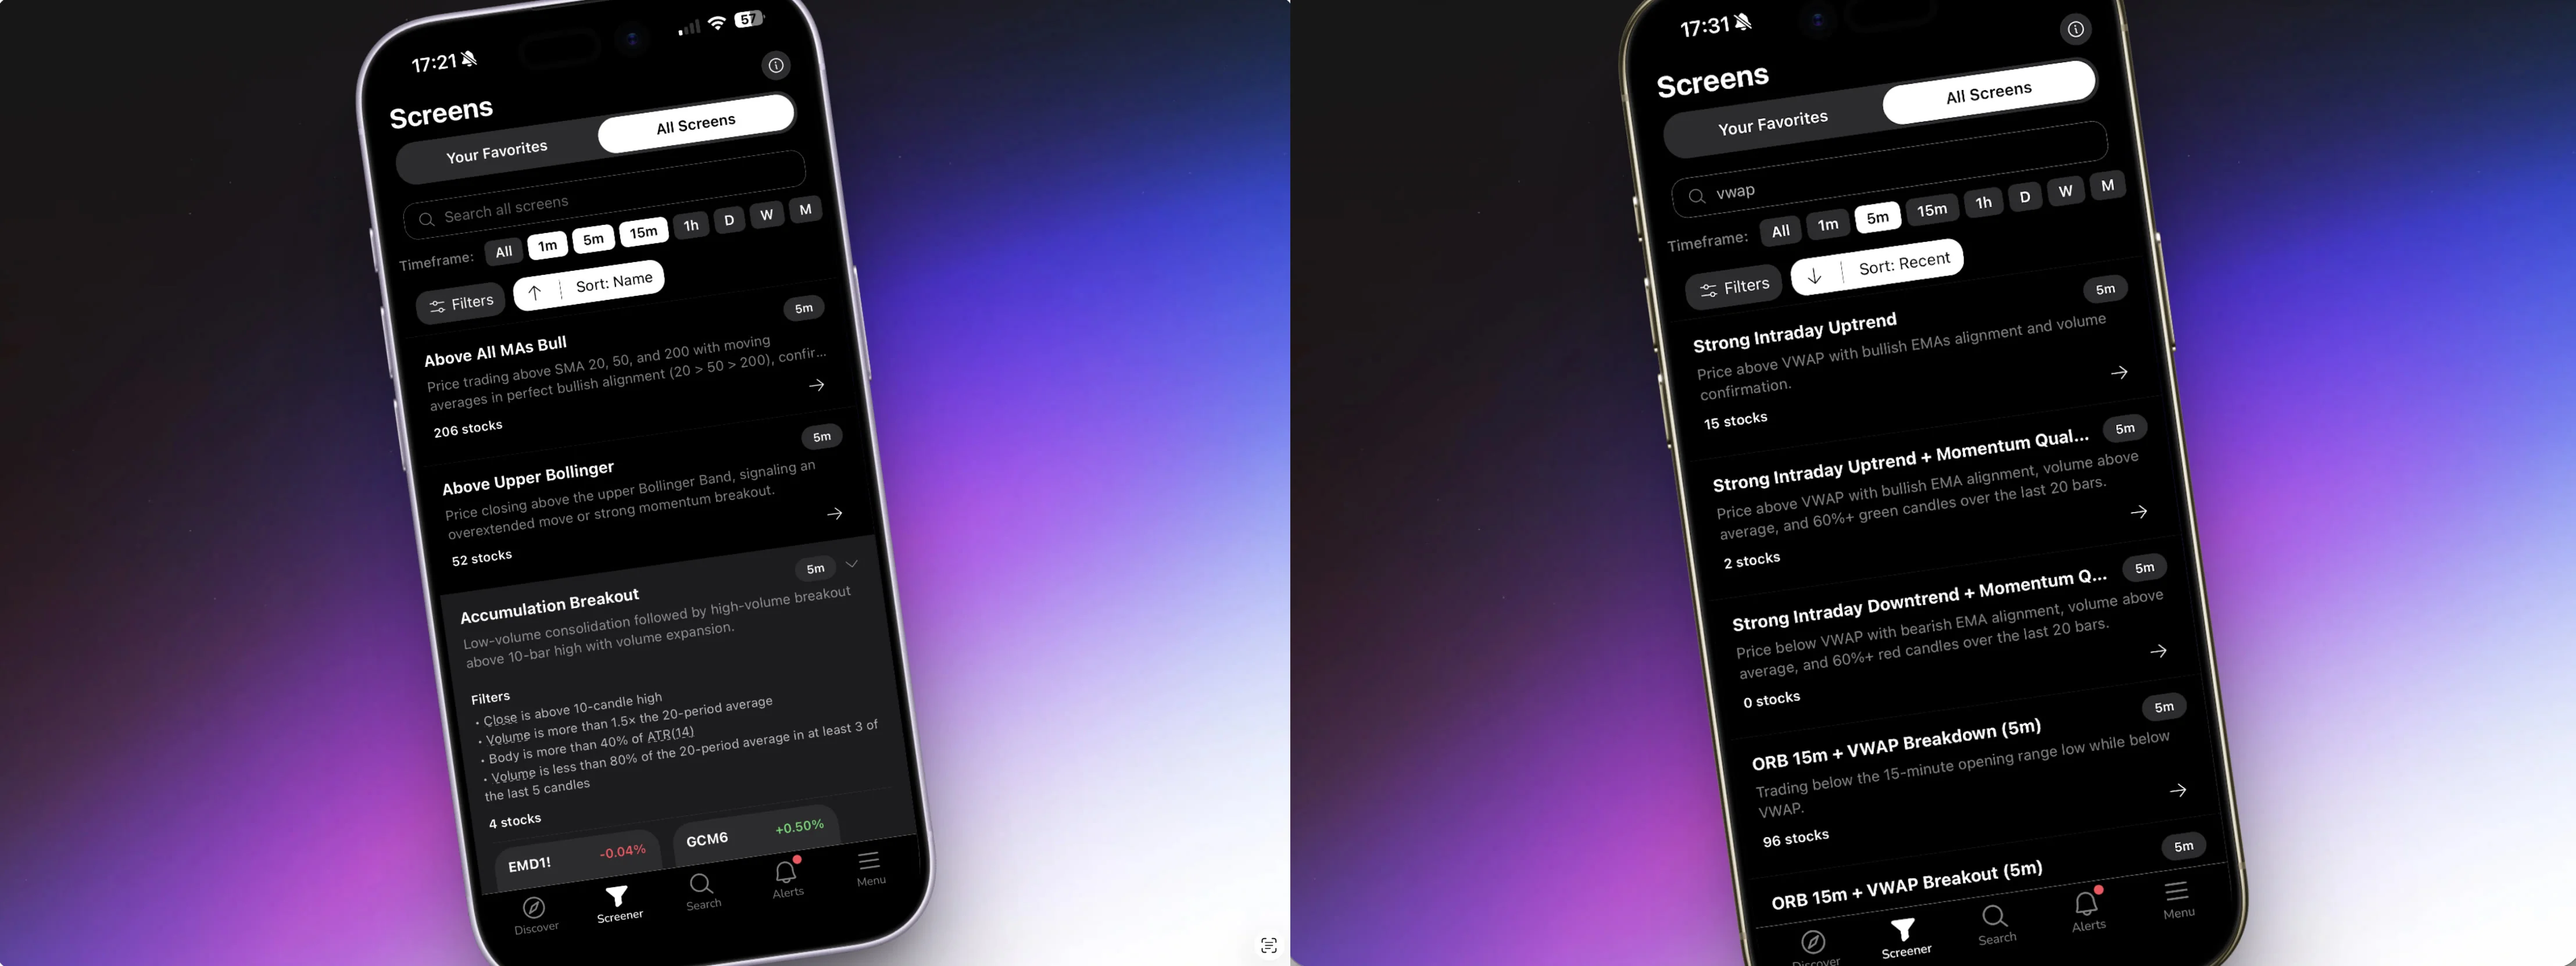
- Browse ChartMath's Screener tab to see which screens have the most active setups heading into the week. Favorite the screens that match your strategy so alerts are ready to fire.
- Set your watchlist for the week. Aim for 5 to 10 tickers, not 50.
Monday to Friday (35 Minutes Total Per Day)
Premarket (5 minutes, before work): Check overnight gaps on your watchlist. Note any news. Confirm your alert settings are active. That's it.
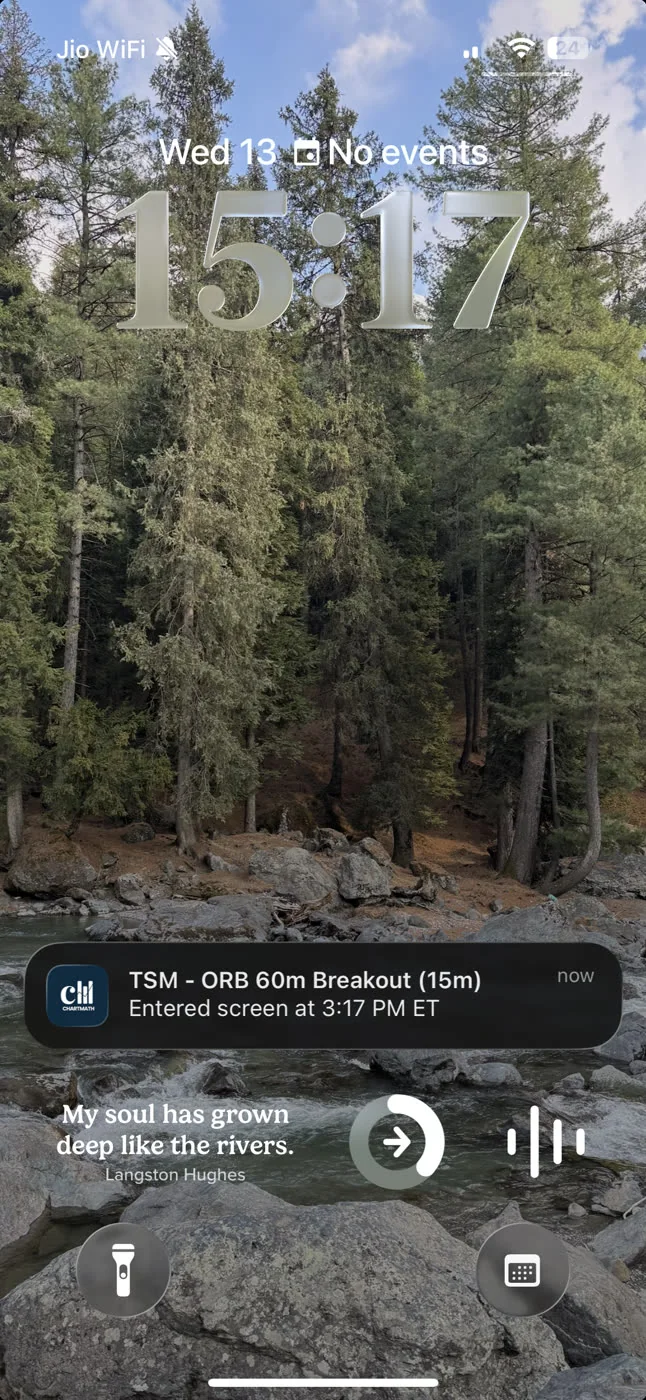
During the day (passive): Let ChartMath's alerts run in the background. Push notifications arrive on your phone when a ticker enters a screen you're following. You don't need to check anything. If an alert fires, glance at it. If it's worth acting on, you have the context to decide in 30 seconds.
Lunch (10 minutes, optional): Review morning alerts. Filter for setups that are still intact. If one meets your pre-planned criteria, place the trade with your stop and target already set. If nothing qualifies, close the app and eat your lunch.
Postmarket (20 minutes, after work): This is your main session. Review what fired, what moved, what almost triggered. Update your watchlist. Set tomorrow's alerts. Write down your levels. Done.
How ChartMath's Screens and Timeframes Fit Each Phase
ChartMath scans across 7 timeframes: 1-minute, 5-minute, 15-minute, 1-hour, daily, weekly, and monthly. For a day-job swing trader, the daily and weekly timeframes are your primary focus. They generate setups with wider entry windows and longer holding periods, which means you don't need to act in the first five minutes after an alert fires.
The 200+ curated screens cover the setups most swing traders actually use: 52-week high breakouts, VWAP reclaims, RVOL spikes, momentum continuation, opening range breakouts, and more. You don't build these screens. You pick the ones that match your strategy, favorite them, and let the alerts come to you. No Pine Script, no coding, no manual scanning.
The Discover tab surfaces a swipe-based feed of the strongest current setups across all screens, ranked by backtested reliability and recency. It's the fastest way to find what's moving right now without opening a screener and running filters from scratch. Think of it as your morning briefing, delivered to your phone.
"The system does the scanning. You make the call." That's the only way swing trading with a full-time job actually works at scale.
Frequently Asked Questions
Can you really swing trade successfully with a full-time job?
Yes, but only with the right system. The traders who succeed are the ones who automate their scanning, use explainable alerts, and do their research after hours rather than trying to monitor positions intraday. The strategy matters less than the workflow.
How much time do I need to trade with a day job?
The routine outlined in this guide requires roughly 35 minutes per day: 5 minutes premarket, 10 minutes at lunch (optional), and 20 minutes postmarket. The Sunday weekly setup takes about 30 minutes. That's it. The rest is handled by automated scanning and alerts.
What timeframes work best for day-job traders?
Daily and weekly charts are the most practical for traders who can't monitor positions intraday. They give you wider entry windows, longer holding periods, and more time to act on alerts. ChartMath covers 7 timeframes from 1-minute to monthly, so you can focus on the ones that fit your schedule.
Do I need to know how to code to use a stock scanner?
Not with ChartMath. The 200+ screens are pre-built and curated. You pick the ones that match your strategy and turn on alerts. No Pine Script, no coding, no setup beyond downloading the app. For a full breakdown of what you get without writing a single line of code, see Stock Scanner Without Pine Script: 200+ Ready-Made Screens.
How do I avoid alert fatigue from a stock scanner?
Choose a scanner that sends alerts only when a setup genuinely matches a curated, backtested screen, not every time a stock moves. ChartMath's alert system includes de-duplication, throttling, and per-bar caps so you get signal, not noise. For more on managing alert volume, see How to Integrate Trading Alerts with Your Charting Platform.
What is the best stock scanner for swing traders with a day job?
The best scanner for a day-job trader is mobile-first, sends push alerts with context, covers backtested screens without requiring coding, and works alongside the charting platform you already use. ChartMath is built specifically for this profile. It starts with a 14-day free trial, with every screen, backtest, and alert included and no card required to start — then $24.99/mo at the founding rate (locked 12 months) or $149/yr.
Start Trading on Your Schedule
Swing trading with a full-time job isn't about finding more time. It's about building a system that works within the time you have. The premarket prep, the automated alerts, the lunch-break filter, the postmarket review: each piece is small on its own. Together, they form a workflow that keeps you in the market without keeping you glued to a screen.
The missing piece for most day-job traders is the scanning layer. Manually refreshing a screener every night is not a system. It's a chore that scales badly and misses most of the market. Automated, explainable alerts from backtested screens are the upgrade that makes everything else work.
ChartMath starts with a 14-day free trial — every screen, every backtest, every alert, no card to start (then $24.99/mo founding, locked 12 months, or $149/yr). It scans 500+ US equities, 100 crypto pairs, and 11 US futures across 200+ curated technical screens, and sends push and email alerts the moment a setup matches your criteria. You keep the final call. The system does the scanning.
Download the app at chartmath.com/app and run your first postmarket review tonight. Or browse all 200+ screens right now at chartmath.com/screens to see which setups are live before you commit to anything. Your next entry is already out there. The question is whether your system will find it before it moves.

Ankush Jindal
LinkedInSee these setups live in ChartMath
200+ curated screens with backtest data. 14-day free trial.