Entry Timing for Conviction Stocks You Own

You've done the research. You know the company, you've read the filings, you believe in the thesis. The stock is already on your watchlist — maybe you already own some. The question isn't what to buy. It's when.
That gap between conviction and timing is where a lot of good ideas quietly underperform. You buy too early, into strength, right before a pullback. Or you wait too long, miss the reset, and end up chasing. Neither outcome is a failure of research. Both are failures of timing — and timing is a solvable problem.
This guide is for the investor with a day job who owns a handful of names they believe in and wants a systematic way to time entries and adds. Not day-trading. Not stock-picking. Just a disciplined process for getting into your conviction names at better levels, with evidence behind each decision.
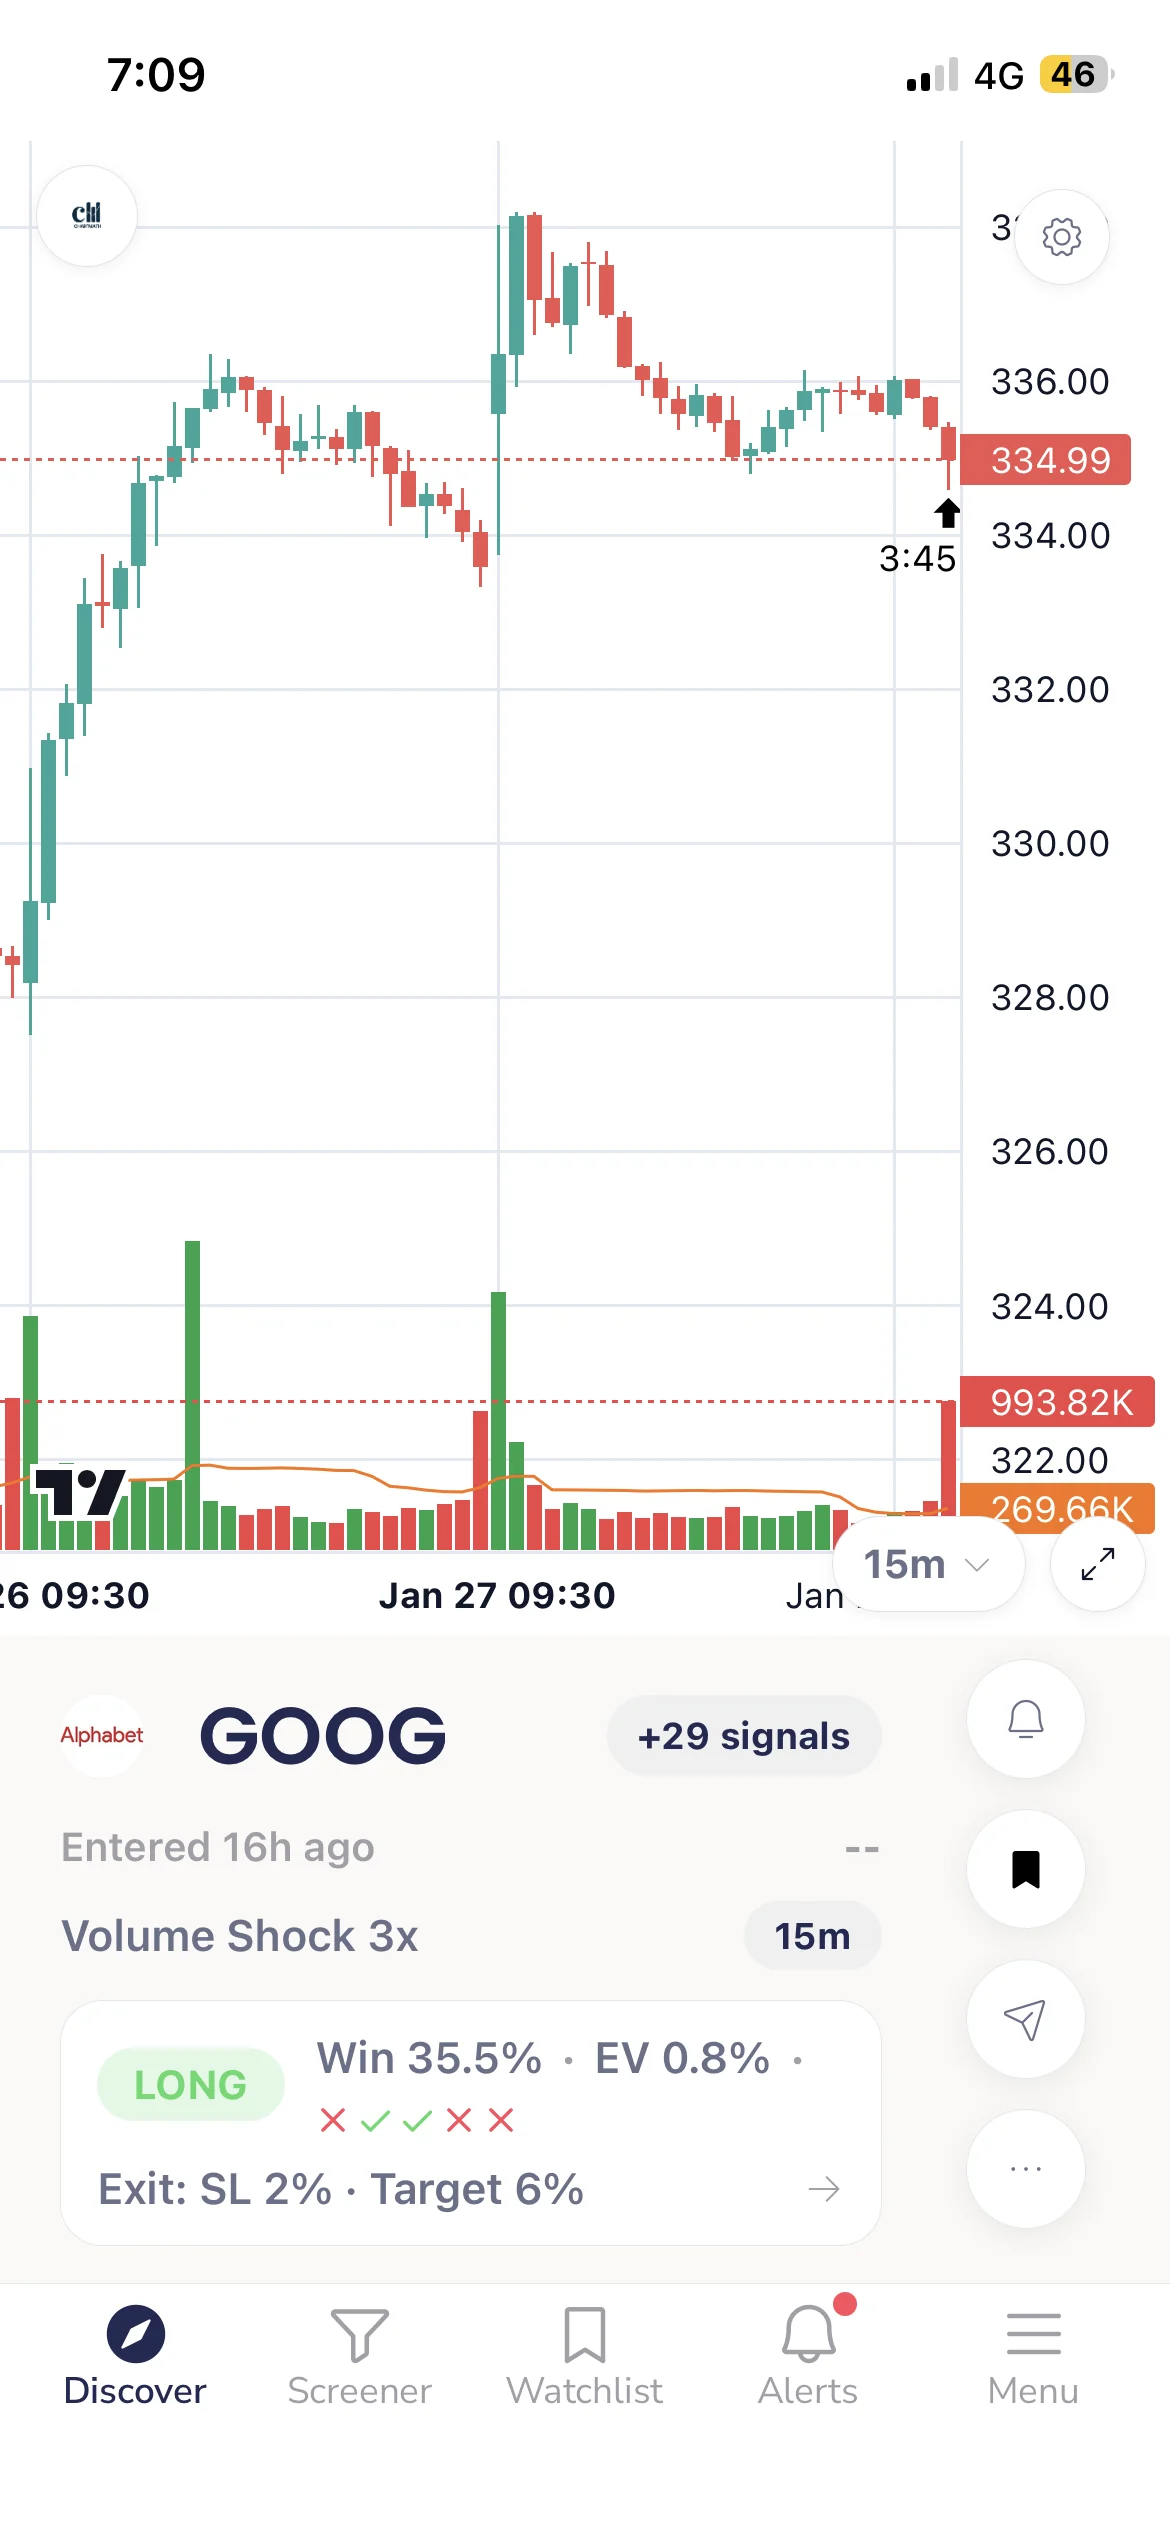
Take the chart above. GOOG just triggered a long signal on a ChartMath screen (a Volume Shock setup), the kind of nudge a long-term holder can actually use. That points to the core idea here: you can use ChartMath two ways on a name you already own. A long signal that lines up with a level you wanted to add at is a green light to time the entry. A short signal, conditions that have historically preceded a few days of downside, is a reason to hold off and let the pullback come to you before you add more. Either way you keep your thesis; the tool just answers the "now, or wait?" question.
The Gap Between Conviction and Timing
Fundamental conviction tells you what to own. Technical timing tells you when to buy more. These two things are not in conflict, they operate on different timeframes and answer different questions.
A stock you believe in at $80 is still a stock you believe in at $72. But if you bought at $80 and it drops to $72 before recovering, you've spent three months underwater, second-guessing a thesis that was right all along. A better-timed entry at $72, at a pullback to a key support level, would have given you a lower cost basis, a tighter stop, and the psychological room to hold through the noise.
That's the case for entry timing on conviction names. It doesn't change your thesis. It improves the conditions under which you execute it.
The challenge is that most investors with day jobs don't have time to monitor charts. They can't sit at a screen at 10:30 AM waiting for a stock to touch its 20-day moving average. They need a system that does the watching for them and pings them when the moment arrives. That's exactly what this guide covers.
Why Entry Timing Matters Even for Long-Term Holders
There's a common objection here: "I'm a long-term investor. Does entry timing really matter?" For a 10-year hold, the difference between buying at $80 and $72 might feel trivial. But for the investor who adds to positions over time, building a stake across multiple entries, timing each add matters quite a bit.
A poorly timed add has two costs. The obvious one is the immediate drawdown: you add at $80, the stock pulls back to $68, and now your average cost is higher than it needed to be. The less obvious cost is psychological. A large unrealized loss on a position you just added to is exactly the kind of thing that shakes conviction at the worst moment, right before the recovery.
Better-timed entries, at technical reset levels with evidence behind them, give you a lower average cost and a stronger foundation to hold through volatility. That's not day-trading. That's disciplined position building. And it's entirely compatible with a buy-and-hold philosophy.
For a deeper look at how to build a systematic trading workflow around this kind of approach, the guide on building an efficient trading workflow in 2026 covers the full picture.
1. Define Your Entry Levels Before the Stock Gets There
The most important rule in entry timing is simple: decide your level before the stock reaches it, not after. When a stock is already pulling back, emotions run high. Prices feel like they're falling forever. The temptation is to wait for "more confirmation", which usually means waiting until the stock has already bounced and the opportunity has passed.
Defining your levels in advance removes that emotional variable. Here are the three most common technical levels worth watching on conviction names:
- Pullback to the 20-day moving average: On a stock in an uptrend, the 20-day MA often acts as dynamic support. A pullback to this level, especially after a period of strength, is a common reset point that many systematic traders use as an add trigger.
- RSI reset on the daily chart: When a stock's Relative Strength Index drops back toward the 40-50 zone after an extended run, it often signals that short-term momentum has exhausted without the underlying trend breaking. This is a momentum reset, not a reversal.
- Retest of prior support or a breakout level: When a stock breaks out of a base and then pulls back to retest the breakout level, that retest is often the cleanest add opportunity. The level that was resistance has now become support.
Write these levels down before the stock gets there. Attach a condition: "I'll consider adding if X touches the 20-day MA on the daily chart with RSI between 40 and 50." That's a rule, not a reaction.
Understanding how to read and act on these setups is also covered in the guide to daily chart swing trade setups and scanner workflows.
2. Match Your Level to a Backtested Screen
Once you know what you're looking for, the next step is connecting that level to a screen with a documented historical edge. This is where the process shifts from intuition to evidence.
Long Signal vs Short Signal: Add, or Hold Off
The direction of the signal tells a holder exactly how to act on a name they already own:
- A long signal means the setup that has historically preceded an upward move is firing now. If it coincides with a level you already wanted to add at, that is your green light to time the entry.
- A short signal means the screen sees conditions that have historically preceded a move lower over the next several days. On a stock you own and still believe in, that is not a sell-your-thesis alarm. It is a reason to hold off and let the pullback play out before you add more. Adding into a fresh short signal is buying right before the dip you were trying to time around.
You stay long-term bullish on the name. The signal only tells you whether now is a good moment to put new money in, or whether to wait for a better one.
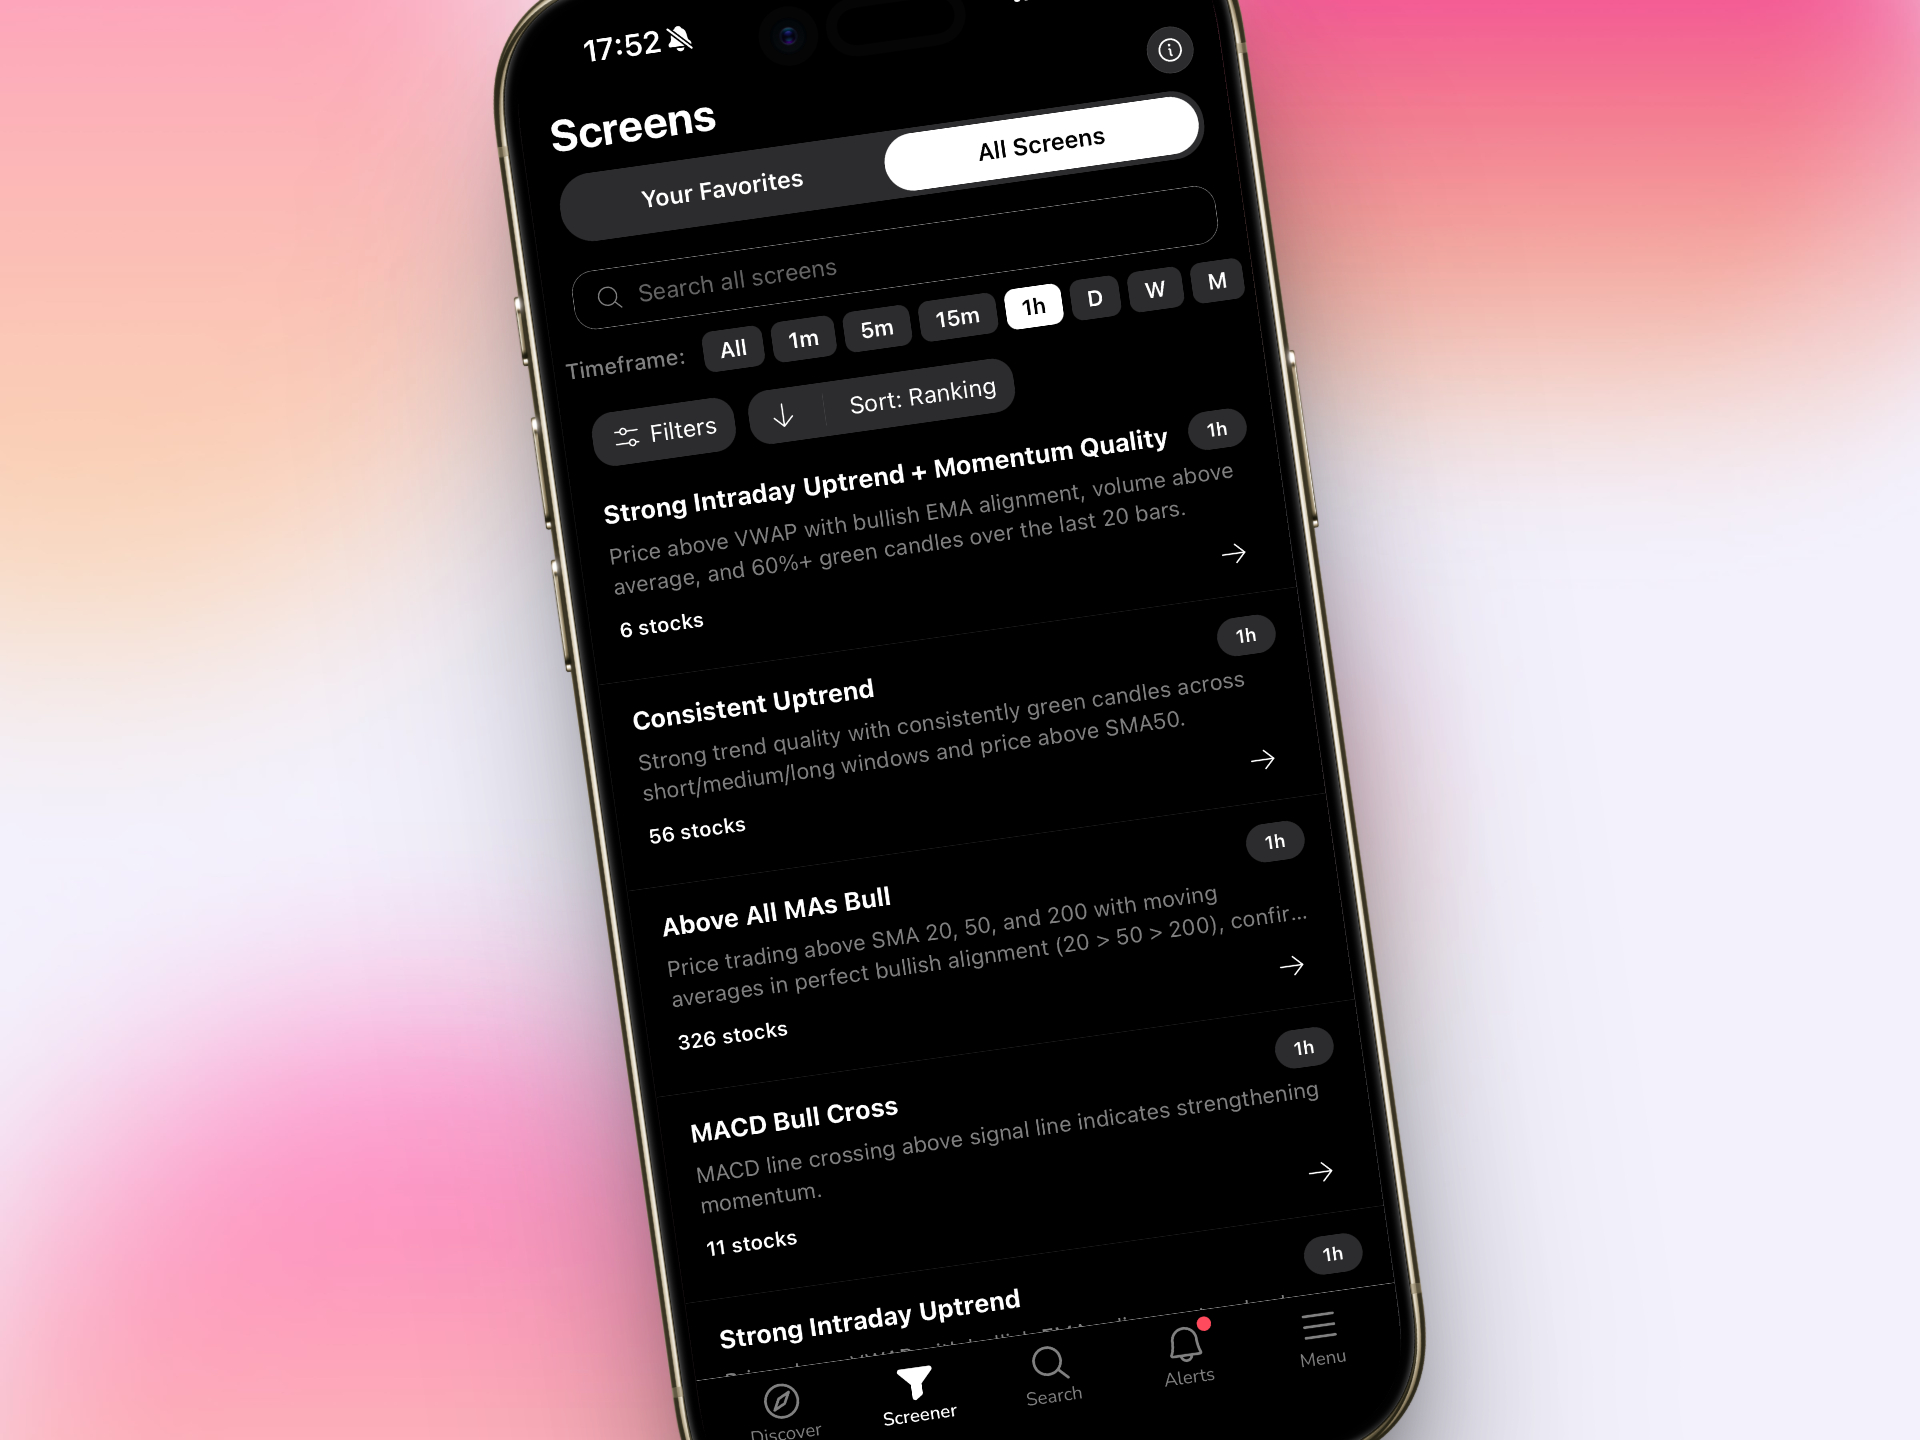
ChartMath scans 500+ US equities across 200+ curated technical screens, covering exactly the kinds of setups described above: pullbacks to moving averages, RSI resets, low-volatility compressions, accumulation breakouts, VWAP reclaims, and more. Every screen shows its historical Win Rate and Average Return, not a gut-feel signal, but a documented track record across historical occurrences.
The key distinction here is that you're not using ChartMath to find new stocks. You already know what you want to own. You're using it to find the right technical moment on a name you've already chosen. That's a fundamentally different use case from a stock screener, and it's one that fits naturally into a conviction-based investing approach.
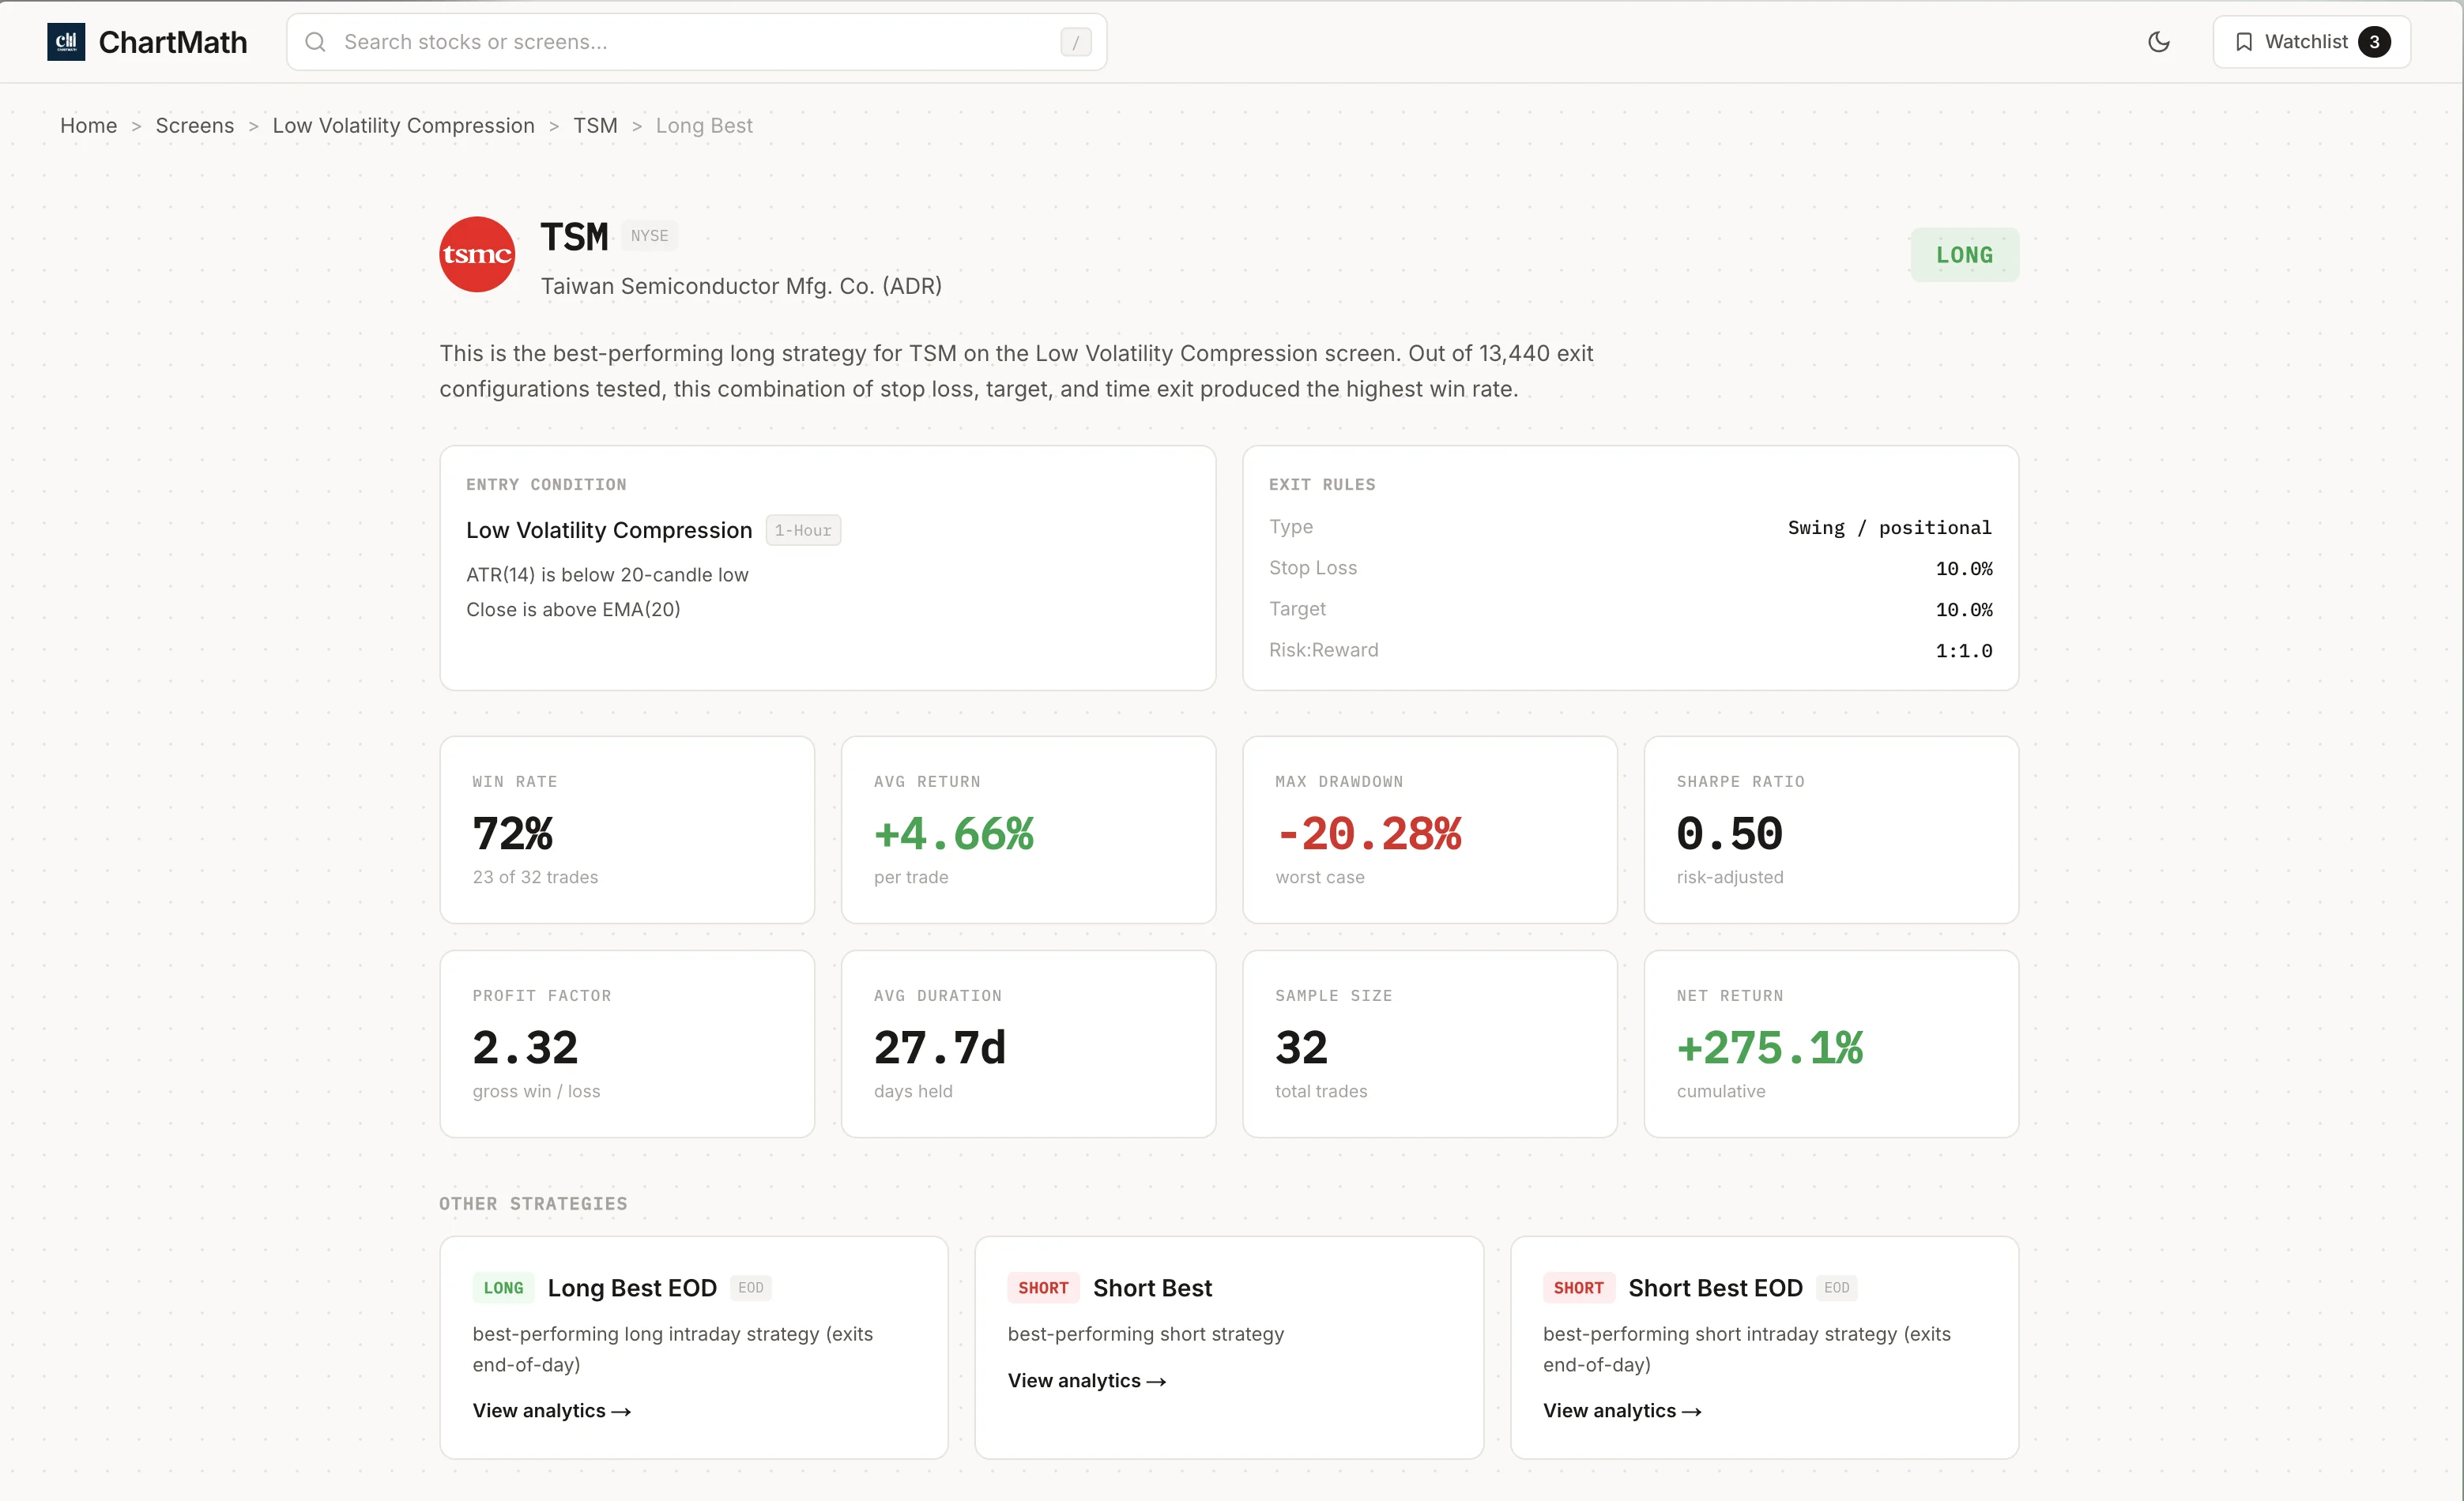
For example: you own a semiconductor name you believe in. You've identified the 20-day MA as your add level. You open ChartMath's screen library and find a Low Volatility Compression screen or a Pullback to MA screen that matches your criteria. You can see the screen's historical Win Rate and Average Return across past occurrences on similar setups. Now you have evidence behind the timing decision, not just a feeling.
The screens are curated and read-only, there's no coding, no Pine Script, no need to build anything from scratch. You browse the library, find the screen that matches your setup criteria, and move to the next step. For a full look at what's available, the ChartMath screen library is browsable without signing in.
If you're new to how backtested screens work and why Win Rate matters (and when it doesn't), the guide on building winning backtesting strategies is worth reading first.
3. Set the Alert and Step Away From the Chart
This is the step that makes the whole system work for someone with a day job. Once you've identified the screen that matches your entry criteria, you favorite it in ChartMath. From that point, ChartMath monitors your conviction name against that screen continuously, across 7 timeframes from 1-minute to monthly, and sends you a push alert the moment the stock enters the setup.
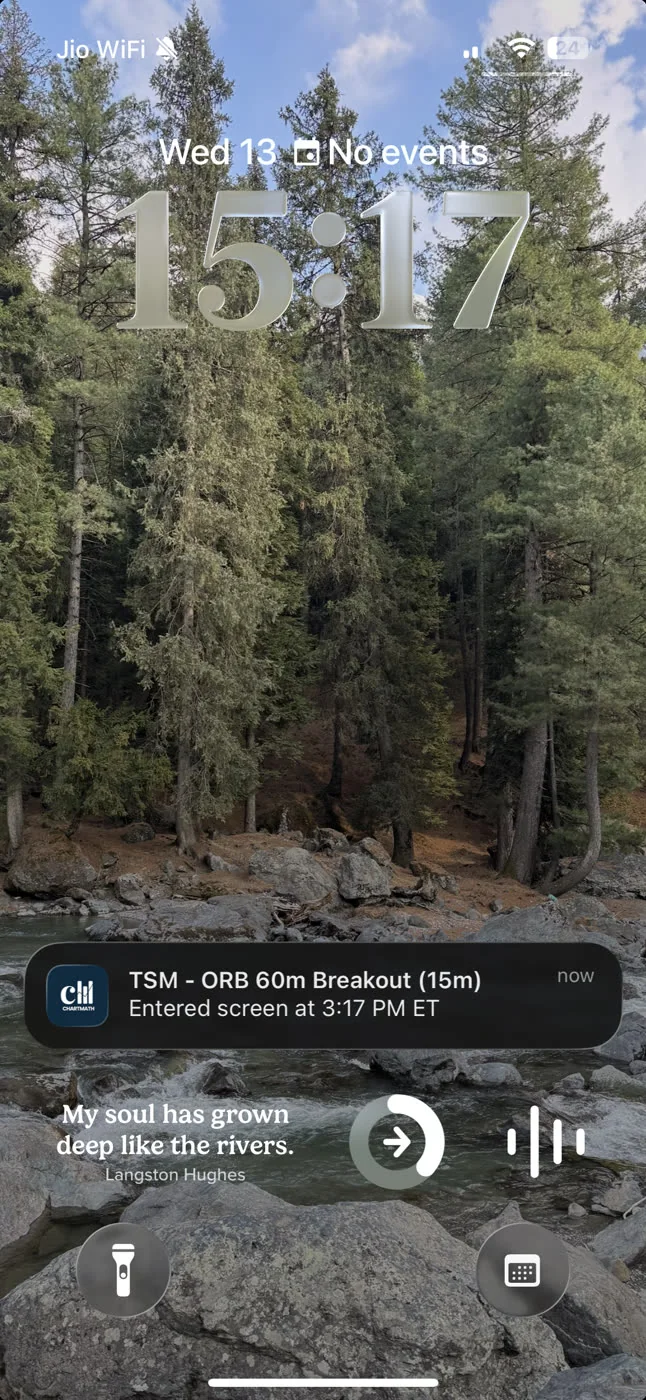
The alert payload is specific: it includes the ticker, the timeframe, the screen name, a plain-English explanation of why it fired, and a deep link back to the setup card. You don't get a vague "AAPL moved" notification. You get "AAPL entered the Low Volatility Compression screen on the Daily timeframe" with the reason spelled out in plain English.
Alerts go out via push notification and email. No SMS, no noise from unvalidated signal groups, no Discord channels full of promotions. Just a clean, specific ping when your name enters the setup you defined.
The practical implication: you set this up once, in 15-20 minutes per name. Then you go back to your day. The monitoring happens in the background. When the alert fires, whether you're in a meeting, at lunch, or on a call, you get the ping and decide what to do next. You're not staring at a chart. You're not refreshing a screener. You're living your life until the evidence says it's time to look.
This is the core of what it means to trade stocks without watching the screen all day, a system that monitors for you and only interrupts when something specific and pre-defined happens.
4. Review the Evidence Before You Add
When the alert fires, you have a decision to make. This is the copilot moment: ChartMath has surfaced the signal, but you make the call. Here's what to check before you act.
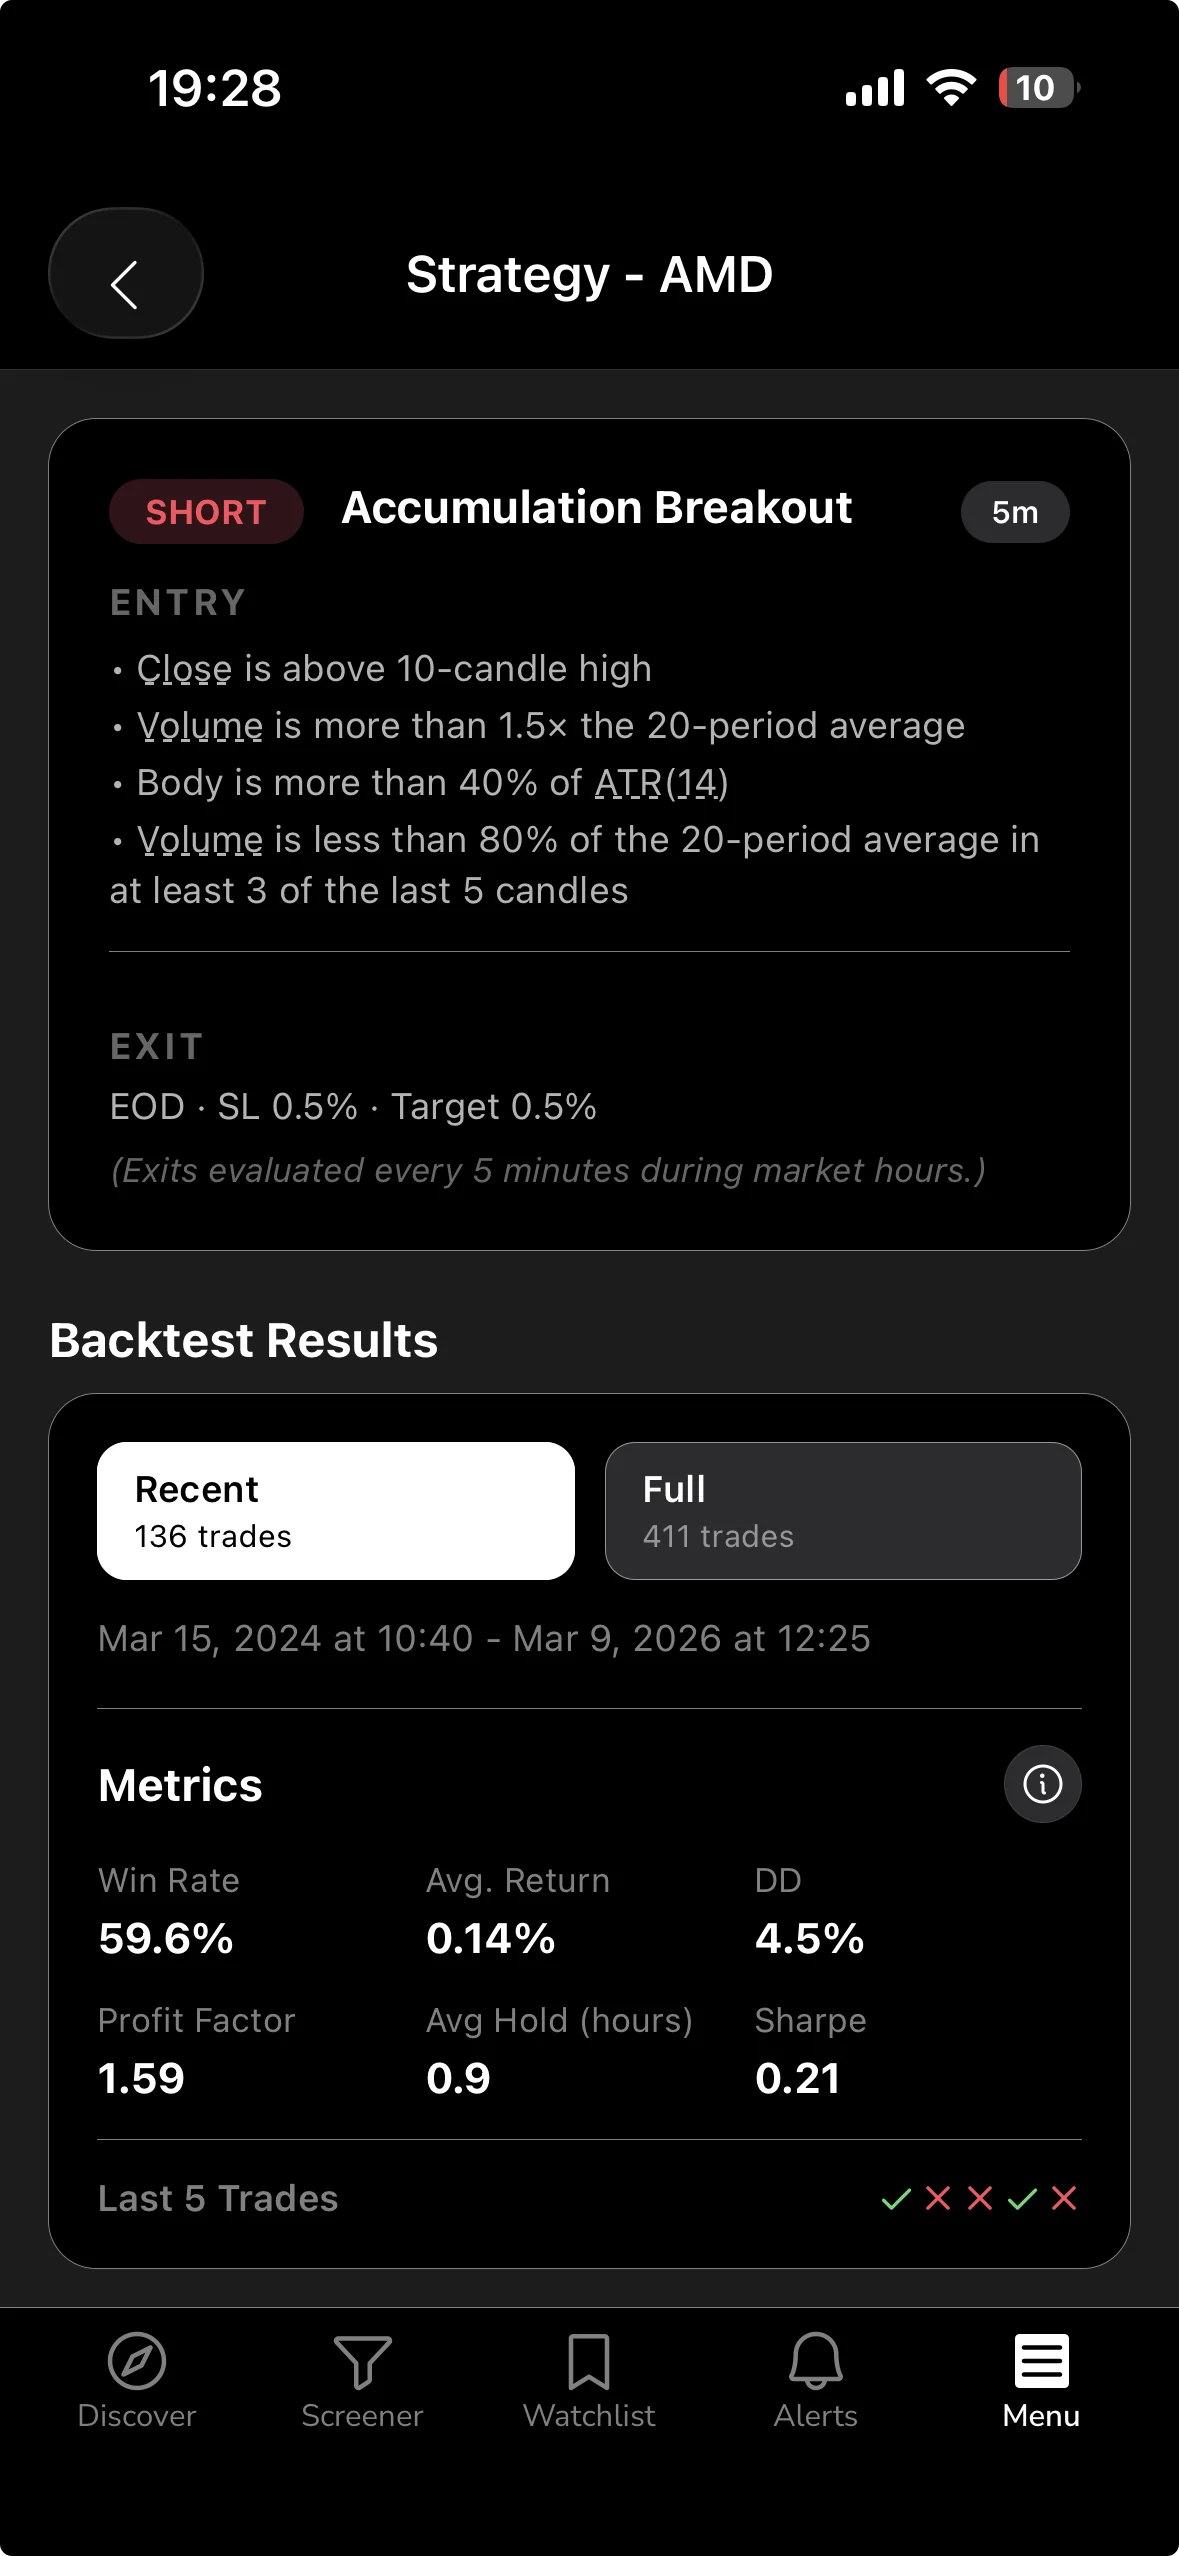
Open the setup card. The Win Rate and Average Return for that screen are right there. Check the sample size, more historical occurrences means more reliable data. A screen with 15 occurrences tells you less than one with 80. Both numbers matter.
Confirm the setup still fits your thesis. Has anything changed fundamentally since you set the alert? If the company reported bad earnings last week and you've revised your view, the technical signal doesn't override that. The technical setup is a timing tool, not a thesis replacement. Your fundamental conviction is still the primary filter.
Check the timeframe. A Daily chart signal is more meaningful for a swing add than a 15-minute signal. Match the timeframe of the alert to the timeframe of your original thesis. If you're building a long-term position, you probably care more about the Daily or Weekly setup than the 1-hour.
This review takes two to three minutes. It's not a deep research session, you've already done that research. It's a quick confirmation that the technical moment aligns with the fundamental view you already hold. Then you execute in your own broker. ChartMath has no broker connection and places no orders. You make the call, you place the trade.
5. Size the Add With Evidence, Not Emotion
The final piece is position sizing. This is where most investors make the same mistake twice: they size their adds based on how strongly they feel about the stock, not on the evidence in front of them.

A more systematic approach uses the screen's historical data to inform the size. A setup with a strong Win Rate and a meaningful Average Return across a large sample of occurrences gives you more confidence than a setup with thin data. That confidence can translate into a slightly larger add, within your overall risk framework.
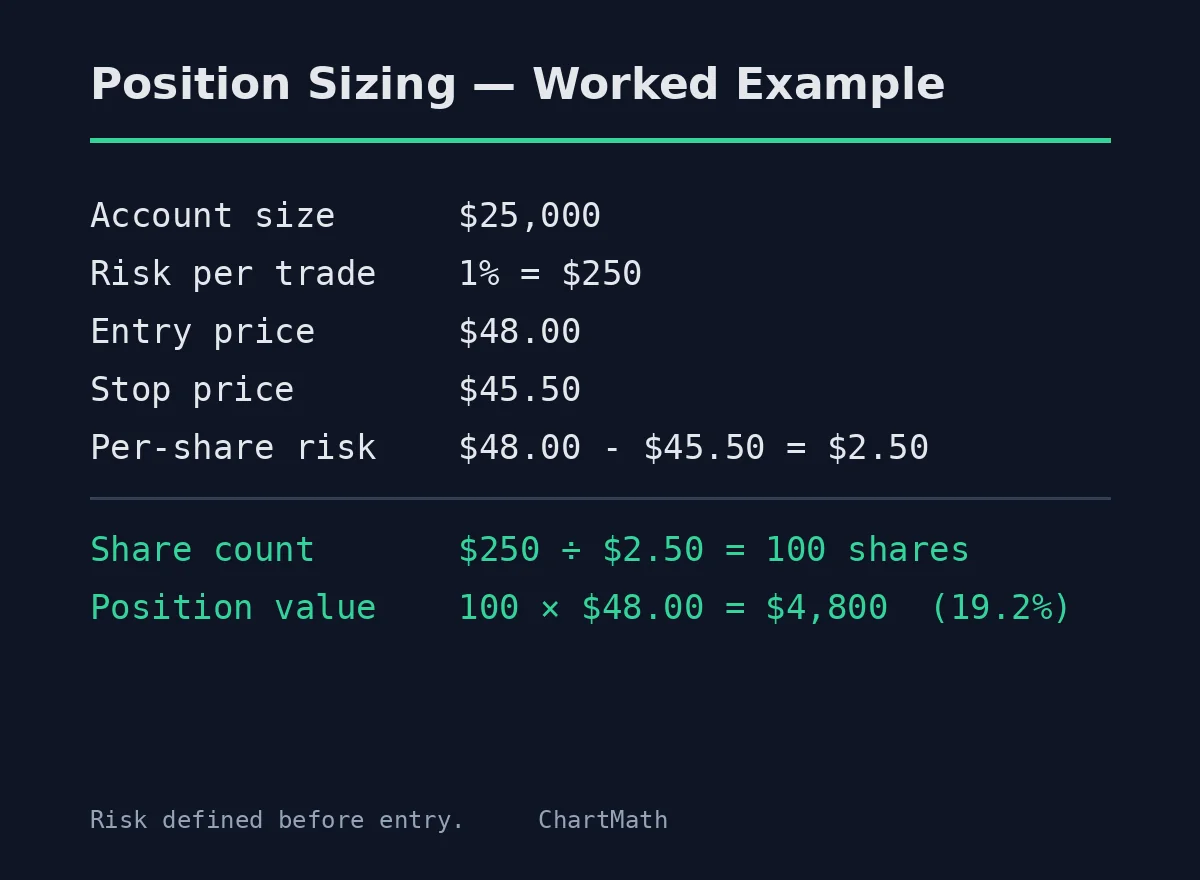
The math still applies regardless of conviction. If you're adding to a position, define the risk per share (entry minus stop), decide the maximum dollar amount you're willing to lose on this add, and calculate the share count from there. The position sizing guide on swing trading with a full-time job walks through this calculation in detail.
The goal across multiple adds is to build the position at progressively better average costs, with each add backed by a specific technical setup and a defined risk amount. Over time, this approach gives you a lower average cost basis than buying all at once, and it keeps each individual add within a risk limit you've pre-approved.
One important note: ChartMath's backtests use bar-close entries and do not model commissions, slippage, or spread. The Win Rate and Average Return figures are historical and educational, they inform your decision, they don't guarantee an outcome. Treat them as evidence, not certainty.
Putting It Together: A Practical Workflow
Here's the full process, end to end, for a conviction name you already own or plan to build a position in:
- List your conviction names. These are stocks you've researched and believe in. You're not looking for new ideas here, you're working with what you already know.
- Define your entry levels. For each name, write down the specific technical condition that would make you want to add: a pullback to the 20-day MA, an RSI reset on the daily, a retest of prior support. Be specific before the stock gets there.
- Find the matching screen in ChartMath. Browse the 200+ curated technical screens and identify the one that best matches your entry criteria. Check its Win Rate and Average Return.
- Favorite the screen for your name. This activates monitoring. ChartMath will scan your name against that screen continuously across all 7 timeframes.
- Wait for the alert. Push and email notifications fire the moment the stock enters the setup. You don't need to check the chart. You'll be notified.
- Review the card when the alert fires. Check the Win Rate, Average Return, and sample size. Confirm the setup still aligns with your thesis. This takes two to three minutes.
- Execute in your own broker. ChartMath is a copilot, not an autopilot. It surfaces the signal; you make the decision and place the trade in whatever brokerage you use.
Setup time per name: roughly 15-20 minutes the first time. After that, ChartMath handles the monitoring. You handle the deciding.
What This Is (and What It Isn't)
This workflow is entry timing on names you already chose. It is not stock-picking, you're not using ChartMath to find new ideas. It is not day-trading, the setups you're watching are on daily and weekly timeframes, and you're building a position over weeks or months, not flipping in and out intraday.
It is a systematic way to answer the question every conviction investor faces: "I know what I want to own. When do I buy more?" The answer, with this workflow, is: when a backtested technical setup fires on your name, with a documented Win Rate and Average Return, and you've confirmed it still fits your thesis.
That's a better answer than "when it feels right." And it's one you can act on without watching charts all day.
What ChartMath Costs
ChartMath starts with a 14-day free trial — every screen, every backtest, every alert, no card to start. After the trial, founding pricing is $24.99/mo (locked for your first 12 months) or $149/yr. The app is available on iOS and Android, with a read-only web browse layer at chartmath.com/screens where you can explore the full screen library before downloading.
If you own a handful of conviction names and want a systematic way to time your entries and adds, without staring at charts or refreshing a screener, this is the workflow. Set your levels, match them to a backtested screen, and let the alerts do the watching.
Download ChartMath on iOS or Android and set up your first conviction-name alert today. Your thesis doesn't change. Your timing does.

Ankush Jindal
LinkedInSee these setups live in ChartMath
200+ curated screens with backtest data. 14-day free trial.