High Win Rate Doesn't Equal Profitable Trading
Imagine two traders. Trader A wins 7 out of every 10 trades. Trader B wins only 4 out of 10. After 100 trades, Trader A's account is down 18%. Trader B's account is up 34%. Same market. Same timeframe. Completely different outcomes.
That scenario isn't hypothetical. It plays out in retail trading accounts every single day, and it explains why obsessing over win rate is one of the most expensive mistakes a trader can make. A high win rate feels good. It confirms you're "right" more often than you're "wrong." But trading isn't a test where being right earns points. It's a math problem where the size of your wins and losses determines everything.
This post breaks down exactly why a high win rate doesn't guarantee trading profits, what the math actually looks like, and which metrics you should be tracking instead.
The Trader Who Won 7 Out of 10 Trades and Still Lost Money
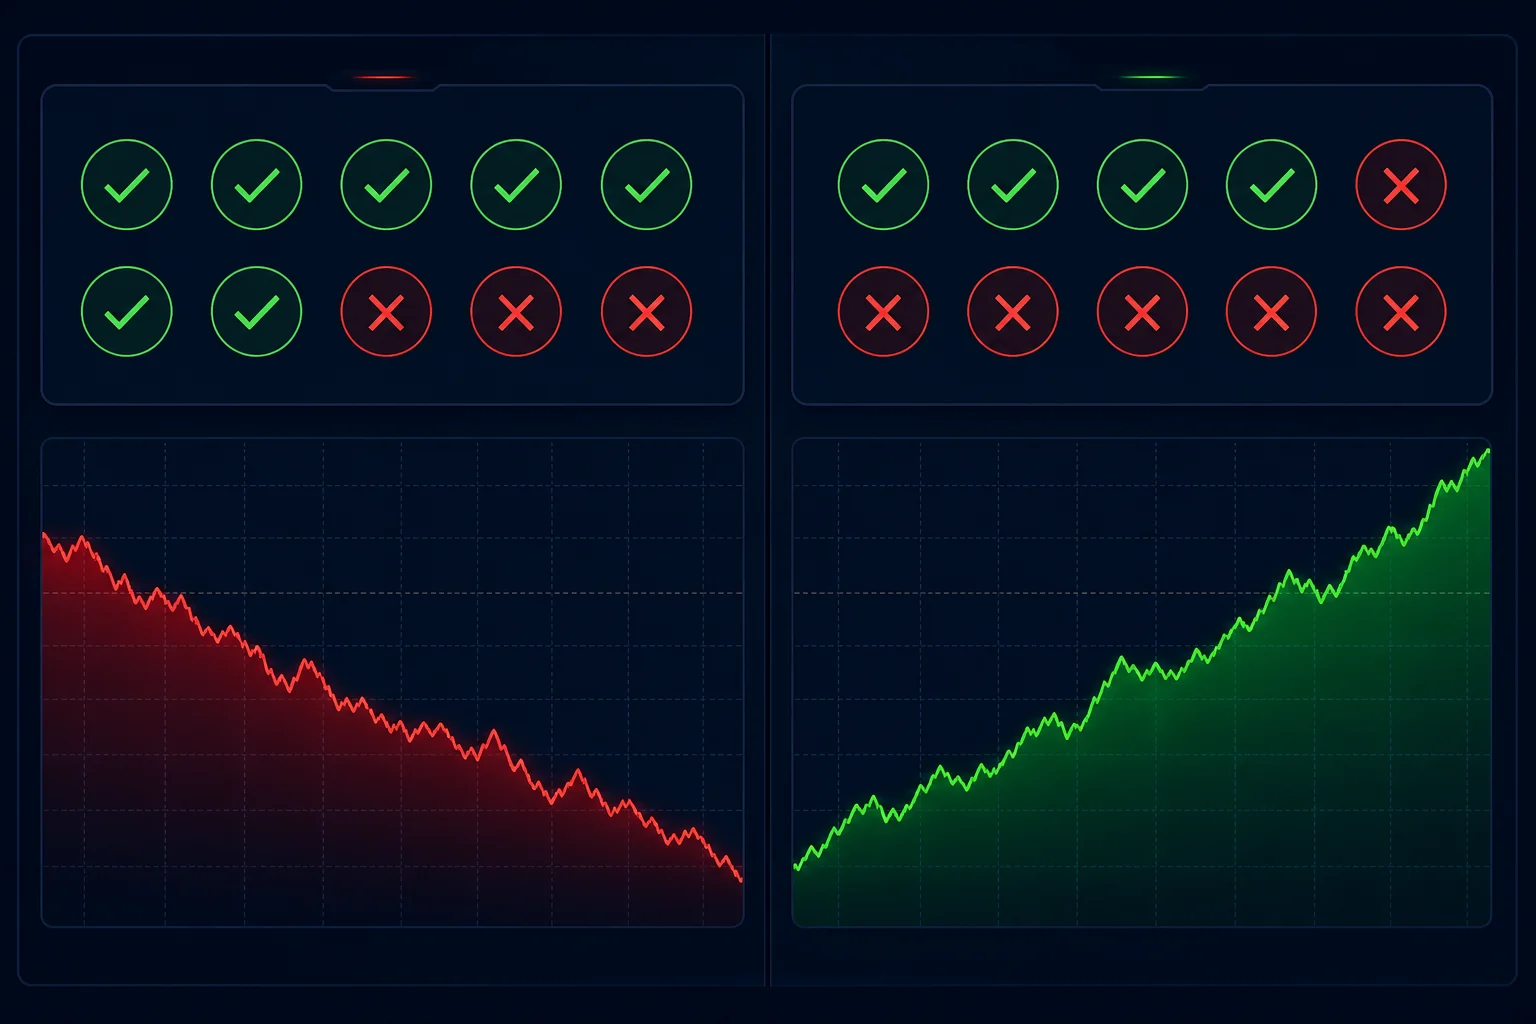
Here's the scenario in plain numbers. Trader A has a 70% win rate. Every winning trade earns $100. Every losing trade costs $300. After 100 trades, they've won 70 times ($7,000) and lost 30 times ($9,000). Net result: down $2,000.
Trader B has a 40% win rate. Every winning trade earns $400. Every losing trade costs $100. After 100 trades, they've won 40 times ($16,000) and lost 60 times ($6,000). Net result: up $10,000.
Trader A "won" more often. Trader A also lost money. The difference isn't skill or market knowledge. It's the relationship between how much they made when they were right and how much they lost when they were wrong. That relationship has a name: the payoff ratio. And it's the variable that win rate alone completely ignores.
Most trading education leads with win rate because it's the easiest number to understand and the most emotionally satisfying to optimize. But optimizing for win rate in isolation is like optimizing a business for the number of sales without tracking revenue per sale. You can be very busy and very broke at the same time.
1. What Win Rate Actually Measures (and What It Doesn't)
Win rate is simple: divide the number of profitable trades by the total number of trades, multiply by 100. A trader who closes 6 winners out of 10 trades has a 60% win rate. That's it. That's the entire calculation.
What win rate does not measure is the magnitude of those wins or losses. A trade that earns $50 counts the same as a trade that earns $5,000. A trade that loses $20 counts the same as a trade that loses $2,000. Win rate is a frequency metric. It tells you how often you're right, not how much being right is worth.
Why Frequency and Magnitude Are Both Required
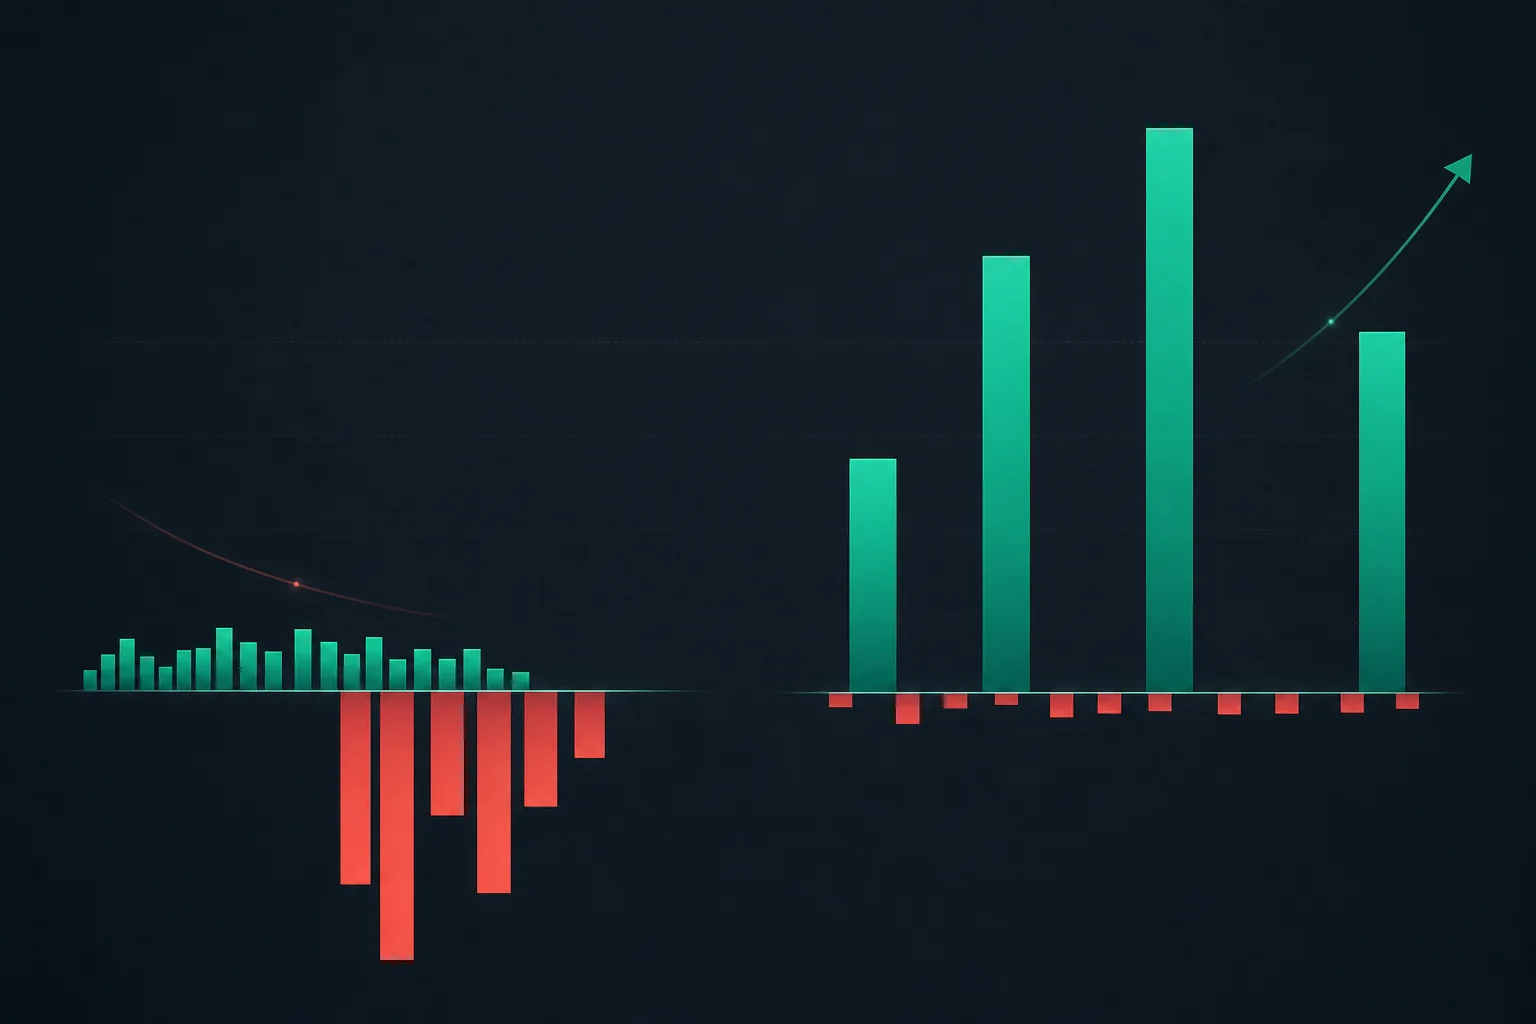
Think of it this way. A baseball player who gets on base 70% of the time but only ever hits singles will score fewer runs than a player who gets on base 40% of the time but regularly hits home runs. The first player has a higher "win rate." The second player produces more value. Trading works the same way.
A strategy that wins frequently but cuts winners short and lets losers run will produce a high win rate and a shrinking account. A strategy that wins less often but holds winners for large moves and cuts losses quickly will produce a lower win rate and a growing account. The frequency of being right is far less important than what happens when you're right versus when you're wrong.
This is why experienced traders look at win rate alongside average return, not instead of it. The two numbers together tell a story. Either one alone is incomplete.
2. The Payoff Ratio: The Number Win Rate Ignores
The payoff ratio is the average size of a winning trade divided by the average size of a losing trade. A payoff ratio of 2.0 means your average winner is twice the size of your average loser. A payoff ratio of 0.5 means your average loser is twice the size of your average winner.
When you combine win rate with payoff ratio, you get the most important number in trading: Expected Value (EV). The formula is straightforward:
EV = (Win Rate × Average Win) – (Loss Rate × Average Loss)
Positive EV means the strategy makes money over time. Negative EV means it loses money over time, regardless of how high the win rate is. Let's run the numbers on a few combinations:
- 70% win rate, 0.5 payoff ratio: EV = (0.70 × $100) – (0.30 × $200) = $70 – $60 = +$10 per trade. Barely positive.
- 70% win rate, 0.3 payoff ratio: EV = (0.70 × $100), (0.30 × $333) = $70, $100 = –$30 per trade. Negative EV despite a 70% win rate.
- 40% win rate, 3.0 payoff ratio: EV = (0.40 × $300), (0.60 × $100) = $120, $60 = +$60 per trade. Strongly positive.
The third strategy wins less than half the time and generates six times the expected value per trade of the first strategy. Win rate alone would rank it last. EV ranks it first.
This is why building a backtesting strategy requires looking at more than just how often a setup wins. The average return on those wins, relative to the average loss, is what determines whether the edge is real.
3. Sample Size: Why Your Last 10 Trades Mean Nothing
Even a strategy with strong positive EV will produce losing streaks. That's not a flaw. It's statistics. A coin that lands heads 60% of the time will still produce runs of five or six tails in a row. If you flip it ten times and get six tails, you don't conclude the coin is broken. You flip it more.
Retail traders routinely abandon strategies after 5 to 10 trades. They see three consecutive losses and conclude the setup doesn't work. Or they see four consecutive wins and conclude they've found something special. Both conclusions are statistically meaningless at that sample size.
What a Credible Sample Size Looks Like
For a swing trading setup, most statisticians and systematic traders consider 30 to 50 trades a minimum for drawing any conclusions, and 100+ trades before trusting the numbers with real conviction. The more variable the outcomes (high standard deviation in returns), the larger the sample you need.
This is one of the most underappreciated problems in retail trading. A trader tries a new setup, takes 8 trades, gets unlucky, and moves on. They never give the strategy enough room to express its actual edge. Then they try something else, repeat the cycle, and wonder why nothing works.
The fix isn't to ignore recent results. It's to contextualize them within a larger sample. If a setup has 200 historical occurrences in a backtest and shows consistent positive EV, three consecutive losses in live trading are noise, not signal. If you've only taken 8 live trades, you don't have enough data to know anything yet.
This is also why understanding the historical sample behind a setup matters before you risk capital. A screen with 12 historical occurrences tells you almost nothing. A screen with 200+ occurrences across multiple market conditions tells you something worth acting on.
4. Real-World Execution: Where Backtested Win Rates Break Down
Backtests are run on historical data under ideal conditions. Entries execute at the bar close. There's no slippage. There are no commissions. There's no spread. And critically, there's no emotion.
Live trading introduces all four of those variables simultaneously. Slippage on a fast-moving stock can turn a planned $0.10 entry into a $0.25 entry. Commissions add up across dozens of trades per month. Spreads on less liquid names erode the edge before the trade even starts. And emotion does the most damage of all.
The Execution Gap
The execution gap is the difference between what a strategy earns in a backtest and what it earns in live trading. For most retail traders, this gap is significant. The most common causes:
- Cutting winners early: A setup targets a 3R move, but the trader exits at 1R because the stock "looks extended." The win rate stays the same, but the average return collapses.
- Holding losers too long: The stop is set at $0.50, but the trader moves it down because they "believe in the trade." The loss rate stays the same, but the average loss grows.
- Skipping signals: The setup fires, but the trader doesn't take it because they're busy, uncertain, or had a bad trade earlier that day. The backtest assumes every signal is taken. Live trading rarely matches that.
- Overtrading after losses: A losing streak triggers revenge trading, which introduces low-quality setups that weren't part of the original strategy.
None of these show up in a backtest. All of them show up in a live account. This is why the gap between a strategy's theoretical win rate and its real-world profitability is almost always wider than traders expect.
For traders who want to close that gap, building a consistent trading workflow that removes discretionary decision-making from the execution process is one of the most effective steps available.
5. Position Sizing: The Multiplier That Makes or Breaks Your Edge
Two traders can use the exact same strategy, take the exact same trades, and produce completely different results. The variable that explains the difference is almost always position sizing.
A trader who risks 10% of their account on a single trade and hits a losing streak of five trades in a row is down roughly 41% before the strategy has a chance to recover. A trader who risks 1% per trade and hits the same losing streak is down about 5%. The first trader may abandon the strategy or blow up the account. The second trader is still in the game.
Why Consistent Sizing Matters More Than You Think
Inconsistent position sizing is one of the most common ways traders accidentally destroy a positive-EV system. They size up on trades they "feel good about" and size down on trades they're less confident in. The problem is that confidence and outcome have almost no correlation in systematic trading. The trade you feel best about is not statistically more likely to win than the trade you feel neutral about.
When you size up on your losers and size down on your winners (which is what emotional sizing tends to produce), you've effectively inverted the math. You're taking your largest positions on the trades that happen to lose and your smallest positions on the trades that happen to win. The strategy's positive EV gets erased by the sizing pattern.
Fixed fractional position sizing, where you risk a consistent percentage of your account on every trade, is the baseline discipline that lets a positive-EV system actually compound over time. It's not glamorous. It's not exciting. It's the foundation that everything else sits on.
6. What to Look at Instead: The Metrics That Actually Matter
If win rate alone is misleading, what should you be tracking? Here's the framework that gives you a complete picture of a strategy's edge.
Expected Value (EV)
EV is the north star. It tells you, on average, how much you expect to make or lose per trade. Positive EV means the strategy makes money over a large enough sample. Negative EV means it doesn't, regardless of how the win rate looks. Calculate it for every setup you trade seriously.
Win Rate + Average Return Together
Neither number is useful in isolation. Win rate tells you frequency. Average return tells you magnitude. Together, they give you the inputs for EV. A setup with a 55% win rate and a 2.5 average return (meaning average winner is 2.5x the average loser) is a strong setup. A setup with a 75% win rate and a 0.4 average return is a weak one.
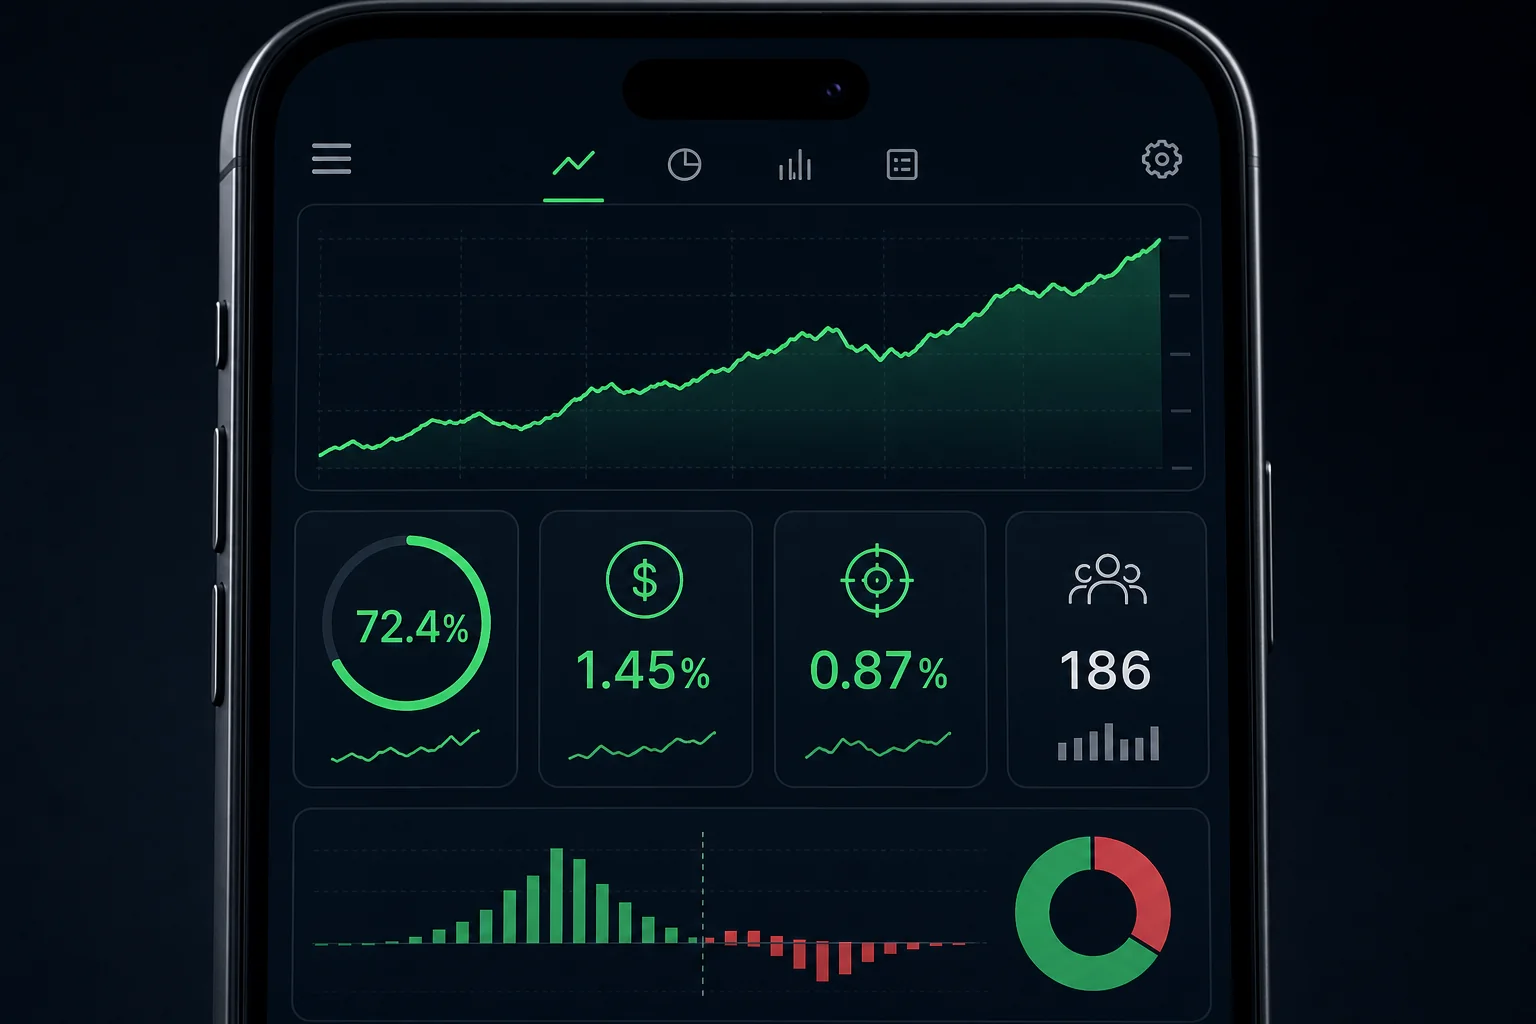
ChartMath surfaces both of these metrics on every signal card. Every screen in the app shows its historical Win Rate and Average Return, so you can evaluate the edge before you take the trade, not after. That's a meaningful difference from tools that show you a signal with no context about whether it has historically worked.
Profit Factor
Profit factor is total gross profit divided by total gross loss. A profit factor above 1.0 means the strategy is net profitable. Above 1.5 is considered solid. Above 2.0 is strong. It's a quick sanity check that captures both win rate and payoff ratio in a single number.
Drawdown Curves
A strategy's equity curve tells you where it ended up. The drawdown curve tells you what the ride looked like. A strategy that grows 40% but passes through a 35% drawdown along the way is very different from one that grows 30% with a maximum 8% drawdown. Most traders can't psychologically survive a 35% drawdown without abandoning the strategy, even if it eventually recovers. Know the drawdown profile before you commit real capital.
ChartMath's signal cards include equity and drawdown curves for each screen, so you can see not just the historical win rate and average return, but the shape of the performance over time. That context is what separates a setup you can actually hold through volatility from one that looks good on paper but falls apart in practice.
For traders who want to go deeper on how to read and use this kind of data, the guide on building winning backtesting strategies covers the full framework.
7. How to Use Backtested Data Without Being Fooled by It
Backtested data is genuinely useful. It's also genuinely dangerous if you treat it as a guarantee rather than a probability estimate. Here's how to use it correctly.
Treat Backtests as Probability Estimates, Not Predictions
A screen with a 65% historical win rate doesn't mean the next trade will win. It means that, across a large historical sample, 65% of occurrences produced a profitable outcome under the conditions the backtest modeled. The next trade is still uncertain. The edge only expresses itself over many trades.
Look for Consistency Across Conditions
A setup that shows a 70% win rate in a bull market and a 35% win rate in a sideways or bear market has a regime dependency. That's not necessarily disqualifying, but it means you need to know which market environment you're in before applying it. Setups that hold up across multiple market conditions are more robust than those that only work in one.
Understand What Backtests Don't Model
ChartMath's backtests use bar-close entries with no look-ahead bias. They do not model commissions, slippage, or spread. That's an honest limitation, and it's worth factoring in when you evaluate a screen's historical metrics. A setup with a thin average return may not survive real-world execution costs. A setup with a large average return has more room to absorb them.
This is also why the sample size matters so much. ChartMath only ships screens that have been backtested and validated. Internal AI agents propose candidate screens, and every one is backtested before it reaches the app. Only screens with a verified edge make it through. That process doesn't eliminate uncertainty, but it does filter out the noise that comes from untested setups.
Use Backtest Data to Filter, Not to Predict
The right use of backtested win rate and average return is as a filter. You're not using it to predict that the next trade will win. You're using it to decide which setups are worth your attention and which aren't. A setup with strong historical metrics and a large sample size earns a place on your watchlist. A setup with weak metrics or a tiny sample doesn't.
That filtering function is exactly what ChartMath's 200+ curated screens are designed to do. Rather than building your own screens from scratch (which requires Pine Script, coding, and a significant time investment), you get access to a library of pre-built, backtested setups across 500+ US equities, 100 crypto pairs, and 11 US futures, all with Win Rate and Average Return visible on every card. The no-code approach means you spend your time evaluating setups, not building the infrastructure to find them.
For traders who want to see how these screens work in practice, the ChartMath screens library is available as a free, read-only browse layer on the web, no sign-in required.
Frequently Asked Questions
What is a good win rate for swing trading?
There's no universal answer, because win rate only makes sense in the context of your payoff ratio. A 40% win rate with a 3.0 payoff ratio is excellent. A 70% win rate with a 0.4 payoff ratio is poor. Focus on Expected Value (EV) rather than win rate in isolation. Most consistently profitable swing traders operate somewhere between 45% and 65% win rate, paired with a payoff ratio above 1.5.
Can a 40% win rate be profitable?
Yes, absolutely. If your average winner is significantly larger than your average loser, a 40% win rate can produce strong positive EV. Many trend-following strategies operate below 50% win rate by design, because they cut losses quickly and let winners run. The math works as long as the payoff ratio compensates for the lower win frequency.
What is expected value in trading?
Expected value (EV) is the average amount you expect to make or lose per trade over a large sample. The formula is: EV = (Win Rate × Average Win), (Loss Rate × Average Loss). Positive EV means the strategy is profitable over time. Negative EV means it isn't, regardless of how the win rate looks. EV is the single most important metric for evaluating a trading strategy's long-term viability.
How many trades do I need to evaluate a strategy?
Most systematic traders consider 30 to 50 trades a minimum for drawing any conclusions, and 100+ trades before trusting the numbers with real conviction. Fewer than 30 trades is statistically too small to distinguish genuine edge from random variance. If a backtest has fewer than 30 historical occurrences, treat the metrics with significant skepticism.
Why does my live trading underperform my backtested results?
Several factors create this gap: slippage and commissions that backtests don't model, emotional execution errors (cutting winners early, holding losers too long), inconsistent position sizing, and skipping signals when you're busy or uncertain. Closing the gap requires systematic execution discipline, not just a better strategy. Tools that send real-time alerts when a setup forms help reduce the "missed signal" problem for traders who can't monitor charts all day.
Stop Optimizing for Win Rate. Start Optimizing for Edge.
Win rate is the metric that feels most intuitive and matters least in isolation. The traders who build lasting profitability aren't the ones who win the most often. They're the ones who understand the full equation: win rate, average return, sample size, execution discipline, and position sizing working together.
If you're evaluating setups without knowing their historical Win Rate and Average Return, you're trading blind. ChartMath puts both numbers on every signal card, across 200+ curated technical screens, covering 500+ US equities, 100 crypto pairs, and 11 US futures. Every screen has been backtested before it ships. Every alert comes with a plain-English explanation of why it fired. And you can put every screen, every backtest, and every alert to work with the first month for $1. After the first month, founding pricing is $24.99/mo, locked for your first 12 months, or $149.99/yr.
The next time a setup forms on a stock you've been watching, you'll know whether the historical edge supports the trade, not just whether the chart looks good. Download the ChartMath app on iOS or Android and start trading with the full picture. Or browse the screens library on the web right now, no sign-in required, to see the Win Rate and Average Return data behind every setup.

Ankush Jindal
LinkedInSee these setups live in ChartMath
200+ curated screens with backtest data. First 3 months $0.99/mo.