Screen AI & Semiconductor Stocks Systematically
NVDA gaps up 8% on an earnings beat. CNBC runs the segment. Reddit lights up. You open your brokerage app, see the move already in progress, and feel the pull to chase it. That feeling is the trade you should not take.
AI and semiconductor stocks are the most crowded, fastest-moving theme on the tape in 2026. NVDA, AMD, AVGO, MU, TSM, SMCI, ARM, MRVL — these names move hard, move fast, and attract more retail attention than almost anything else. That attention is exactly what makes them dangerous to trade on instinct. The systematic alternative is straightforward: run these names through backtested screens, check the historical Win Rate and Average Return, and let the evidence time the entry instead of the news cycle.
This guide walks through how to do that using ChartMath's 200+ curated technical screens — no Pine Script, no coding, no chart-watching required.
1. Why AI and Semiconductor Stocks Punish Chasers
High beta is a double-edged feature. The same volatility that produces 15% moves in three days also produces 12% reversals the morning after a headline. When you enter on news, you are almost always entering after the institutional move has already happened. The funds that drove the gap were positioned before the announcement. By the time the segment airs, you are buying their exit.
This is not a theory. It is a structural feature of how information flows through markets. Institutional desks have analysts, earnings models, and supply-chain data. Retail traders have Twitter and a CNBC ticker. The gap between those two information sets is where FOMO entries get punished.
The fix is not to avoid these stocks. AI and semiconductor names are genuinely among the strongest trending sectors in the market right now, and they belong in a swing trader's universe. The fix is to stop using headlines as your entry signal and start using a repeatable, backtested rule instead.
What does that look like in practice? It means waiting for a specific technical condition to form, a momentum continuation, a breakout above a base, a VWAP reclaim, a relative-volume spike, and only acting when that condition has a documented historical edge. The news tells you the story. The screen tells you when the setup is actually there.
The news tells you the story. The screen tells you when the setup is actually there.
For a deeper look at how evidence-based thinking applies to setup selection, see How to Build Winning Backtesting Strategies: A Complete Guide.
2. Which Backtested Setup Types Fit High-Beta Momentum Names
Not every screen in a 200+ library is equally suited to high-beta momentum stocks. Some screens are designed for mean-reversion plays in low-volatility names. Others are built for the kind of explosive, trend-following behavior that defines AI and semiconductor stocks. Here are the four setup categories that fit this universe best.
Momentum Continuation
A momentum continuation screen looks for stocks already in a strong uptrend that are showing signs of continuing rather than reversing. For high-beta names, this means the trend is your friend. You are not predicting a new move, you are joining one that has already proven itself. The key is that the screen's historical Win Rate and Average Return tell you whether that continuation has actually paid off historically, not just whether it looks good on a chart today.
Breakout Above a Base
Compression followed by expansion is one of the most reliable patterns in technical trading. A stock like MU or SMCI consolidates for several weeks, volume dries up, and then a catalyst or quiet accumulation pushes it through resistance. The breakout screen catches that moment. On high-beta names, the expansion phase can be violent and fast, which is exactly why you want the alert to fire at the breakout, not three days after it.
VWAP Reclaim
VWAP reclaim is an intraday setup that signals institutional re-entry. When a stock drops below VWAP and then reclaims it on volume, it often marks the point where buyers have regained control of the session. For AI and semiconductor names that gap down on macro noise and then recover, this is a high-probability entry that most retail traders miss because they are not watching the chart at 10:30 AM. An alert-based workflow solves that. For a full breakdown of how VWAP works as a trading tool, see VWAP Trading: How to Use Volume-Weighted Average Price.
Relative-Volume Spikes
Volume is the one thing that separates a real move from noise. A relative-volume (RVOL) spike screen fires when a stock is trading at a significant multiple of its average volume for that time of day. On AI and semiconductor names, RVOL spikes often precede or confirm the kind of directional moves worth trading. Without volume confirmation, a breakout in NVDA or AMD is just a price event, it could reverse just as fast. With elevated RVOL, the probability of follow-through improves meaningfully.
For more on how volume analysis works in practice, see Volume Analysis for Day Traders: How to Use RVOL and Volume Spikes.
3. How to Build Your AI and Semiconductor Watchlist
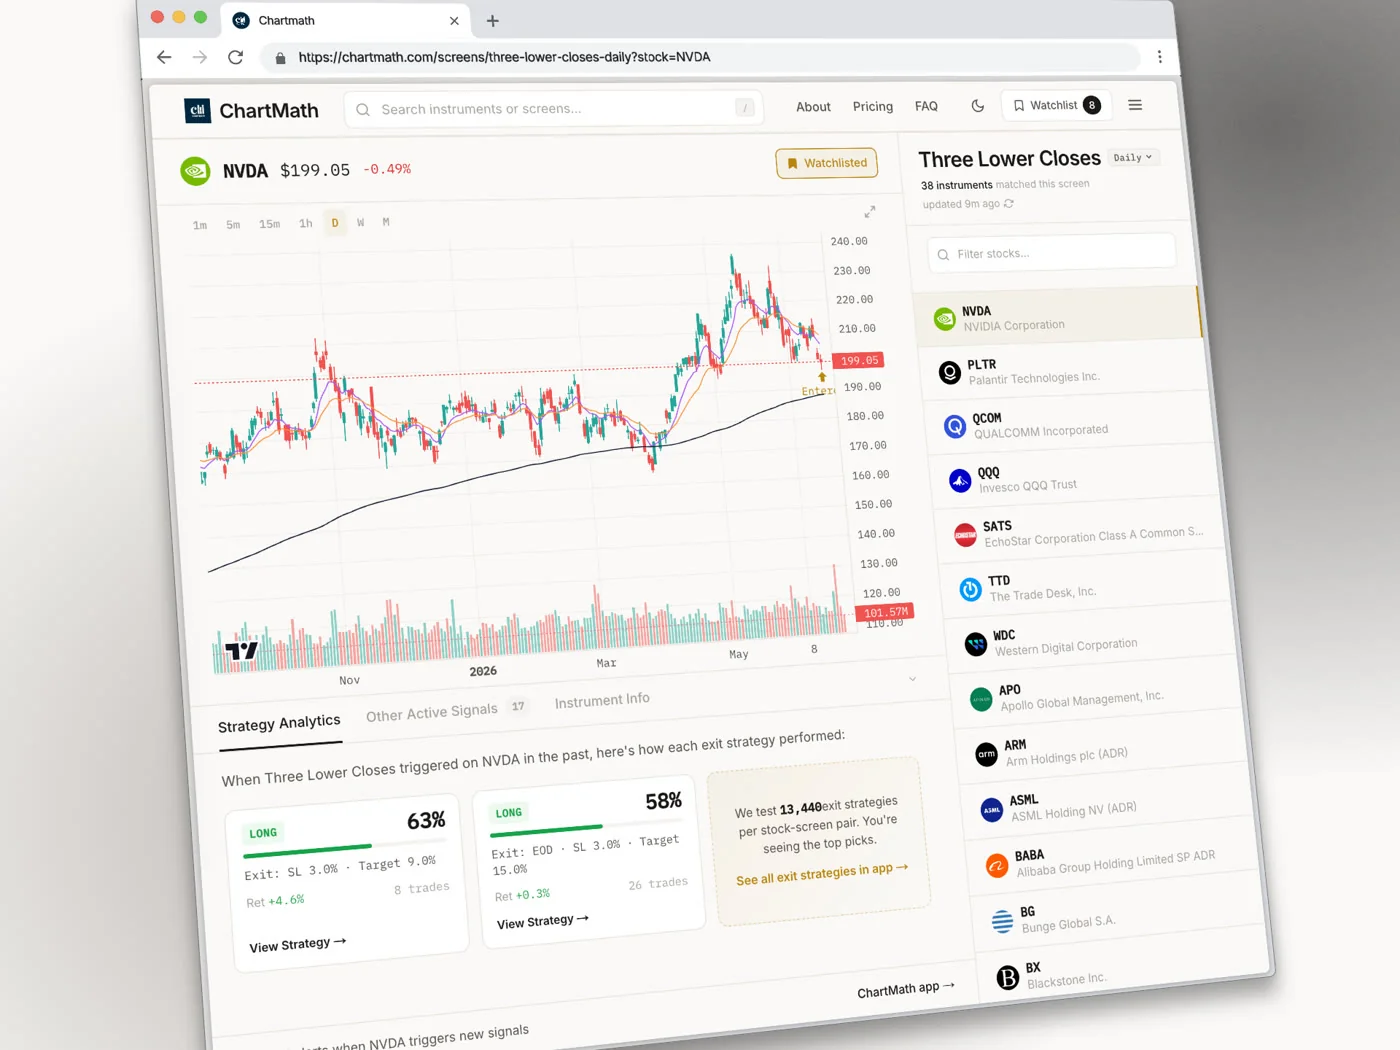
ChartMath's universe covers 500+ US equities, and the core AI and semiconductor names, NVDA, AMD, AVGO, MU, TSM, SMCI, ARM, MRVL, are all in it. Building a focused watchlist of these leaders is the first step in the systematic workflow.
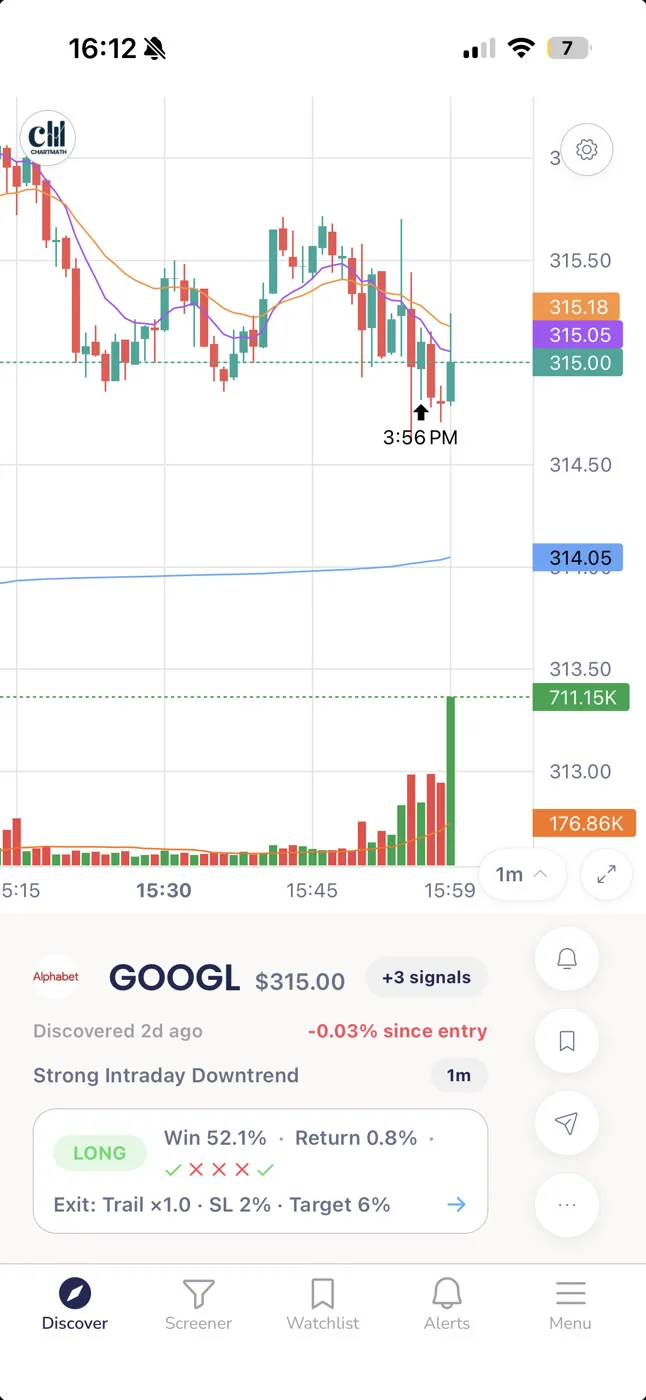
Here is how to set it up:
- Open the Search tab in the ChartMath app (iOS or Android). This is where the single watchlist lives.
- Search each ticker by symbol, NVDA, AMD, AVGO, MU, TSM, SMCI, ARM, MRVL, and add each one to your watchlist.
- Keep the list focused. The goal is leaders, not laggards. A watchlist of 8 to 12 high-conviction AI and semiconductor names is more useful than 40 tickers you will never act on.
Once a ticker is on your watchlist, ChartMath runs it against all 200+ curated screens continuously. You do not need to check each name manually. The app does the scanning; you review what fires.
One watchlist, server-synced on mobile. That is the structure. There are no named or multiple watchlists, just one focused list that you keep current as the sector leadership shifts.
4. Setting Up Screen-Enter Alerts So You Act on the Rule, Not the Hype
The watchlist gets you coverage. The alerts get you timing. Here is how to connect the two.
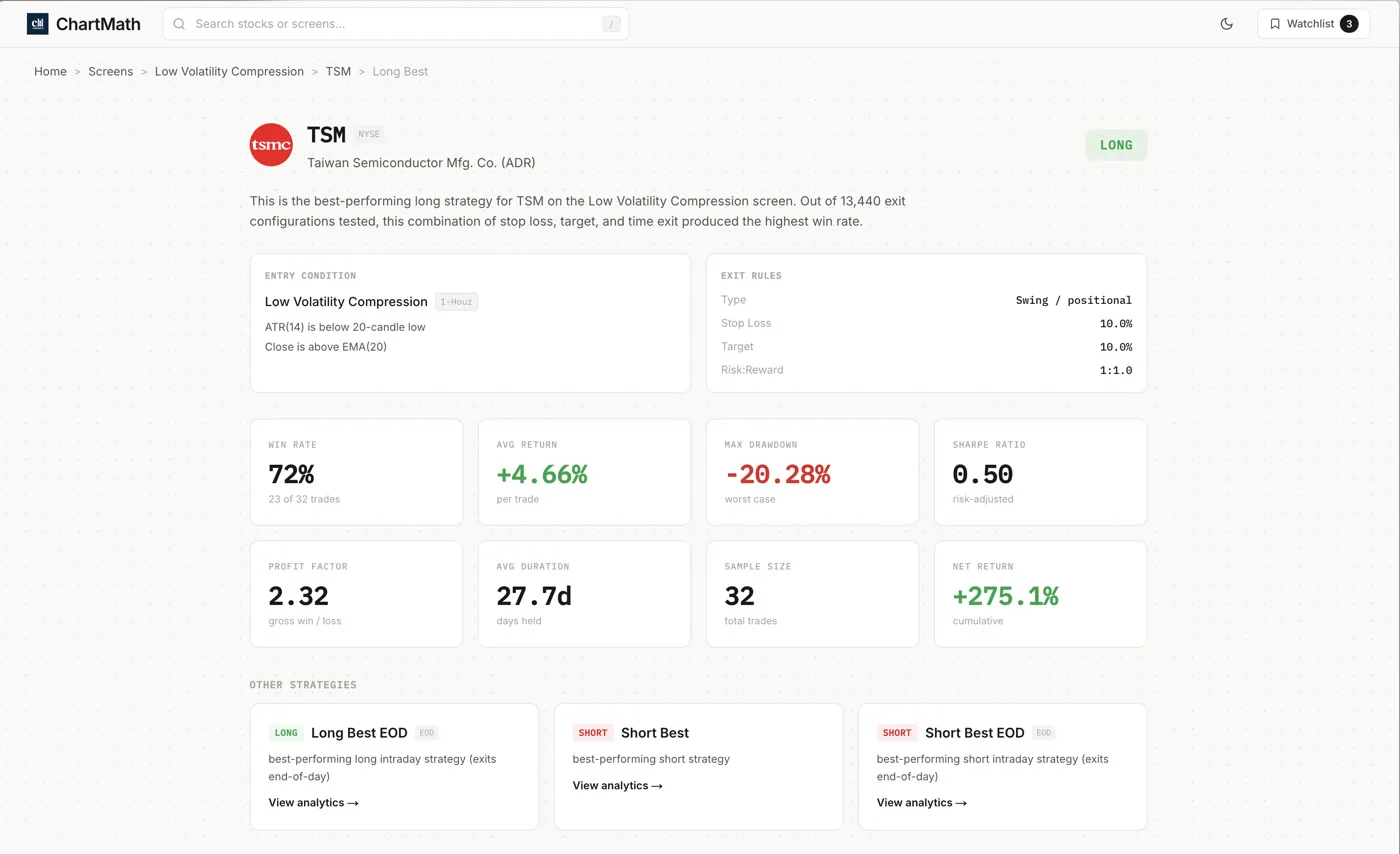
Favorite the Relevant Screens
In the Screener tab, browse the 200+ curated screens and favorite the ones that match the setup types above: momentum continuation, breakout above a base, VWAP reclaim, and relative-volume spike screens. Favoriting a screen opts you into screen-enter alerts for that screen.
How Screen-Enter Alerts Work
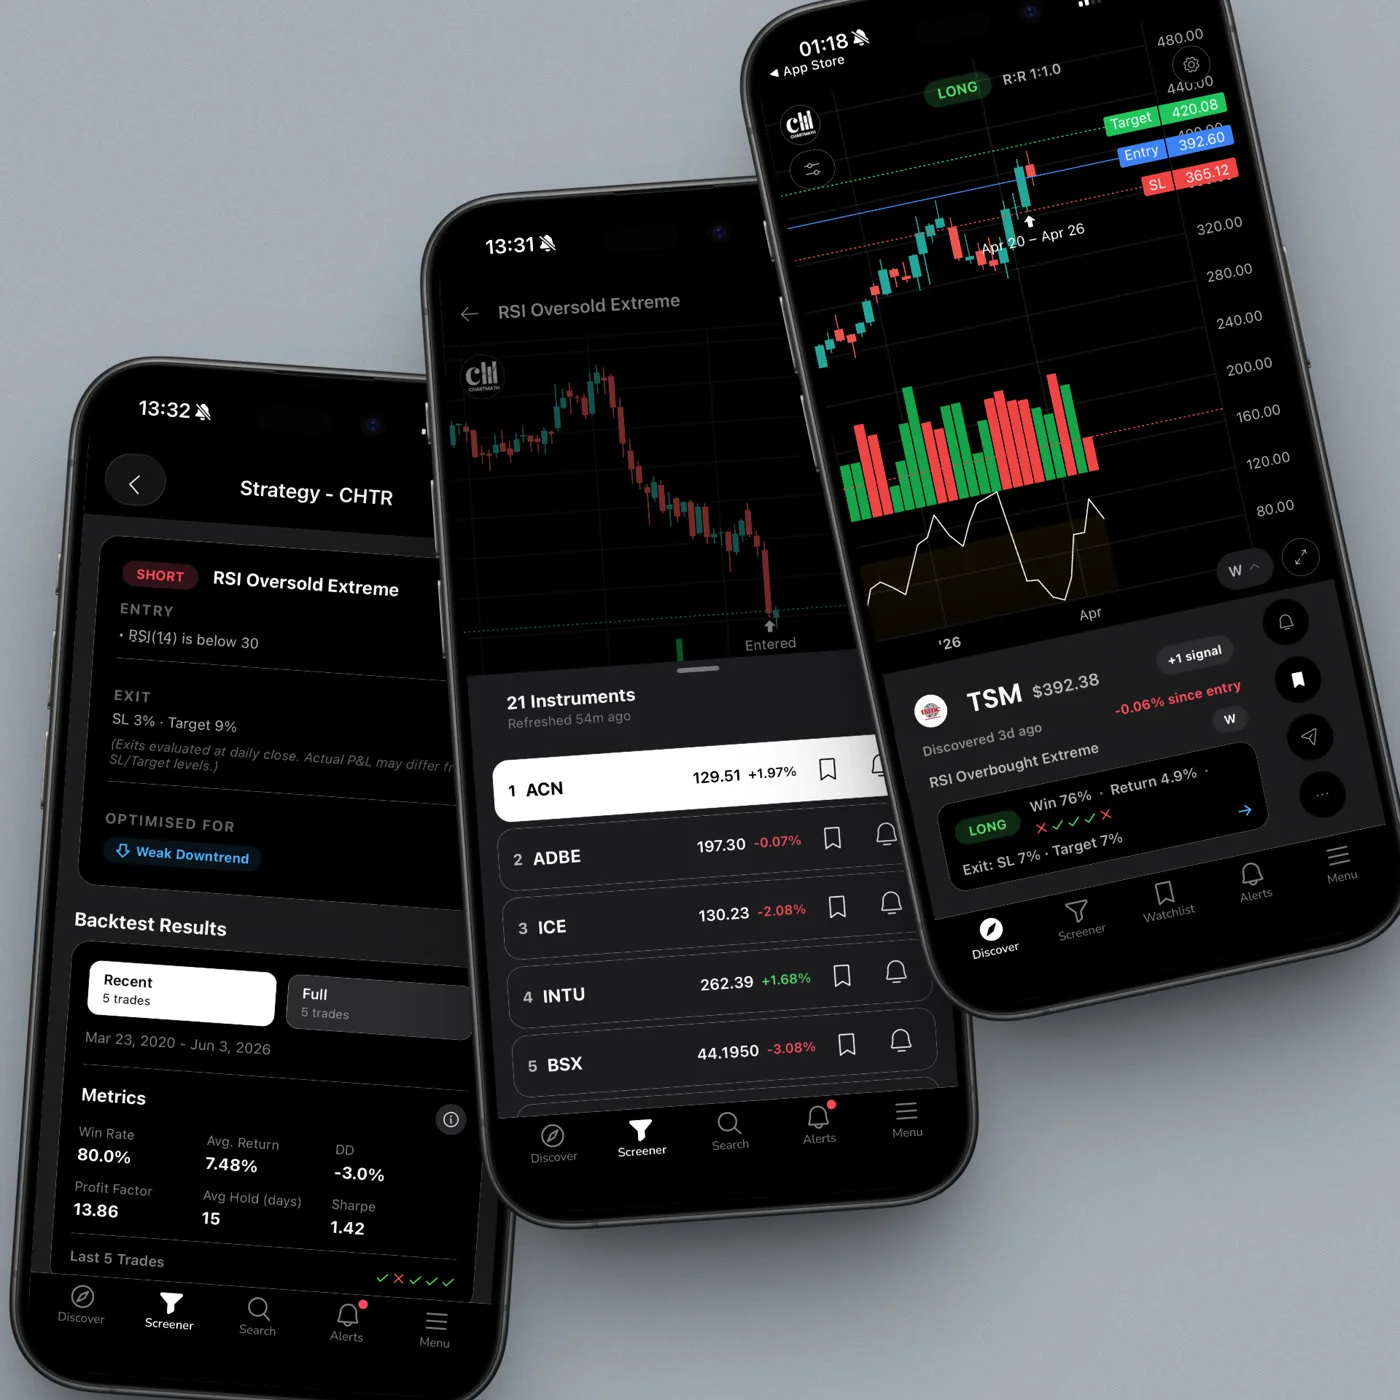
When a ticker from your watchlist enters a screen you have favorited, ChartMath sends a push notification and an in-app alert. The alert payload includes the ticker symbol, the timeframe, the screen name, the screen's rule description, and the historical Win Rate and Expected Value (EV) for that screen. You get the signal and the evidence in one place.
What the alert does not do: it does not place a trade, it does not connect to your broker, and it does not make the decision for you. ChartMath is a copilot, not an autopilot. The alert tells you a rule-based condition has formed on a name you care about. You decide whether to act.
Notification Hygiene
AI and semiconductor names are active. Without de-duplication and throttling, you would get buried in alerts. ChartMath handles this with built-in notification hygiene: de-duplication, per-bar caps, and timezone-aware quiet hours. The result is signal, not noise. You get alerted when something meaningful fires, not every time a stock twitches.
Alerts go out via push and in-app only. There is no SMS and no email alert channel for screen-enter notifications.
For a broader look at how to build a workflow around alerts without getting overwhelmed, see How to Trade Stocks Without Watching Screen All Day.
5. Risk First: Stop and Position Size Before You Enter
AI and semiconductor stocks can gap 5% to 10% on earnings, macro data, or a single analyst note. That volatility is what makes them attractive. It is also what makes position sizing non-negotiable.
The rule is simple: define your stop before you define your size. The stop is not a number you pick after you decide how many shares to buy. The stop is the level at which the setup is invalidated, below the breakout level, below VWAP, below the base. Once you have the stop, you calculate the per-share risk (entry price minus stop price), then divide your maximum dollar risk for the trade by that per-share risk to get your share count.
On a high-beta name like SMCI or ARM, a stop that is 3% below entry is not unusual. That means a smaller position size than you might use on a lower-volatility name. That is correct. The volatility of the name should shrink the position, not expand it.
ChartMath surfaces the setup and shows the historical Win Rate and Average Return. It does not size the position for you. That is your job, and it is the most important decision in the trade. For a full framework on this, see Swing Trading with a Full-Time Job: A Real System.
6. The Systematic Workflow: From Screen to Decision
Put it all together and the workflow looks like this:
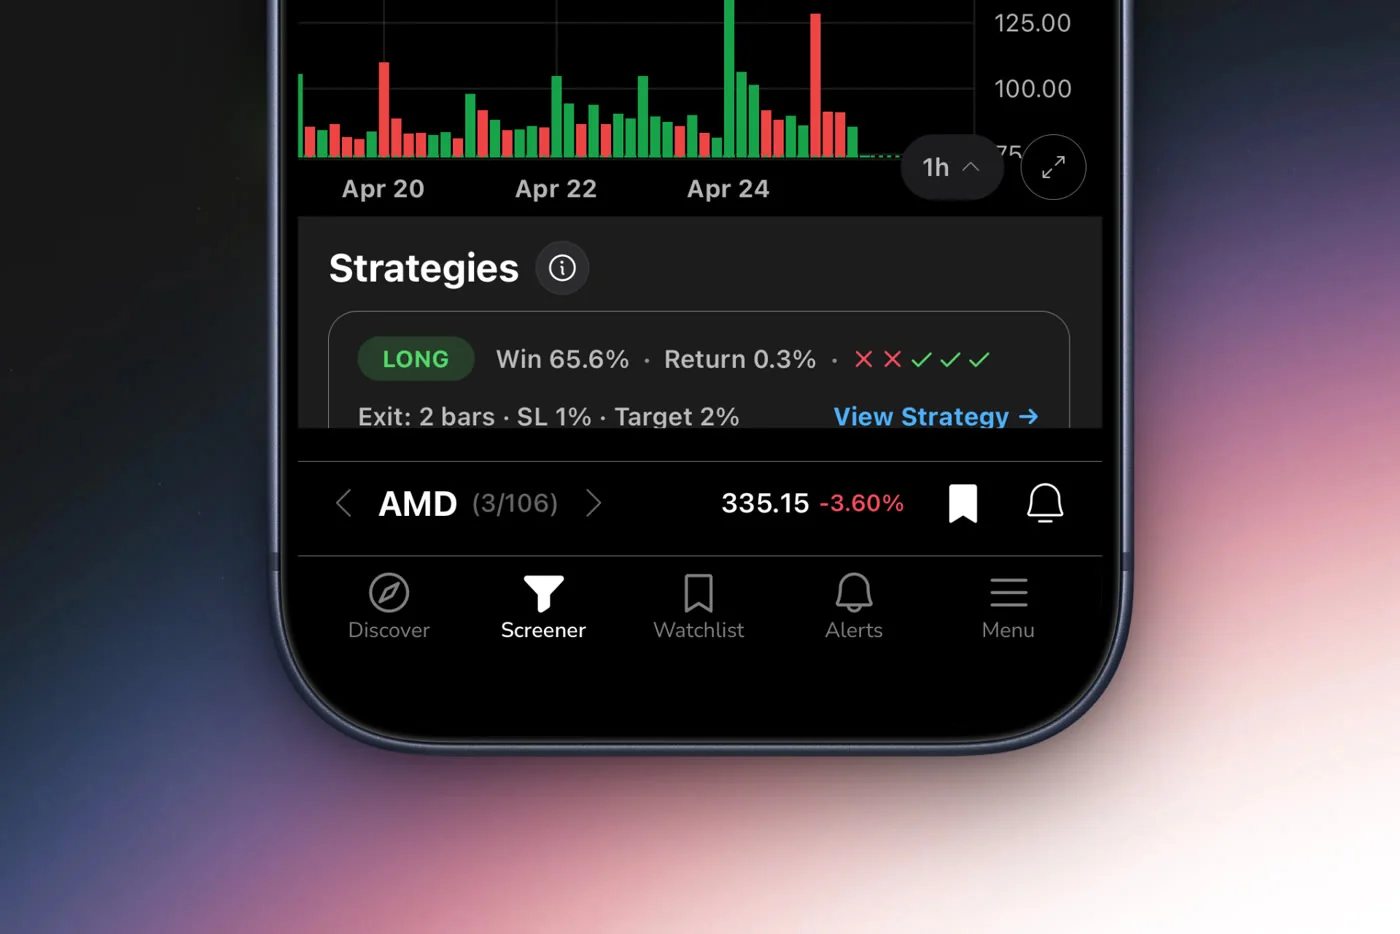
- Build the watchlist. Add your AI and semiconductor leaders (NVDA, AMD, AVGO, MU, TSM, SMCI, ARM, MRVL) to ChartMath's watchlist via the Search tab. Keep it to the names you would actually trade.
- Favorite the relevant screens. In the Screener tab, favorite the momentum continuation, breakout, VWAP reclaim, and RVOL screens. These are the setup types with the best historical fit for high-beta momentum names.
- Let the alerts come to you. You do not need to watch charts. When a watchlist ticker enters a favorited screen, you get a push notification with the ticker, timeframe, screen name, and historical Win Rate and EV. You are at work. The app is scanning.
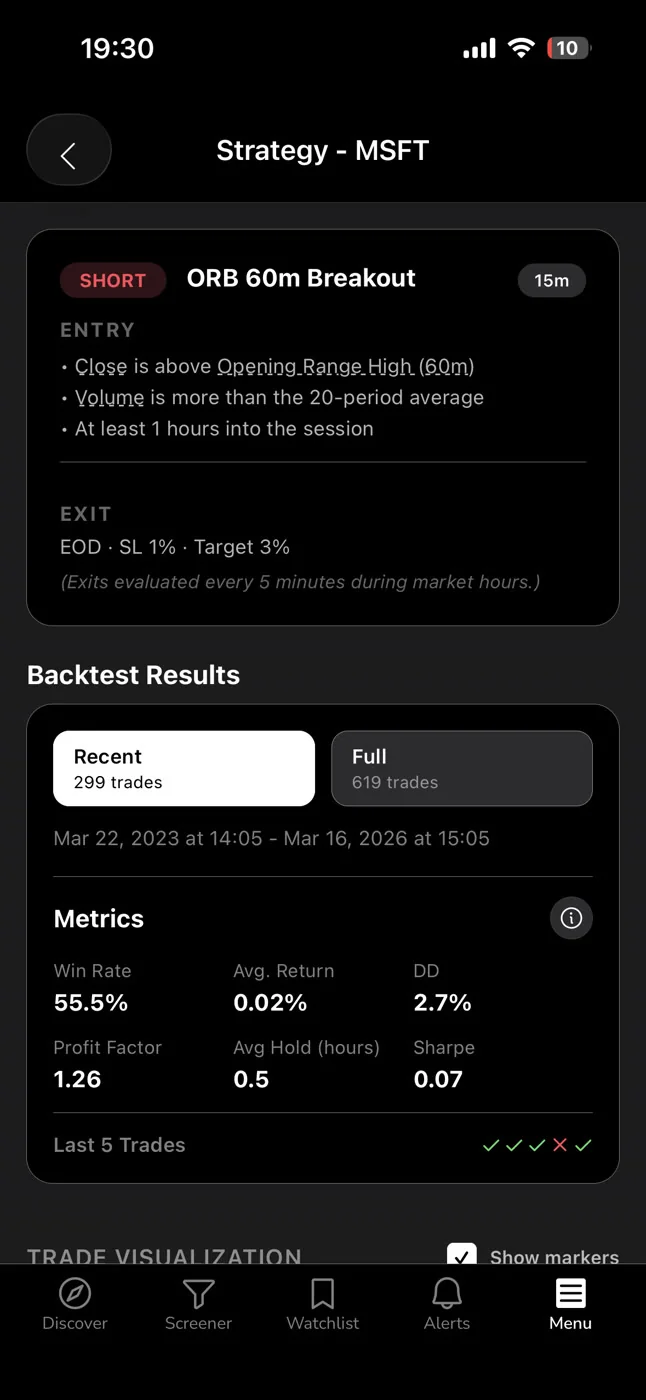
- Review the screen detail. Open the alert, check the Win Rate and Average Return for that screen, and pull up the chart in your own charting platform to confirm the setup visually. ChartMath shows you the screen's rule and historical stats. You verify the chart.
- Set stop and size, then execute. Define your stop level, calculate your position size based on your maximum risk per trade, and execute in your own brokerage. ChartMath does not place orders and has no broker connection. You keep the call.
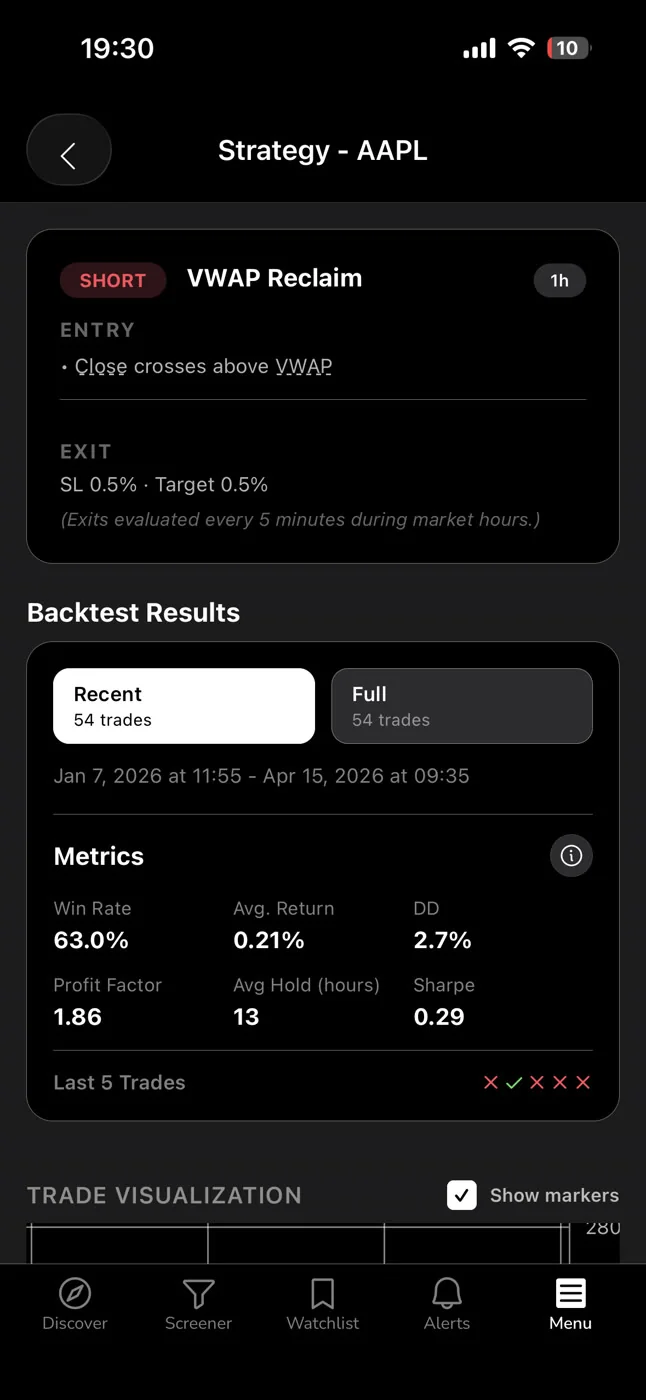
This is the copilot model. ChartMath does the scanning across 500+ US equities and 200+ screens. You do the deciding. The discipline advantage is real: you are acting on a rule that fired, not on a tweet that went viral.
For a complete look at how to structure your trading day around this kind of workflow, see How to Build an Efficient Trading Workflow in 2026.
What the Discover Feed Adds
Beyond the watchlist-plus-alerts workflow, ChartMath's Discover tab surfaces a swipe-based feed of setup cards across the full 500+ US equity universe. If a name you have not been tracking, say, MRVL or a smaller semiconductor name, fires a high-quality setup, it can surface in Discover. Each card shows the screen name, timeframe, and historical Win Rate and Average Return. It is a way to catch setups you did not know to look for, without adding noise to your core watchlist.
You can browse the full screen library at chartmath.com/screens to see which screens are available before you download the app.
7. Frequently Asked Questions
Are NVDA, AMD, TSM, and other AI and semiconductor names actually in ChartMath's universe?
Yes. ChartMath's universe covers 500+ US equities, and the major AI and semiconductor names, including NVDA, AMD, AVGO, MU, TSM, SMCI, ARM, and MRVL, are all within it. The universe is curated and US-first (NYSE and Nasdaq), not the entire market. It also includes 100 crypto pairs and 11 US futures for traders who want that coverage.
What screens work best for high-beta momentum stocks?
Momentum continuation, breakout above a base, VWAP reclaim, and relative-volume spike screens tend to fit the volatility profile of AI and semiconductor names best. These are trend-following and confirmation-based setups rather than mean-reversion plays. ChartMath's 200+ curated screens include all of these categories, and each screen shows its historical Win Rate and Average Return so you can evaluate the edge before you act.
Does ChartMath explain why a specific ticker fired?
The alert and screen detail show the screen's rule description, the timeframe, and the historical Win Rate and Expected Value for that screen. What it does not generate is a per-signal, AI-written plain-English explanation of why that specific ticker fired at that specific moment. The screen's rule is the explanation: the ticker met the conditions defined by the screen. That is the signal.
How do I avoid getting shaken out by normal volatility in these names?
Set your stop at a technically meaningful level before you enter, not at an arbitrary percentage. For high-beta names, that often means a wider stop and a smaller position size. The goal is to stay in the trade through normal noise while exiting if the setup is genuinely invalidated. Position sizing is what keeps a normal pullback from becoming a forced exit.
Is ChartMath free to use for this workflow?
Yes. ChartMath is free. No credit card required. The first month gives you every screen, every backtest, and every alert so you can run this exact workflow before you decide.
Start Screening AI and Semiconductor Stocks on Evidence, Not Headlines
The AI and semiconductor trade is real. The names are in the market's strongest sector, and they will keep moving. The question is whether you enter on a backtested rule or on a CNBC segment. One of those has a documented historical edge. The other has a documented history of punishing retail traders who arrive late.
The workflow above takes about 15 minutes to set up. Add the tickers, favorite the screens, let the alerts come to you. When one fires, check the Win Rate and Average Return, verify the chart, set your stop, and execute in your own broker. That is systematic trading applied to the most crowded theme on the tape.
Browse the full screen library at chartmath.com/screens to see which setups are available for AI and semiconductor names. When you are ready to set up alerts, download the ChartMath app on iOS or Android. Start for free.

See these setups live in ChartMath
200+ curated screens with backtest data. Free. No credit card required.