20-Day High Breakout: Real Signal or False Hope
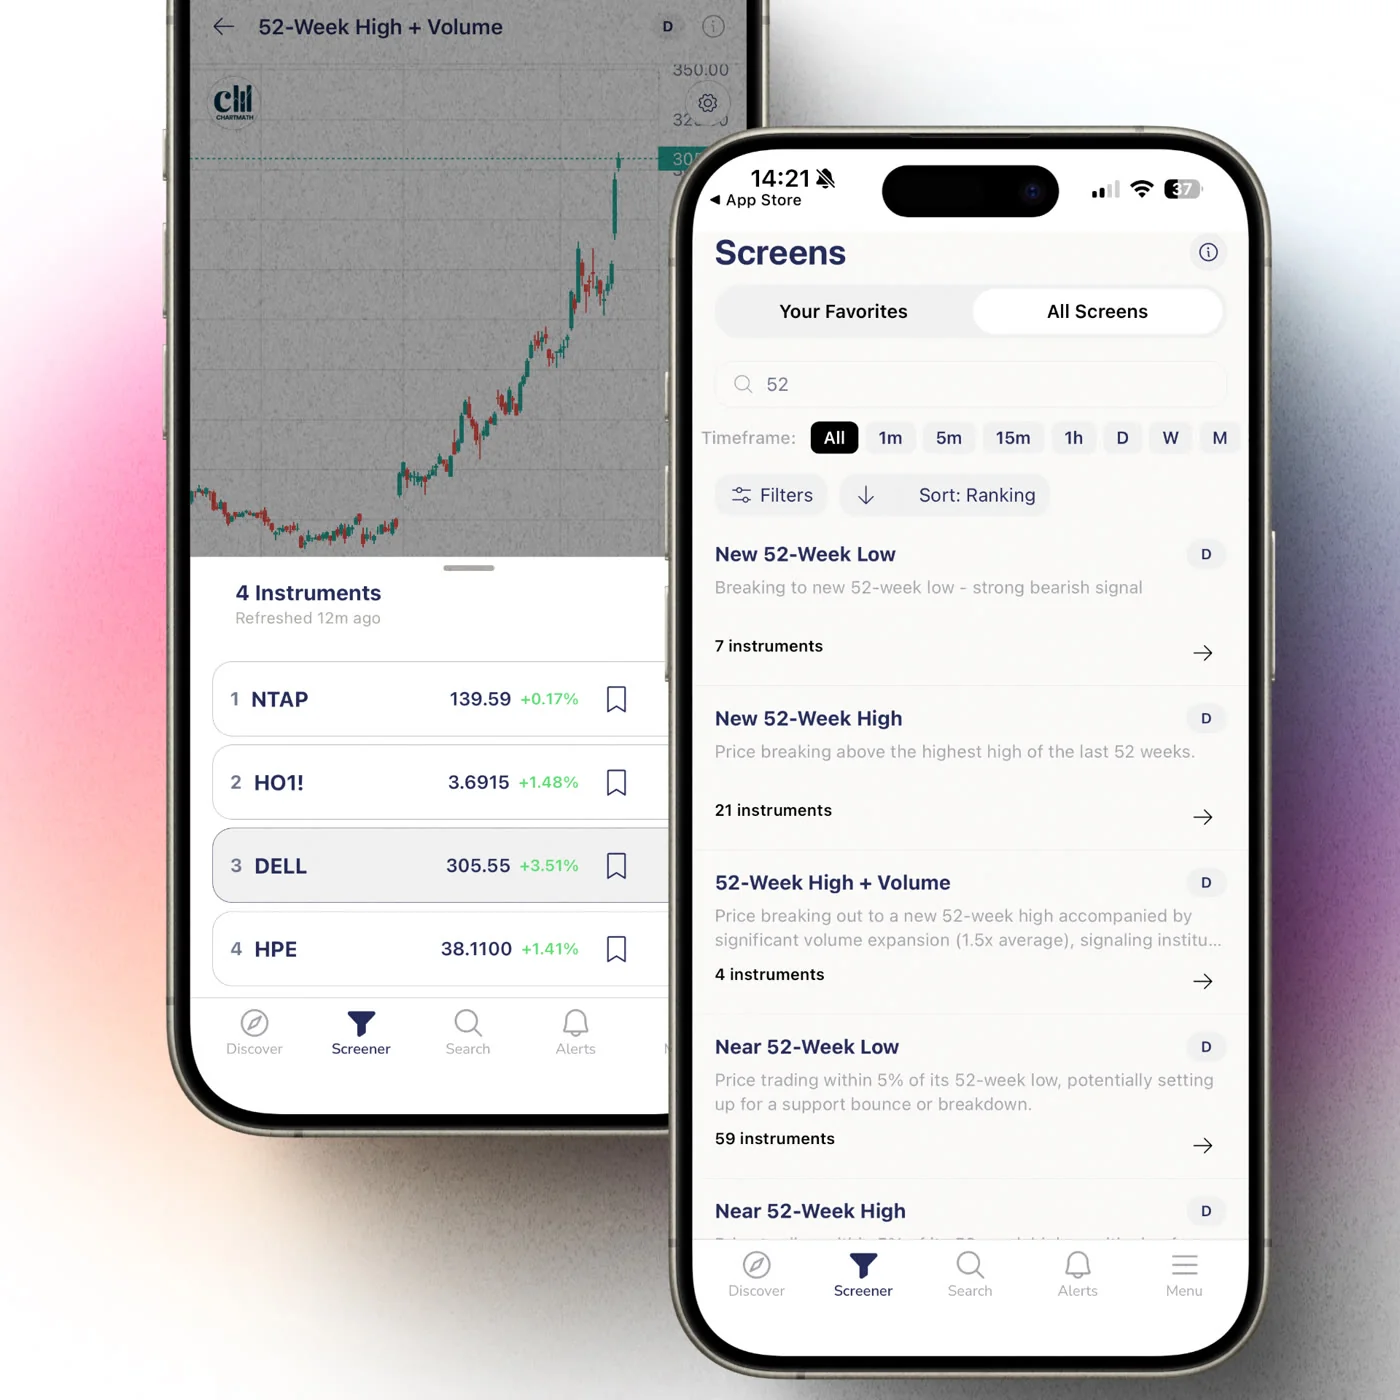
A stock making a new 20 day high has simply closed above every close from the last month. That is the whole definition. On its own, this 20 day high breakout signal wins close to half the time in most backtests, which means the raw trigger is barely better than a coin flip. What separates a real breakout from a trap is the base it broke out of, the volume behind the move, and where you'd actually place a stop.
Key Takeaways
- The base beats the break: a 20 day high out of a tight, multi-week consolidation behaves differently than the same high out of a wide, choppy range, even though a plain scanner logs both as identical hits.
- Volume has to expand, not drift: a breakout day printing below its 20-day average volume is far more likely to fail back into the range than one printing well above it.
- Set the stop before you size the trade: the stop belongs below the base low, not at an arbitrary percentage, and that distance is what should decide your share count.
- Horizon changes the population: a 20 day high, a 52-week high, and an all-time high are pulling from different groups of stocks with different overhead supply and different follow-through rates.
- Three trades is not a sample: judging this setup on your last few breakouts is how traders talk themselves into or out of a rule that actually has a stable edge, or none at all, over dozens of trades.
At a Glance: 20-Day High Breakout Cheat Sheet
| Signal | Trigger frequency | Overhead supply | What confirms it |
|---|---|---|---|
| 20-day high | Common, fires often across a broad universe | Some sellers from the last month still trapped nearby | Tight base + volume expansion + defined structural stop |
| 52-week high | Less frequent, filters out short-term noise | Lower; a full year of buyers is already in profit | Same filters, but base tends to be more reliable on its own |
| All-time high | Rare | None; no seller has ever lost money holding through this level | Volume still matters, but overhead resistance is a non-issue |
| Wide, sloppy base | N/A (a base type, not a signal) | High; price has spent weeks fighting through supply | Avoid trading the breakout without extra confirmation |
| Tight, orderly base | N/A (a base type, not a signal) | Low; sellers have mostly cleared out | Preferred setup, especially paired with volume expansion |
What a 20-Day High Actually Measures
A 20 day high just means today's close (or intraday price, depending on how you define it) sits above every close in the trailing 20 trading days, roughly a calendar month. That is a trimmed-down version of the classic Donchian channel breakout, the same logic behind the original turtle trading system, scaled from its longer lookback windows down to a horizon that fits swing trading rather than trend-following on daily bars held for months.
The signal tells you one specific thing: the supply overhang from the last month is gone. Every seller who bought in the past 20 sessions and wanted out at breakeven or better has now had their chance. That is useful information. It is not, by itself, a forecast that price keeps climbing. A stock can clear its 20 day high and stall immediately if the move happened for the wrong reasons, on the wrong kind of base.
Why the Naive Version Is Close to a Coin Flip
Here is the problem with screening for "new 20 day high" and nothing else. A plain scanner logs a thinly traded stock grinding out of a wide, three-month sideways chop the exact same way it logs a stock coiling for two weeks in a tight range before popping on heavy volume. Both show up as identical rows on your watchlist. Both say "new 20 day high" in the alert.
They are not the same trade. That is why raw breakout hit rates in most backtests sit close to 50%, sometimes worse once you account for slippage and a realistic exit. The fix is not to abandon the signal. It is to stop treating every 20 day high as interchangeable and start asking what happened underneath it.
1. The Base Matters More Than the Break
Before you look at the breakout candle, look at the three to six weeks before it. A tight base, where price has been coiling in a narrow range with shrinking daily ranges, tells you sellers have mostly exhausted themselves. Buyers and sellers have been fighting over a small price band long enough that whoever wanted to sell already has.
A wide, sloppy base, where price has been swinging violently for weeks with no clear floor, tells you the opposite. There is likely still a pile of trapped buyers higher up who bought during a spike and are sitting on losses, waiting to sell into any strength. A breakout out of that kind of base runs into that overhead supply almost immediately.
A rough way to measure this without any coding: compare the width of the base (highest high minus lowest low over the prior 15-20 sessions) to the stock's average true range. A base that is only two or three ATRs wide is tight. A base spanning eight or ten ATRs is not a base, it is a wide range that happens to be flat on a weekly chart.
2. Volume Confirmation: What Expansion Actually Tells You
Volume on the breakout day is the second filter, and it is not optional. Compare the breakout session's volume to the stock's 20-day or 50-day average. A breakout that prints on volume below its own average is drifting into new-high territory without new participants showing up to defend it. That kind of move fails back into the range far more often than it holds.
Volume that expands to 1.5x, 2x, or more above average tells a different story. New money is entering at the moment the stock clears resistance, which is exactly the kind of participation that can carry price through the first wave of profit-taking. This is not a guarantee, but it is the difference between a breakout that has fuel behind it and one that is running on fumes.
If you have read up on how automated scanners identify high-probability setups, you have likely seen volume treated as a standalone filter. For a 20 day high specifically, it works best layered on top of the base-quality check above, not instead of it.
3. Where the Stop Belongs (and How It Sets Size Before Entry)
A stop that is just "2% below entry" or "5% below entry" ignores the chart entirely. The stop belongs below the low of the base that produced the breakout. If the coiling range's floor sits three points below your entry, that is your stop distance, not a round percentage pulled out of the air.
This matters because the stop distance is what should decide your position size, not the other way around. Once you know your dollar risk per trade and the distance from entry to the structural stop below the base, share count falls out of that math automatically. Risk gets set before you click buy, not adjusted after the trade already feels uncomfortable.
If the base is wide and the structural stop ends up far away, that alone is a signal the setup costs more risk than it is worth for the position size you can actually take. A tight base with a nearby stop, paired with a volume-confirmed break, lets you size up with the same dollar risk. This is one reason the base-quality filter and the stop placement are really the same decision viewed from two angles.
4. 20-Day High vs 52-Week High vs All-Time High
These three triggers pull from different populations of stocks and behave differently once triggered. A 20 day high fires often, across a broad universe, because a month is a short window and plenty of stocks will clear it just from normal volatility. Some of that overhang from the past month is still nearby, so the breakout has to work a little to clear it.
A 52-week high is rarer. To clear a full year of closes, a stock generally needs a real catalyst or a sustained uptrend behind it, and most of the buyers from the past year who wanted to sell at breakeven have long since had their chance. That structural difference is part of why 52-week high breakouts tend to show steadier follow-through in backtests than the noisier 20-day version, though neither is automatic.
An all-time high removes the overhead supply question entirely. Nobody who has ever bought the stock is sitting on a loss at that price. The setup still needs a base and volume confirmation, but it is not fighting a ceiling of trapped sellers the way a 20-day or even a 52-week breakout can be.
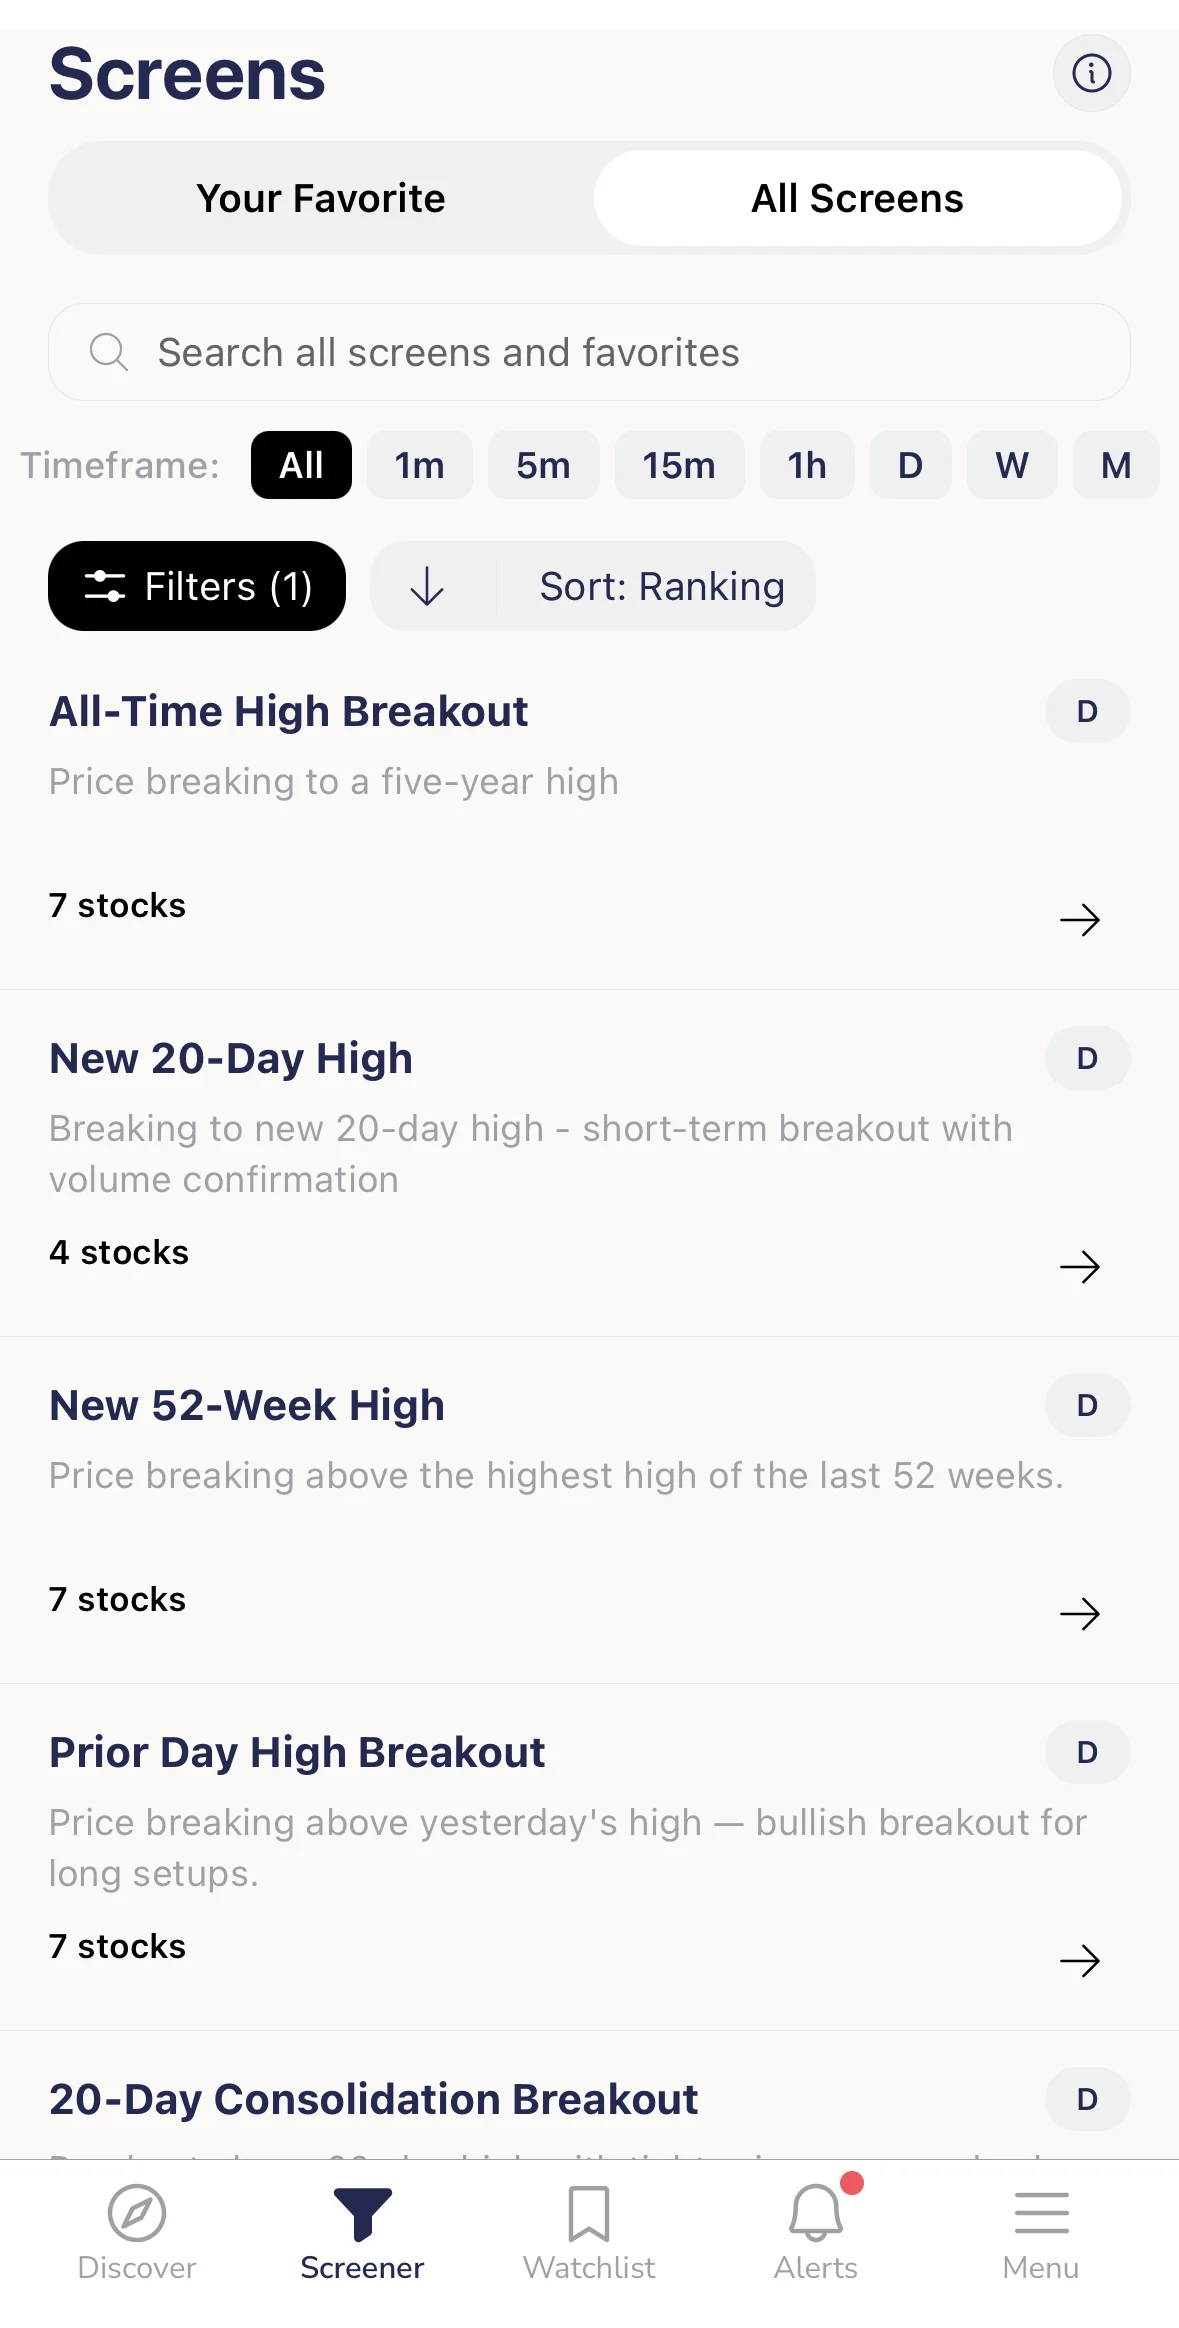
Stacking a longer-horizon filter on top of the 20-day trigger, only take the 20-day high if it also sits within a few percent of the 52-week high, changes what you catch. You give up some early entries but filter out a large share of the sloppy, low-quality breaks that a 20-day-only screen lets through. That trade-off between catching the move early and catching a cleaner move is a decision every breakout trader eventually has to make deliberately, and the cleanest way to make it is to read the records side by side: the new 20-day high screen (daily) against the all-time high breakout screen (daily), each carrying its own rule and its own backtested history.
5. The Trap of Judging the Rule on Your Last Three Trades
Say you took three 20 day high breakouts this month. Two worked, one didn't. That feels like a 67% win rate, and it feels like enough evidence to size up on the next one. It isn't. Three trades tell you almost nothing about whether a rule has a durable edge, because market conditions, sector rotation, and plain luck all swing wildly over a handful of trades.
The traders who get burned worst by breakout setups are usually the ones who either abandon a legitimately good rule after two losses in a row, or double down on a rule that got lucky over a short stretch. Both mistakes come from the same root cause: judging a systematic setup on an anecdotal sample instead of a documented one.
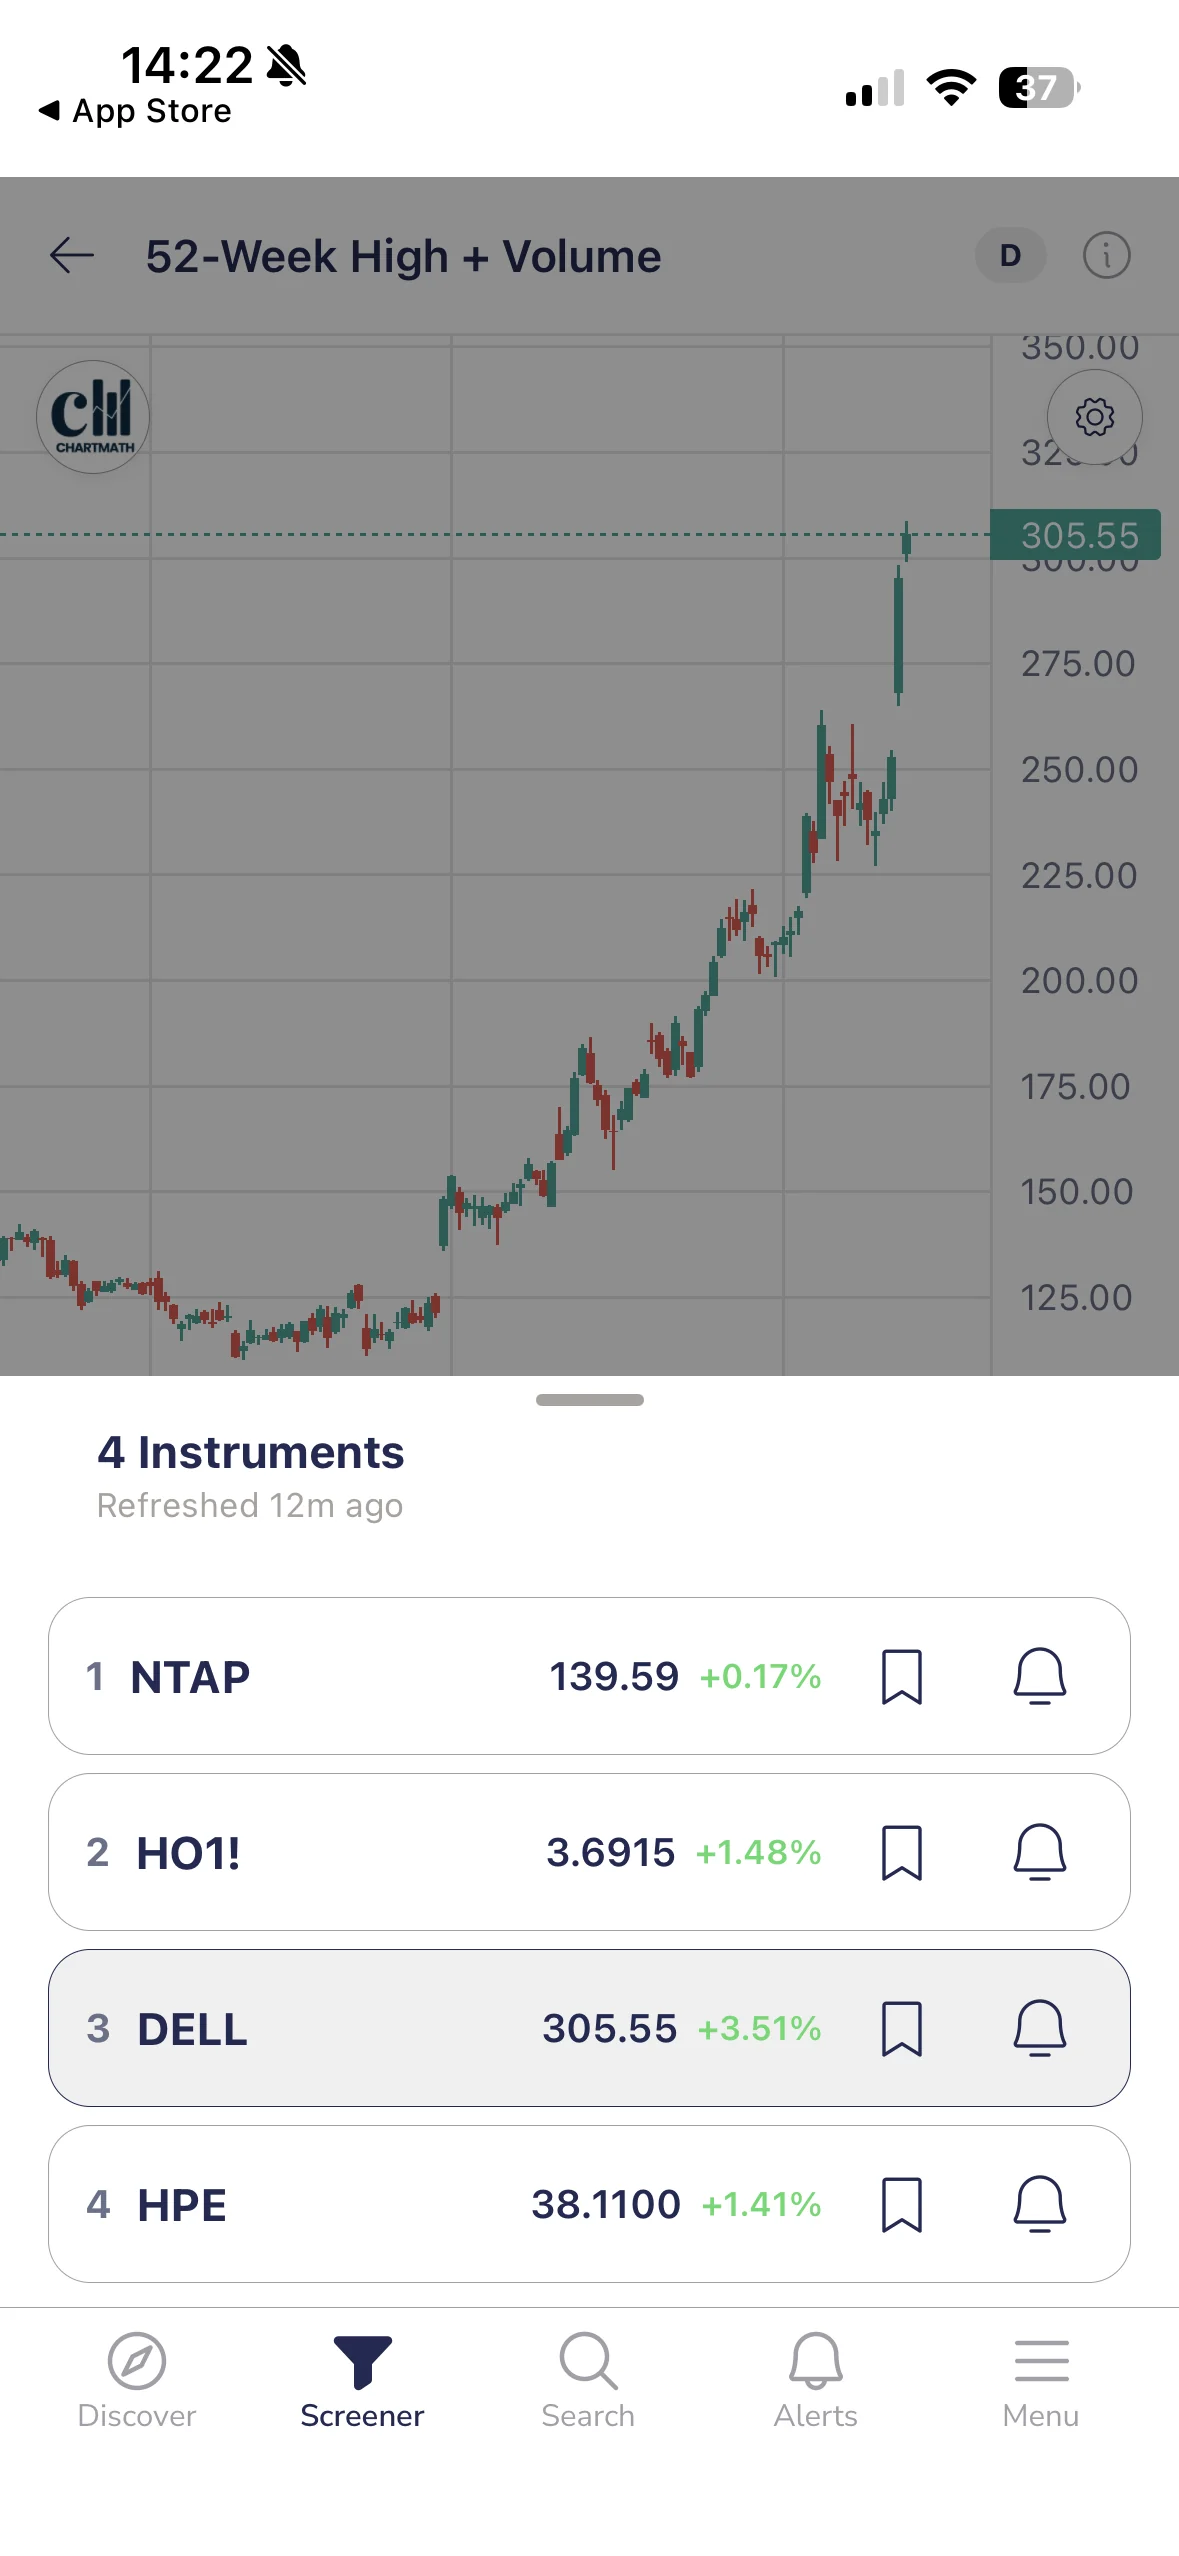
This is the specific gap ChartMath's screens are built to close. Each screen runs against a fixed universe of 500+ US equities and reports its Win Rate and Avg. Return across its full backtested history rather than a cherry-picked recent stretch. The 20-day consolidation breakout screen (daily) is the base-quality version of this idea, and the 52-week high and volume screen (daily) is the volume-confirmed one. Because the rule and the universe are both fixed, anyone can recompute the number instead of taking a highlight reel on trust. That is a meaningfully different foundation than eyeballing your own last few trades, and it is the same reasoning covered in more depth in how to use backtested win rate to pick trades.
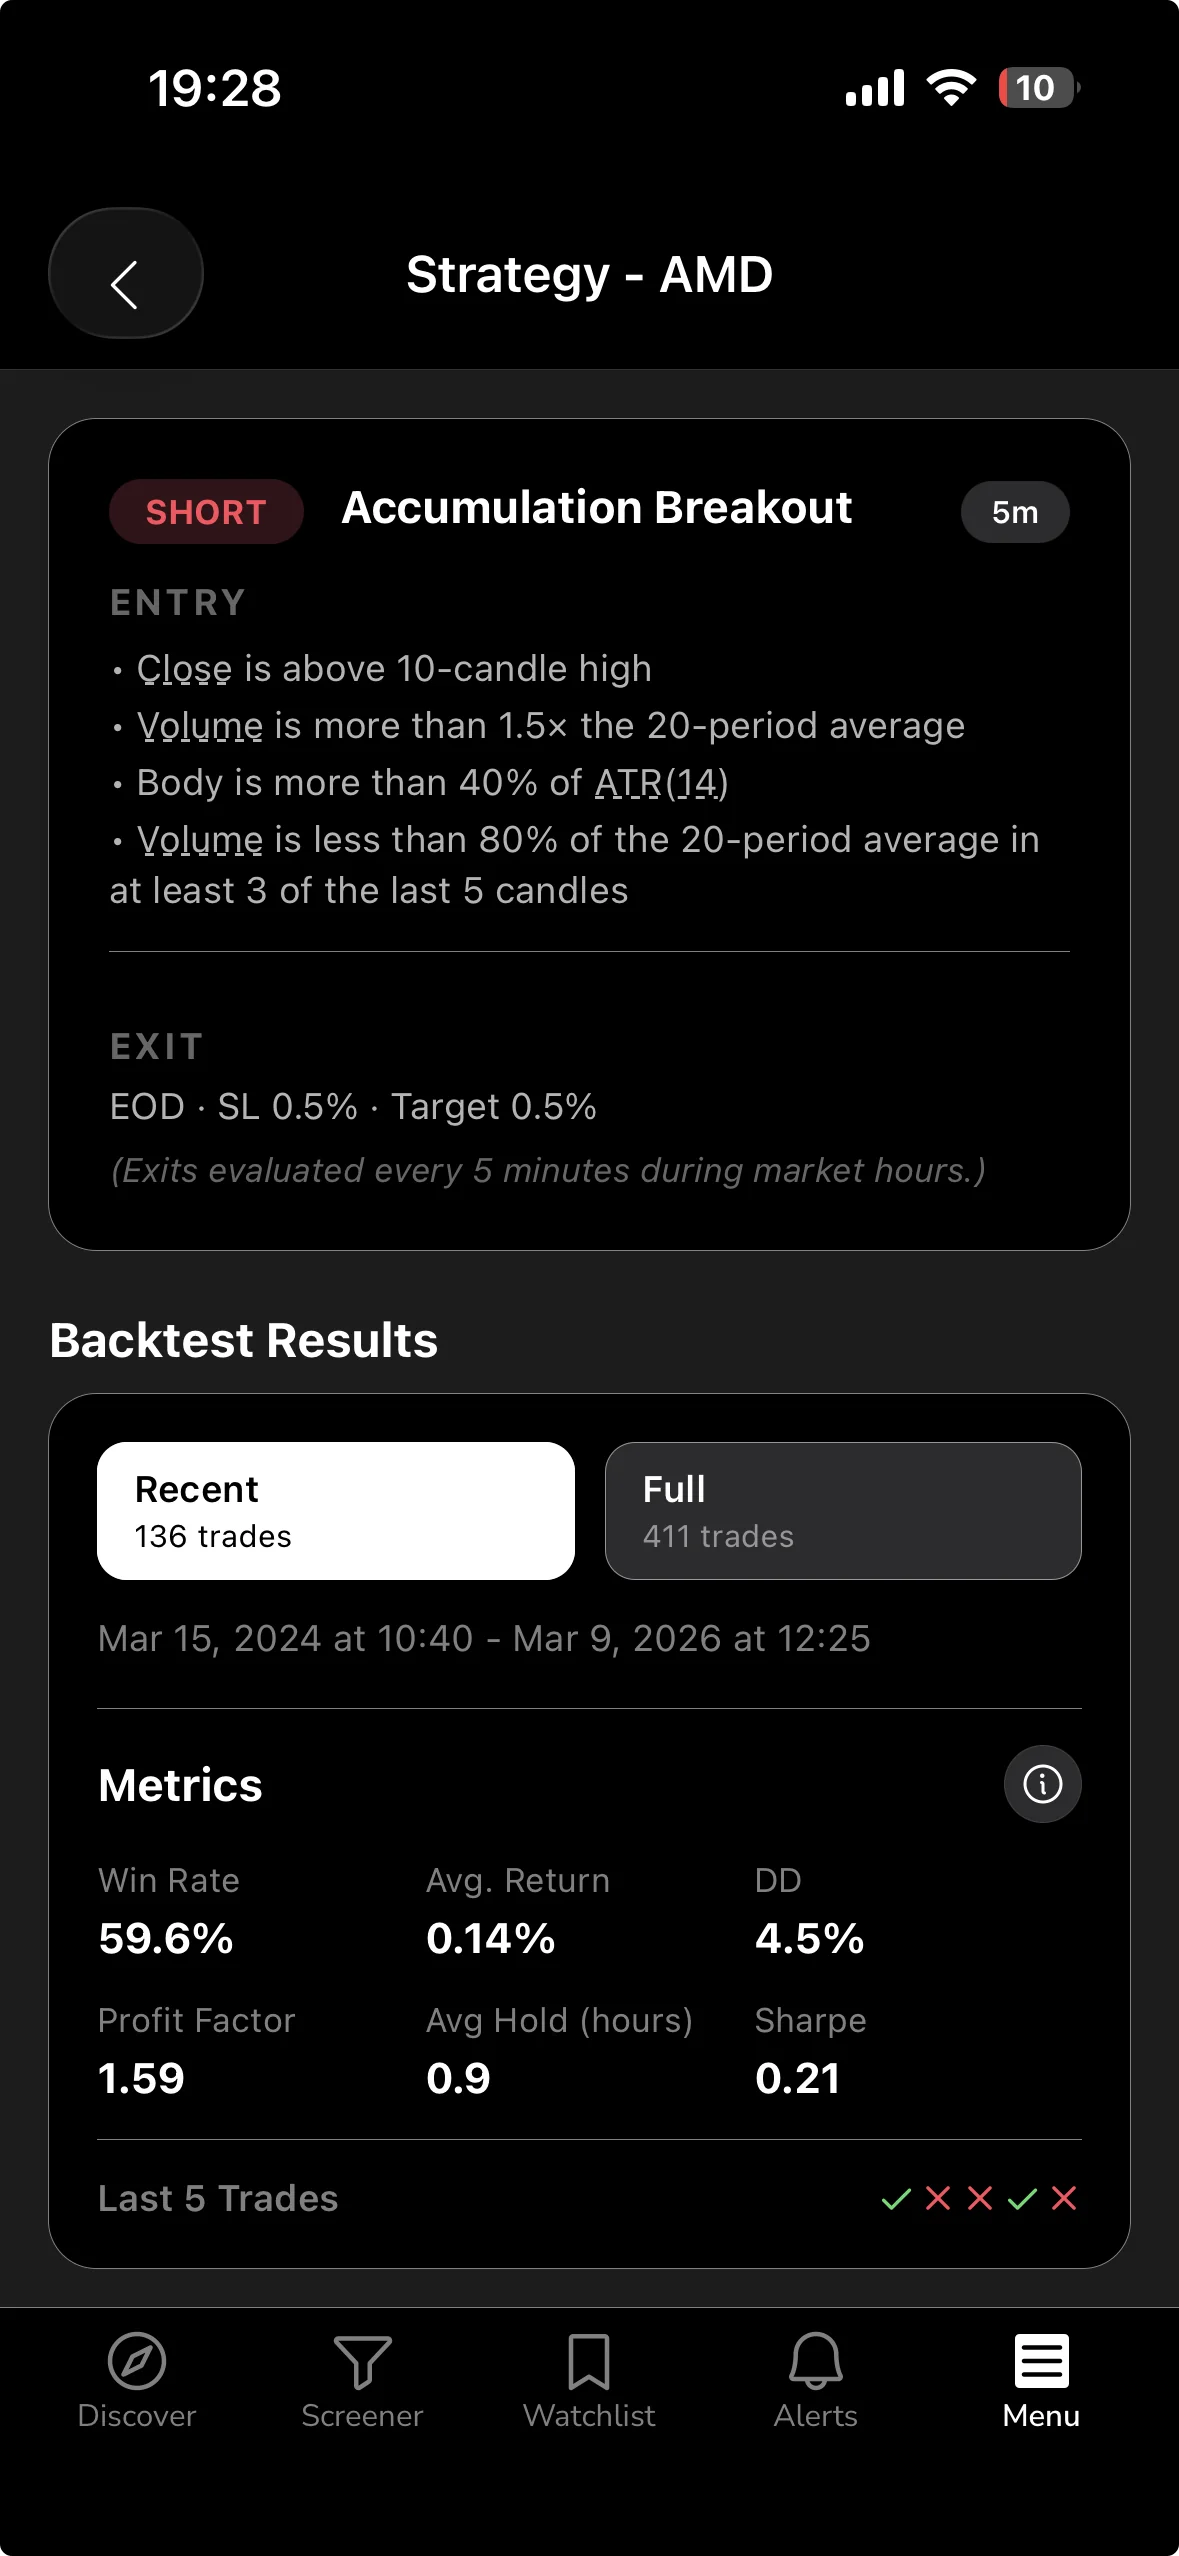
You can see this same principle applied to a different setup in RSI Oversold Bounce: Swing Trading Setup for Day Job Traders, where a small sample of recent bounces looks convincing until you check the full backtested record.
Recap: Rules to Screen a 20-Day High Breakout
- Check the base first. Measure the range's width against ATR over the prior 15-20 sessions. Favor tight bases over wide, choppy ones.
- Require volume expansion. The breakout session should print meaningfully above the 20 or 50-day average volume, not below it.
- Place the stop below the base low. Never use a flat percentage; let the chart structure set the distance.
- Size the position from the stop distance. Fix your dollar risk, then let share count fall out of the math, not the other way around.
- Consider stacking a longer horizon. A 20-day high that also sits near the 52-week high tends to carry less overhead supply.
- Judge the rule on a real sample. Look for a backtested record across dozens of trades and multiple years, not your last three fills.
Run It on Your Own Ticker
If you have a ticker on your watchlist right now sitting near a 20 day high, run these five checks before you do anything else: base width relative to ATR, breakout-day volume versus average, distance to a structural stop, proximity to the 52-week high, and whether the underlying screen has a documented record across a real sample size. ChartMath runs exactly this kind of check as a deterministic screen across a fixed 500+ US-equity universe, so the win rate and average return you see attached to a breakout setup is something you, or anyone, can recompute rather than trust blind.
You can browse the read-only screens catalog to see how a breakout screen is defined and what its backtested record looks like before deciding it's worth your time. For the full experience, including push alerts the moment a setup like this matches on your watchlist, download the app, it's free with no credit card required. If you want a broader primer first on what a screener should offer before you commit to one, What to Look for in a Stock Screener App: 2026 Guide is a solid next read, and if mobile alerts are your bigger pain point, Best Stock Scanner App with Real-Time Alerts covers that ground directly.
Take the base you're staring at right now and hold it against these five checks before you tap buy. That's the whole difference between chasing a coin flip and trading a filtered signal.

See these setups live in ChartMath
200+ curated screens with backtest data. Free. No credit card required.