How to Trade a Stock Consolidation Breakout Setup

You trade a stock consolidation breakout setup by waiting for a tight, sideways price range to form on shrinking volume, then confirming that specific pattern against a screen's backtested win rate before you act on the actual break. That last step, checking the rule's historical record instead of trusting your eyes on a chart, is what separates a repeatable process from a guess made under pressure.
Key Takeaways
- Range first, break second: A valid consolidation shows a narrowing price range and falling volume for at least several sessions before any breakout attempt counts as meaningful.
- Backtest the pattern, don't eyeball it: A screen like ChartMath's Low Volatility Compression rule recomputes its own win rate and average return, so you're checking a record instead of a hunch.
- Volume confirms the break: Relative volume above its recent average on the breakout bar is what separates a real move from a fakeout that reverses within a day or two.
- Size before you enter: A capital-split sizing method with stop and target pre-filled removes the guesswork that turns a good setup into a bad trade.
- Win rate alone doesn't pay the bills: A screen's average return per trade matters as much as its win rate; a high hit rate with tiny wins and rare large losses can still lose money.
At a Glance: Consolidation Breakout Setup
| Element | What to check |
|---|---|
| Range definition | Price stays within a horizontal band, typically 5-15+ sessions |
| Volume during range | Should contract versus the prior trend's average volume |
| Breakout trigger | Close beyond the range boundary, ideally with rising relative volume |
| Confirmation source | A backtested screen's win rate and average return, not a visual read alone |
| Order type | Limit (GTC) or Market, with stop and target pre-filled |
| Sizing method | Capital split: total balance divided by max positions held at once |
| Related patterns | NR7, NR4, low volatility compression, opening range breakout |
| Where to track it | Portfolio tab, compared against the screen's sample size over time |
1. Spot a Tight-Range Consolidation Before It Breaks
A consolidation is a period where a stock trades sideways after a prior trend, usually inside a range that gets progressively narrower. Traders look for a defined ceiling of resistance and a defined floor of support, with price bouncing between the two while volume dries up. That contraction is the tell. It says supply and demand have reached a temporary balance, and the stock is coiling for its next move, as tastytrade's breakout trading guide explains.
The mistake most traders make is eyeballing the range and guessing which way it breaks. A chart that "looks tight" to one person looks noisy to another. That subjectivity is exactly why a pattern like this needs a rule, not a feeling, behind it.
Two related, narrower variants worth knowing: NR7 (narrowest range of the last seven sessions) and NR4 (narrowest range of the last four). Both flag the same underlying idea, a volatility squeeze, just on a shorter lookback. If you want the mechanics of NR7 specifically, our guide to the NR7 volatility contraction setup breaks down how the rule is defined and what it has actually resolved to.
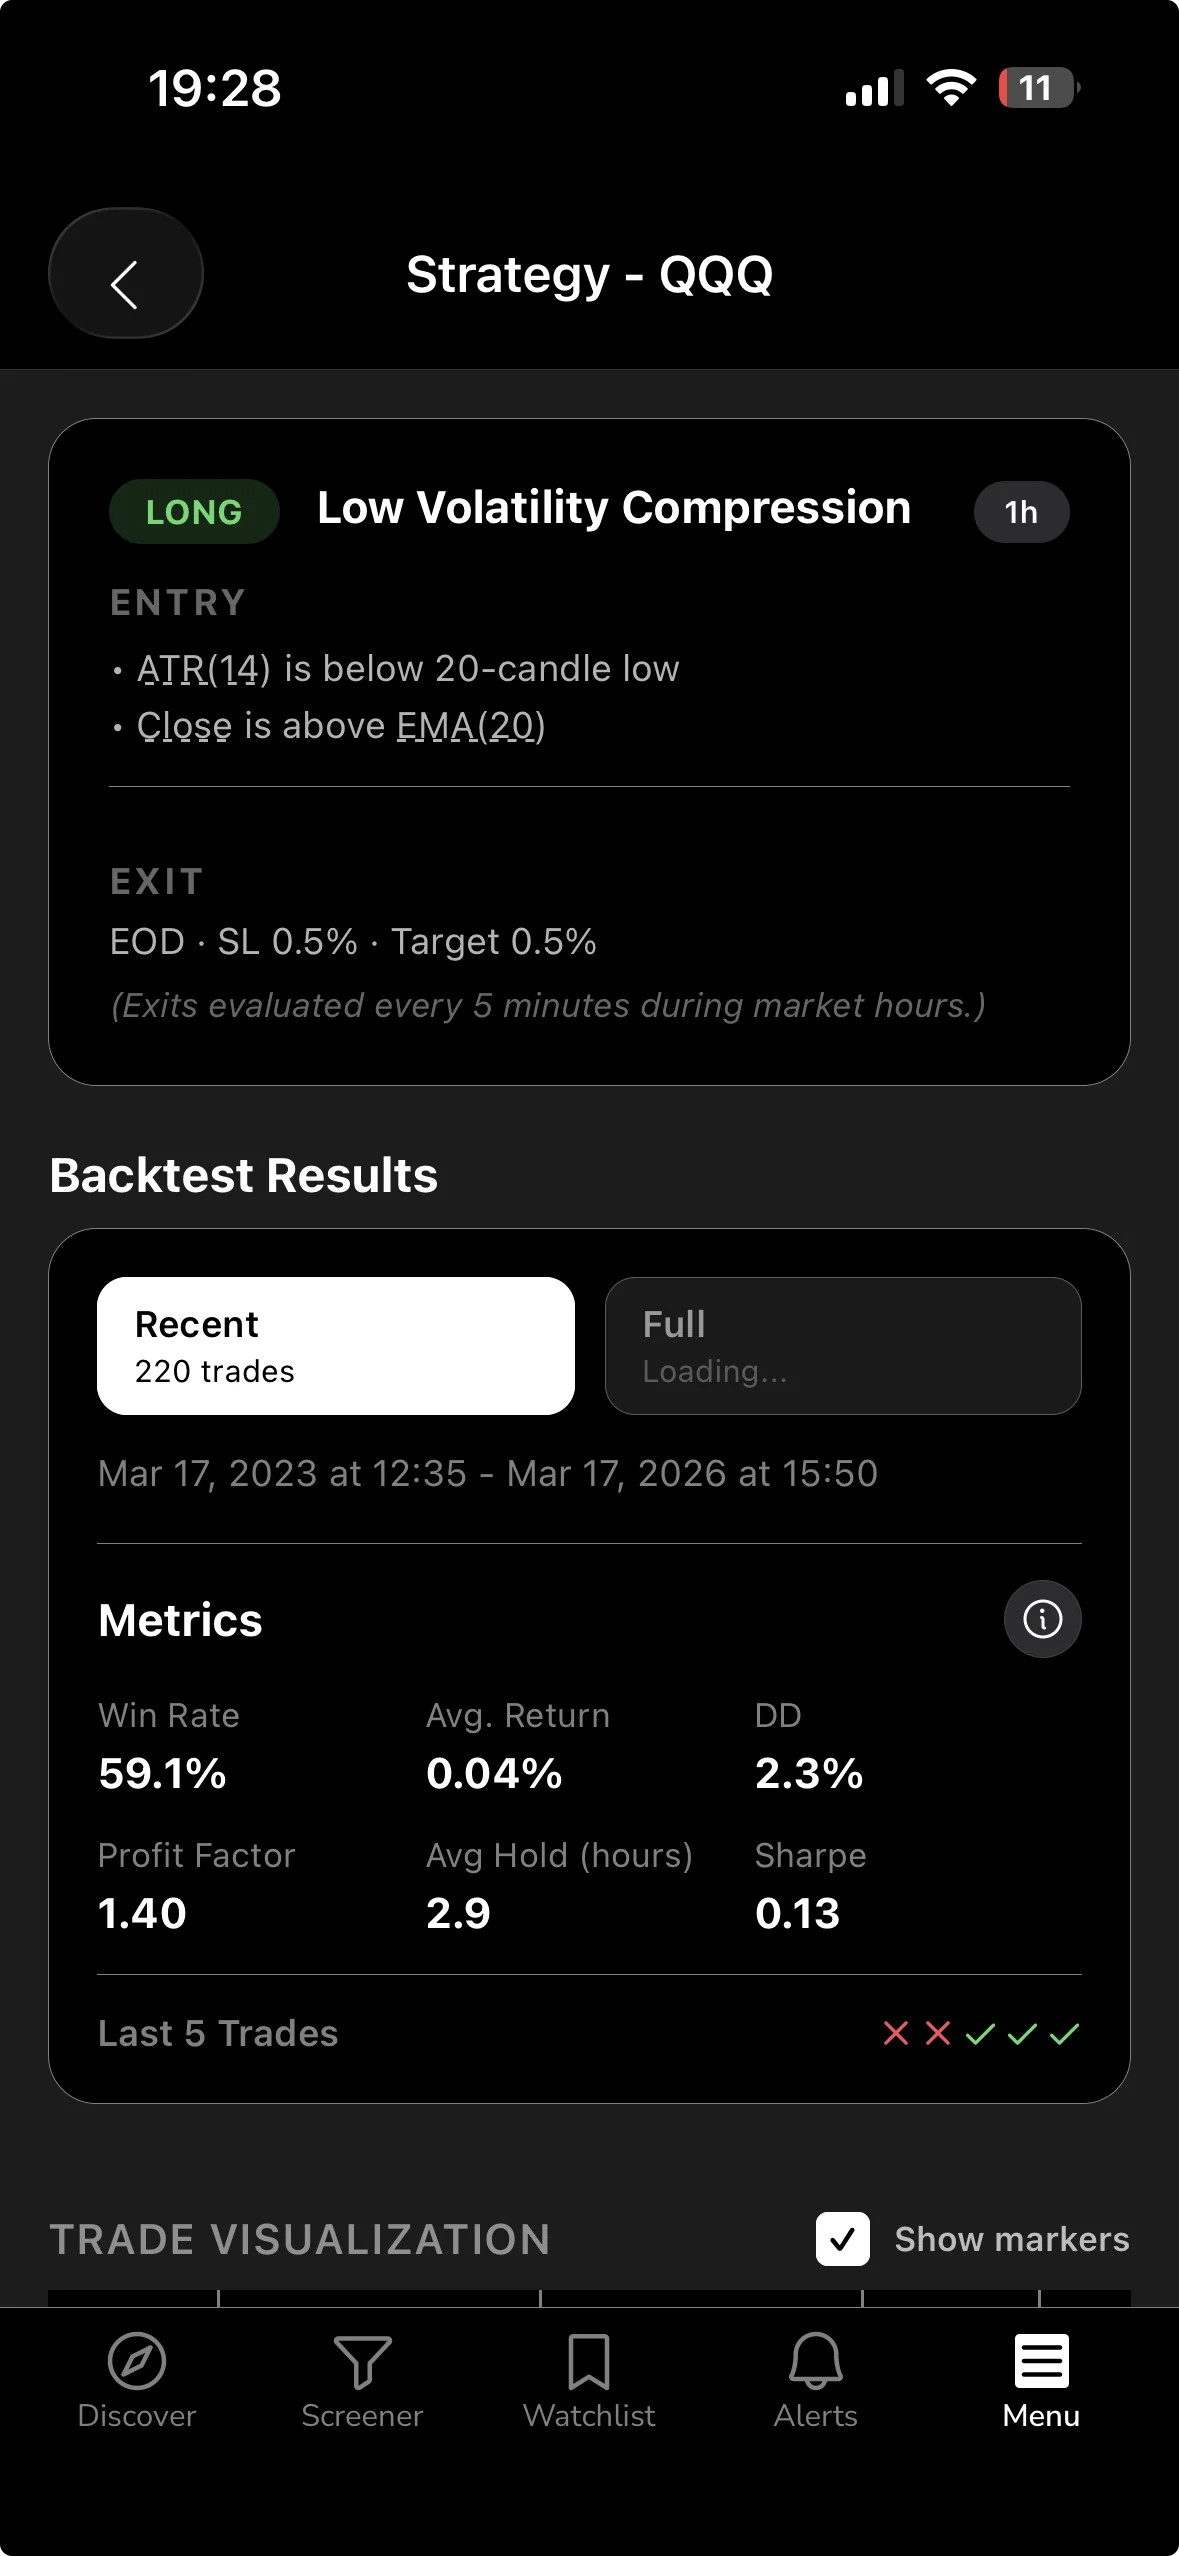
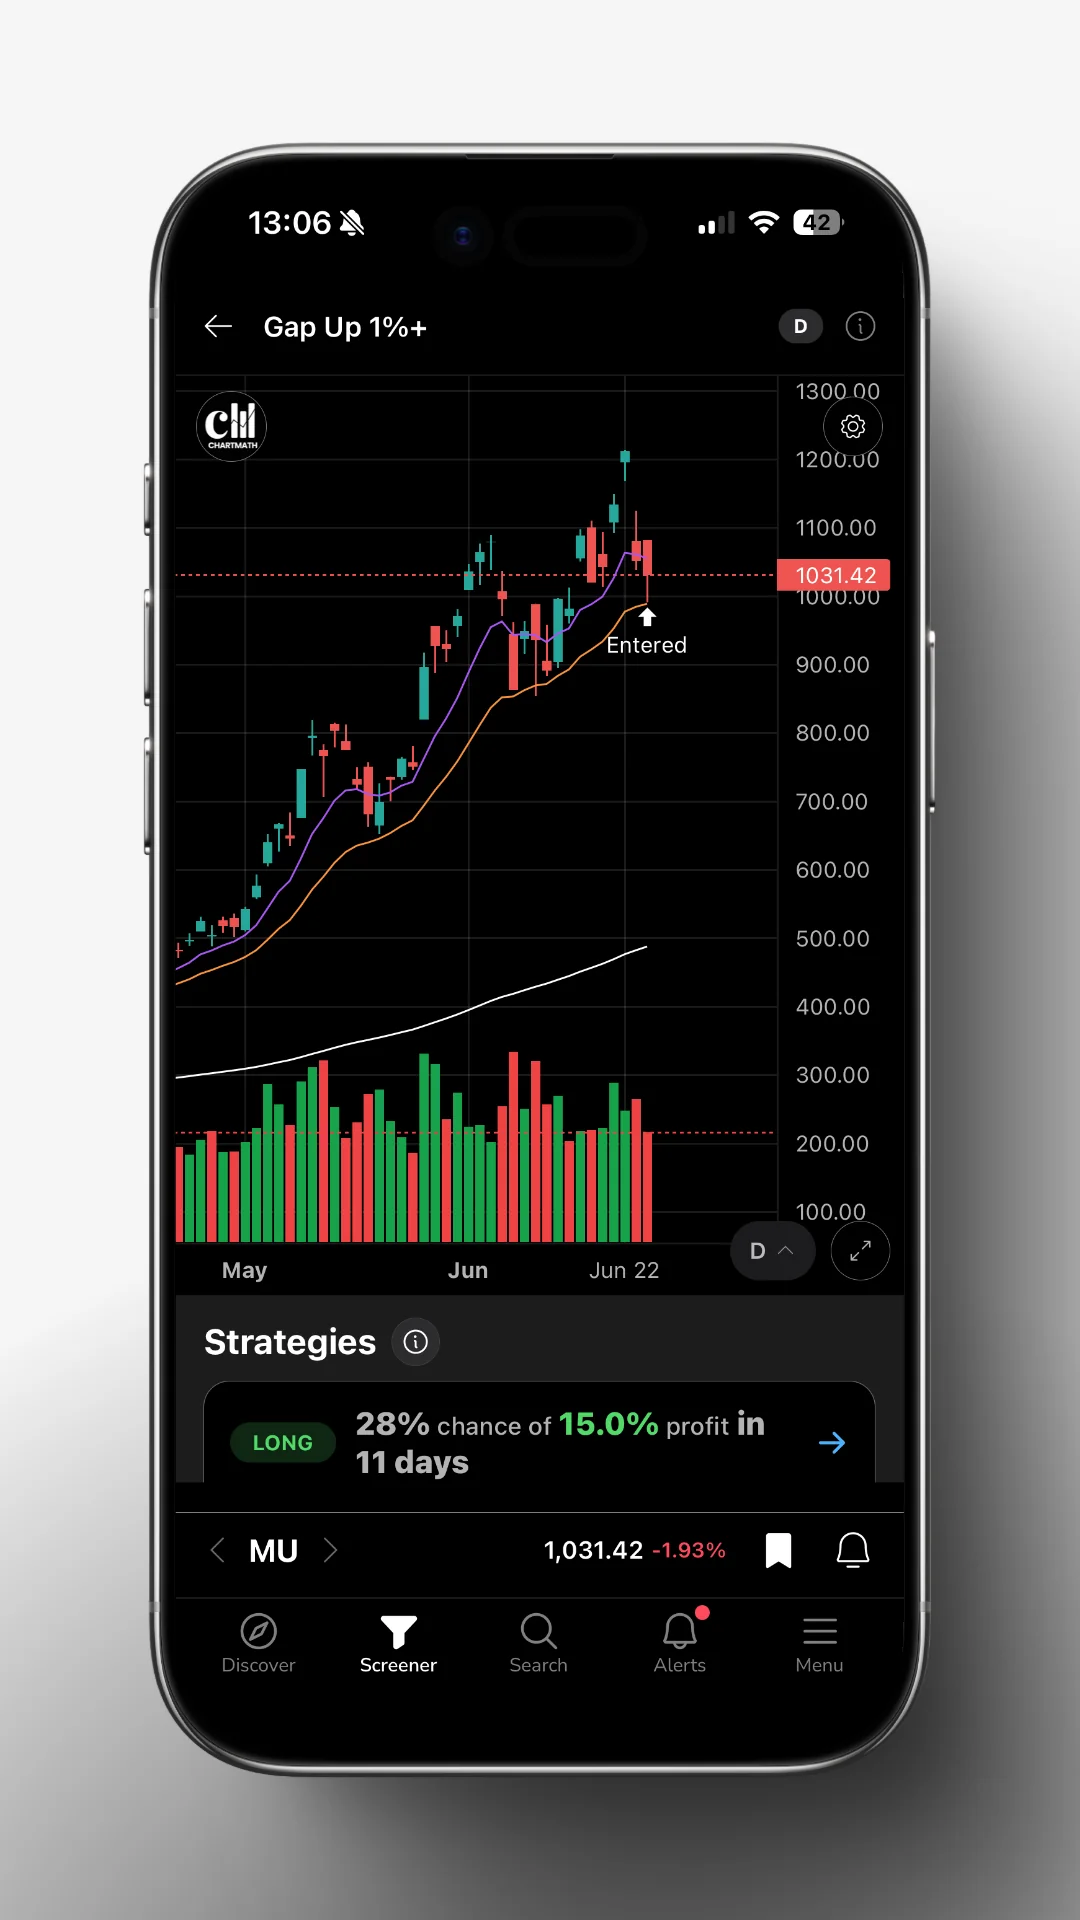
Look at the chart above: a Low Volatility Compression screen flags the exact moment the range has tightened enough to matter, alongside the backtested record for what happened next. That's the difference between "this looks tight to me" and "this specific compression rule has a documented history."
2. Confirm the Pattern With a Backtested Screen Instead of a Gut Call
You confirm a consolidation breakout by checking a screen's backtested win rate and average return for that exact rule, not by trusting how the chart looks on your screen. A fixed rule can be recomputed across its full history, which a visual judgment call never can.
Chart pattern recognition by eye is inconsistent. Two traders staring at the same five-day range will draw different trendlines and reach different conclusions. A deterministic screen removes that variance: the rule either matched or it didn't, and its historical win rate is the same number no matter who's looking at it.
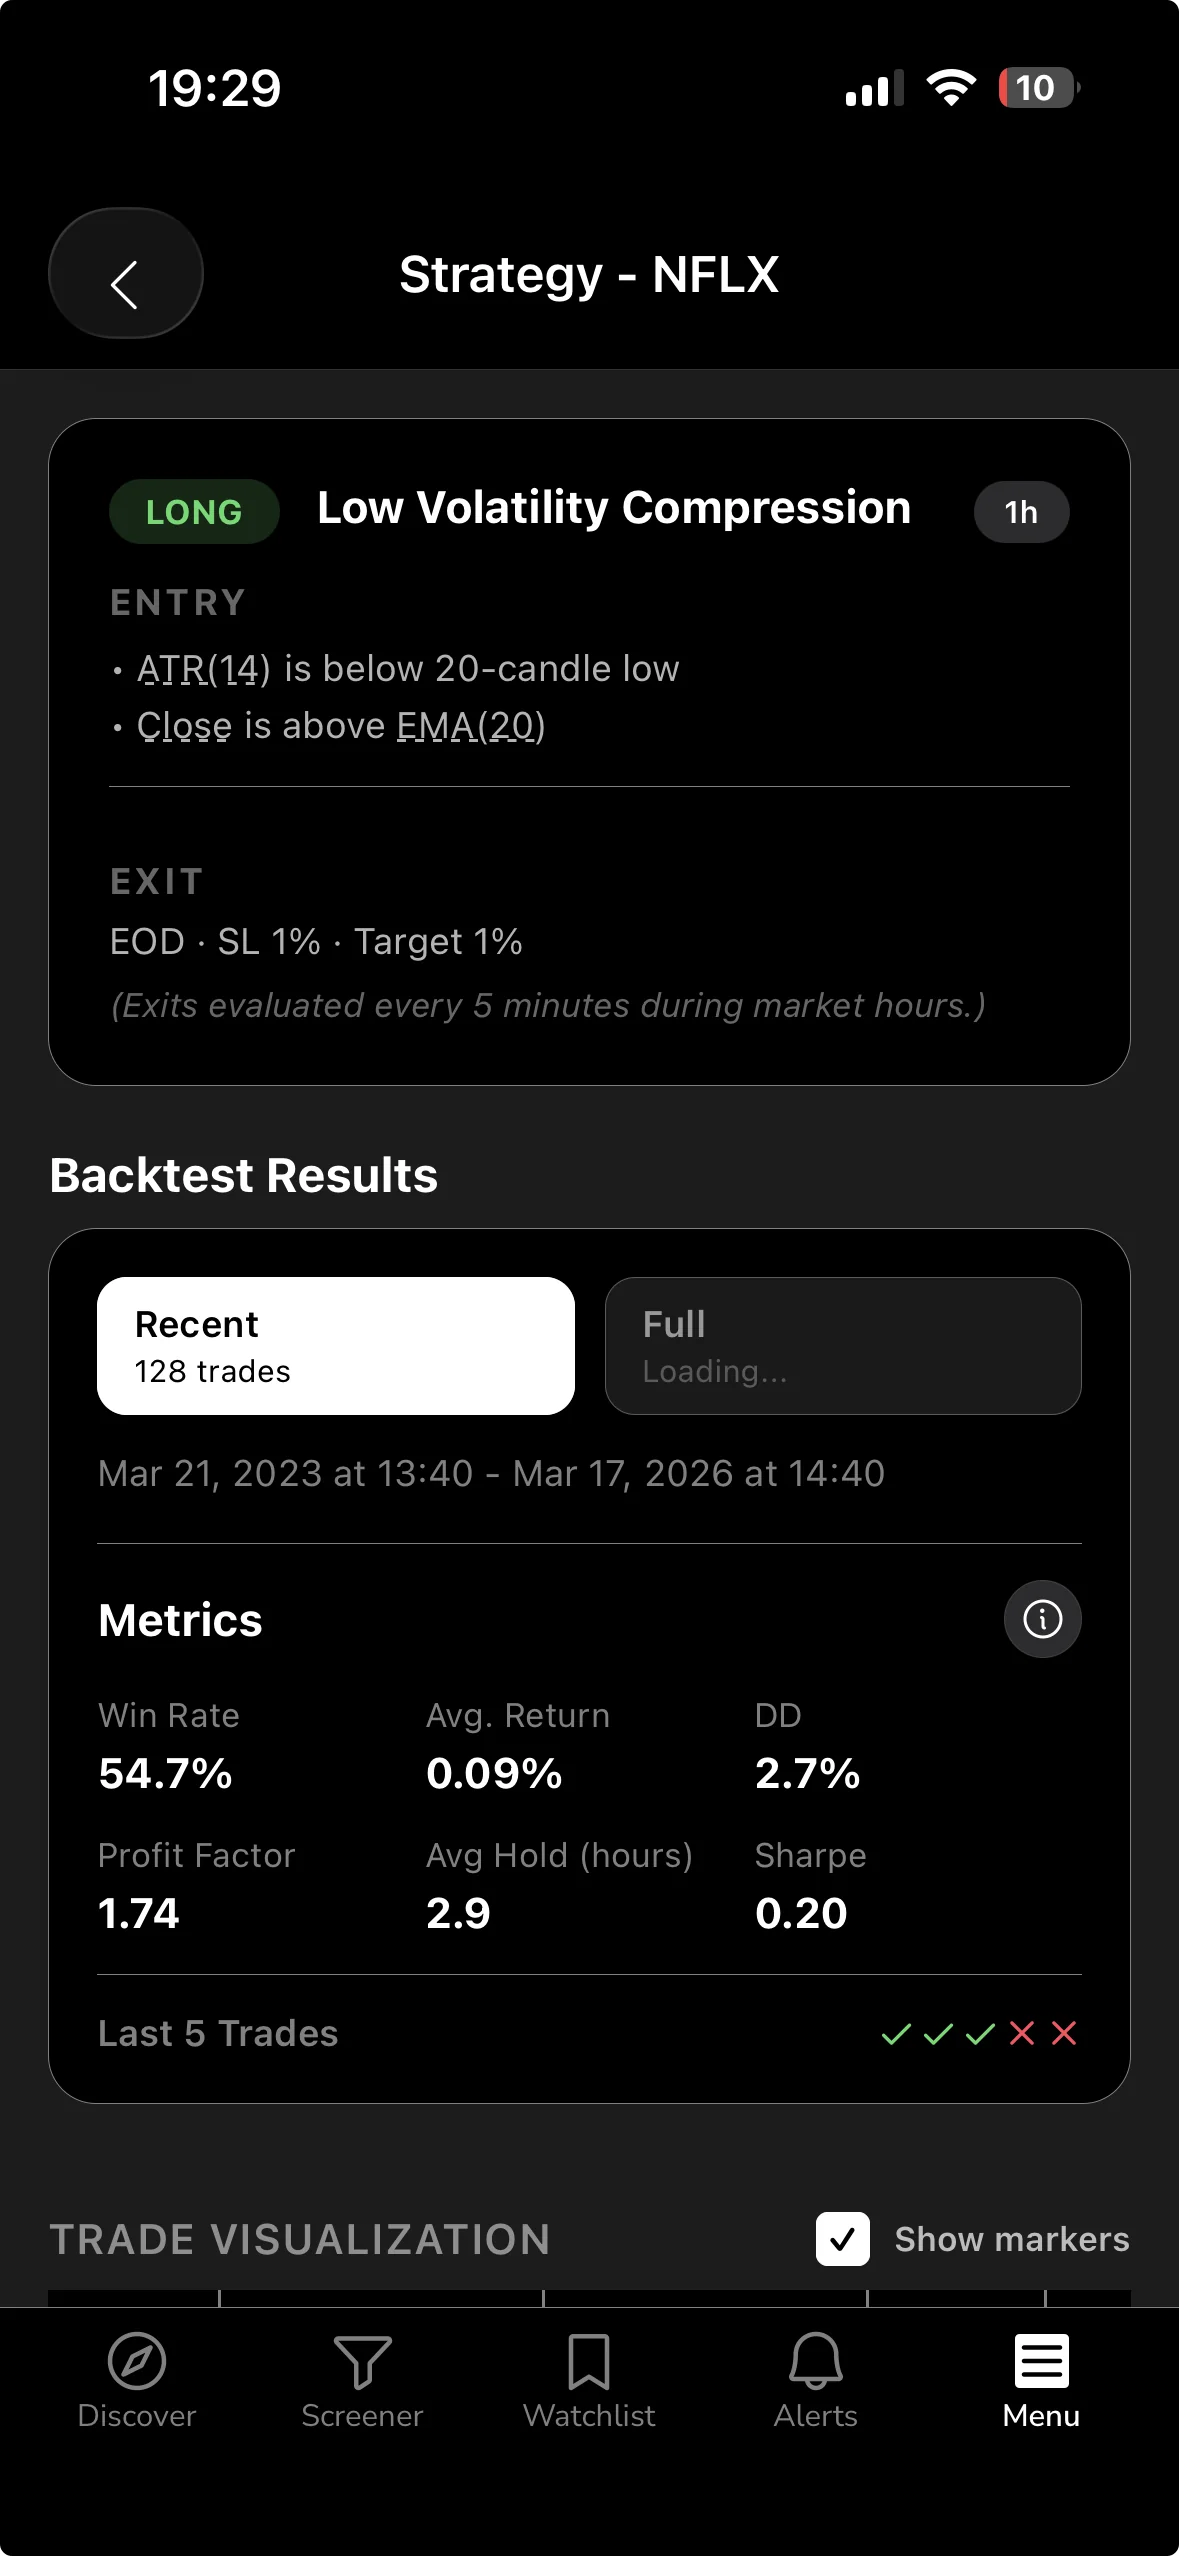
This is where ChartMath's approach differs from scrolling through charts manually. Every screen, including Low Volatility Compression, carries its own backtested Win Rate and Avg. Return, computed from the same fixed rule every time it's run. You're not asking "does this look like a good setup," you're asking "how has this exact rule performed historically, and how big is the sample." That distinction matters more the longer you trade, because validating a setup before you risk capital is the step most retail traders skip entirely.
3. Read the Plain-English Alert Reason
Why does an alert need to explain itself?
An alert needs a plain-English reason because a bare ticker symbol tells you nothing about whether the setup still holds. The reason names the exact rule that fired, so you can judge it on its merits instead of taking it on faith.
Compare that to a signal forwarded in a group chat with no context beyond "TSM breaking out, buy now." You have no idea what rule triggered it, whether it's been tested, or how often it's worked before. A screen-enter alert instead carries the ticker, the timeframe, the screen name, a timestamp, and the reason it matched, all in one card.
The rule won a documented share of the time across its backtested history. That's a statement about the past, not a forecast of what happens to your next trade.
That phrasing matters. A win rate is a historical average across many prior instances of the same rule, and past performance never guarantees a specific outcome on the trade in front of you right now. Treat every backtested figure as hypothetical performance data, useful for comparing setups, not as a promise.
4. Size a Paper Trade With Stop and Target Pre-Filled
You size a paper trade by letting a capital-split method divide your total simulated balance by the number of positions you're willing to hold, so the resulting share count and dollar risk are calculated for you before you tap Buy. That removes the mental math that trips up traders mid-session.
Once a consolidation breakout screen matches, opening the alert card takes you straight to an order ticket with entry, stop, and target already worked out. You choose between a Limit (GTC) order or a Market order, review the numbers, and decide whether to place it. Nothing executes on its own. It's a copilot, not an autopilot: you tap to place every order.
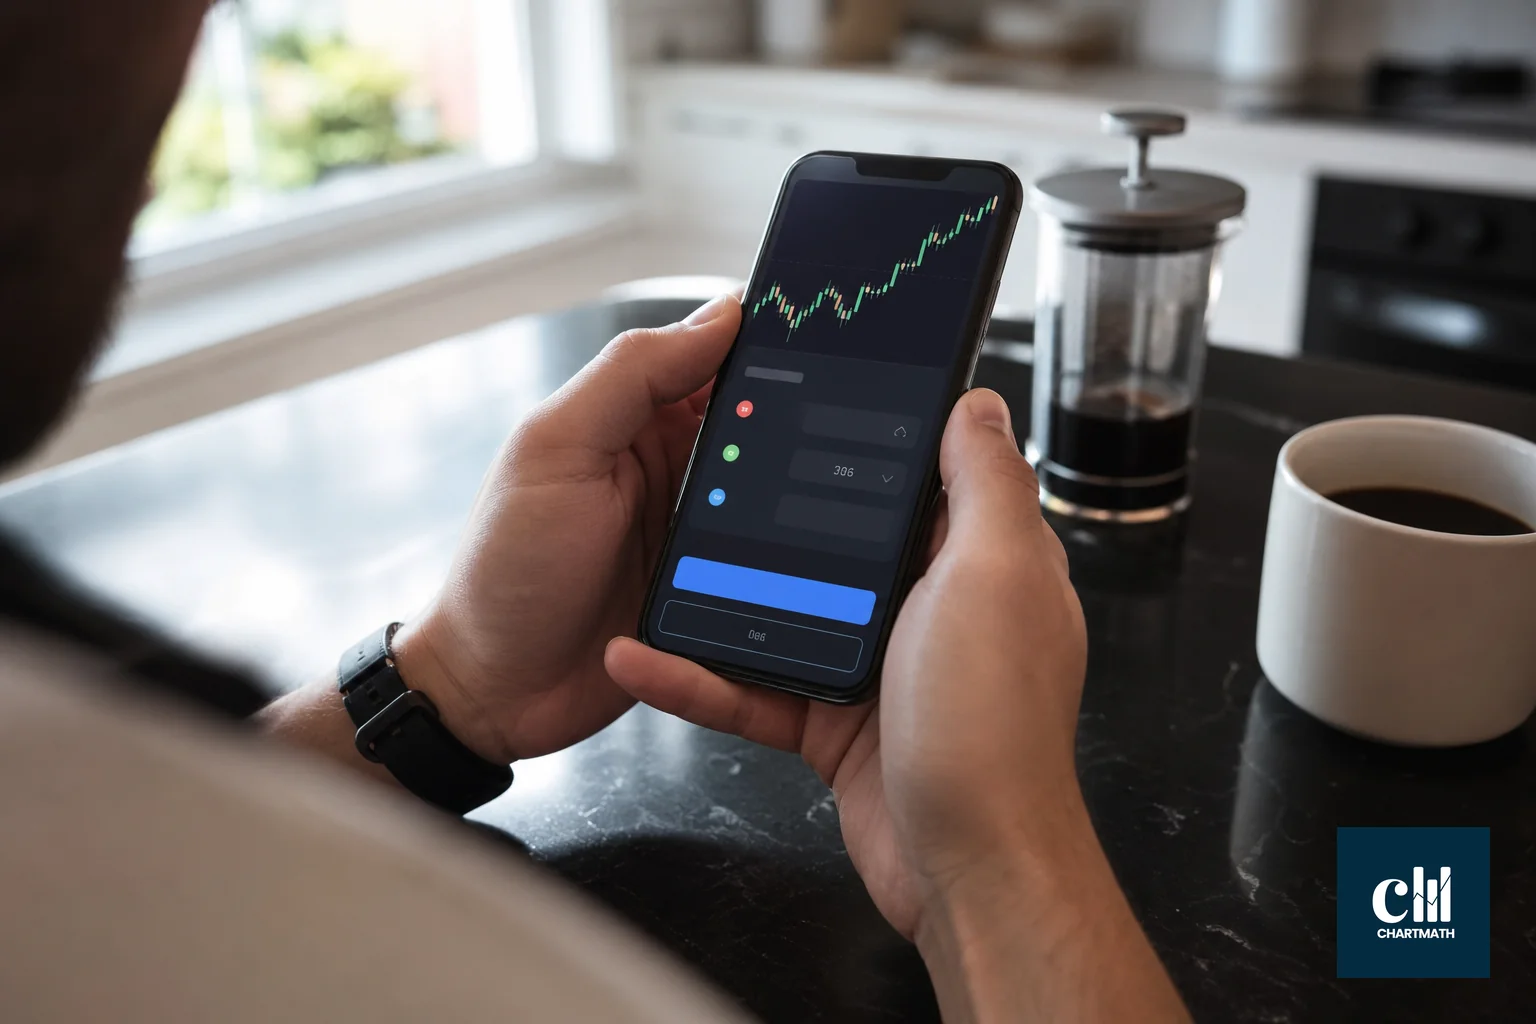
Because the position is simulated rather than live, you can rehearse the exact mechanics of a breakout trade, including how tight your stop sits below the consolidation floor, without committing real money to test whether your read on the pattern held up. If you're new to sizing logic specifically, our piece on trading stocks systematically as a beginner covers the underlying framework in more depth.
5. Track the Trade in the Portfolio Tab
You track a consolidation breakout trade in the Portfolio tab by watching the open position's distance to stop and target, then reviewing the closed trade and its batch stats once it resolves. That's where the real work happens, because one trade tells you almost nothing on its own.
The value isn't the single outcome. It's building a real sample of trades against the same screen over weeks, then comparing your realized batch stats to that screen's backtested win rate and average return. If your results consistently diverge from the backtest, that's useful information about execution, slippage, or market regime, not a reason to panic after one or two trades.
Why a High Win Rate Doesn't Guarantee Profit on a Breakout
A high win rate on a consolidation breakout screen tells you how often the rule has historically resolved in your favor, not how much you make or lose on each trade. A screen that wins 70% of the time but loses big on the other 30% can still be a net loser.
This is why Avg. Return sits next to Win Rate on every screen card instead of standing alone. A trader chasing the highest win rate number without checking the average return, or the sample size behind it, is optimizing for the wrong metric. We've covered this trap in more depth in our piece on how to validate a setup before you risk capital, and it applies directly to breakout patterns, which tend to produce dramatic-looking win rates on small samples.
What is relative volume in day trading?
Relative volume, or RVOL, compares a stock's current trading volume to its typical volume at the same time of day. A breakout on relative volume above 1.5x to 2x its recent average carries more weight than the identical price move on thin, below-average volume.
Volume expansion on the breakout bar is often the single fastest way to separate a genuine move from a fakeout. A price close above resistance on weak volume tends to fail and drift back into the range within a session or two, according to FinWiz's technical analysis notes on consolidation patterns.
What is an NR4 breakout?
An NR4 breakout is a price move that follows the narrowest daily range of the last four sessions, the same volatility-contraction logic as NR7 but on a tighter, more sensitive lookback window. It flags compression faster, at the cost of triggering more often on noise.
Because NR4 fires more frequently than NR7, it's worth backtesting separately rather than assuming its historical edge matches its longer cousin. Treat it as a related but distinct rule with its own win rate and sample size to check.
Building This Into a Trading Stack You Can Run With a Day Job
You don't need to sit at a monitor all day to trade consolidation breakouts. Add the tickers you actually follow to a single watchlist, favorite the breakout and compression screens you trust, and let screen-enter alerts do the watching for you.
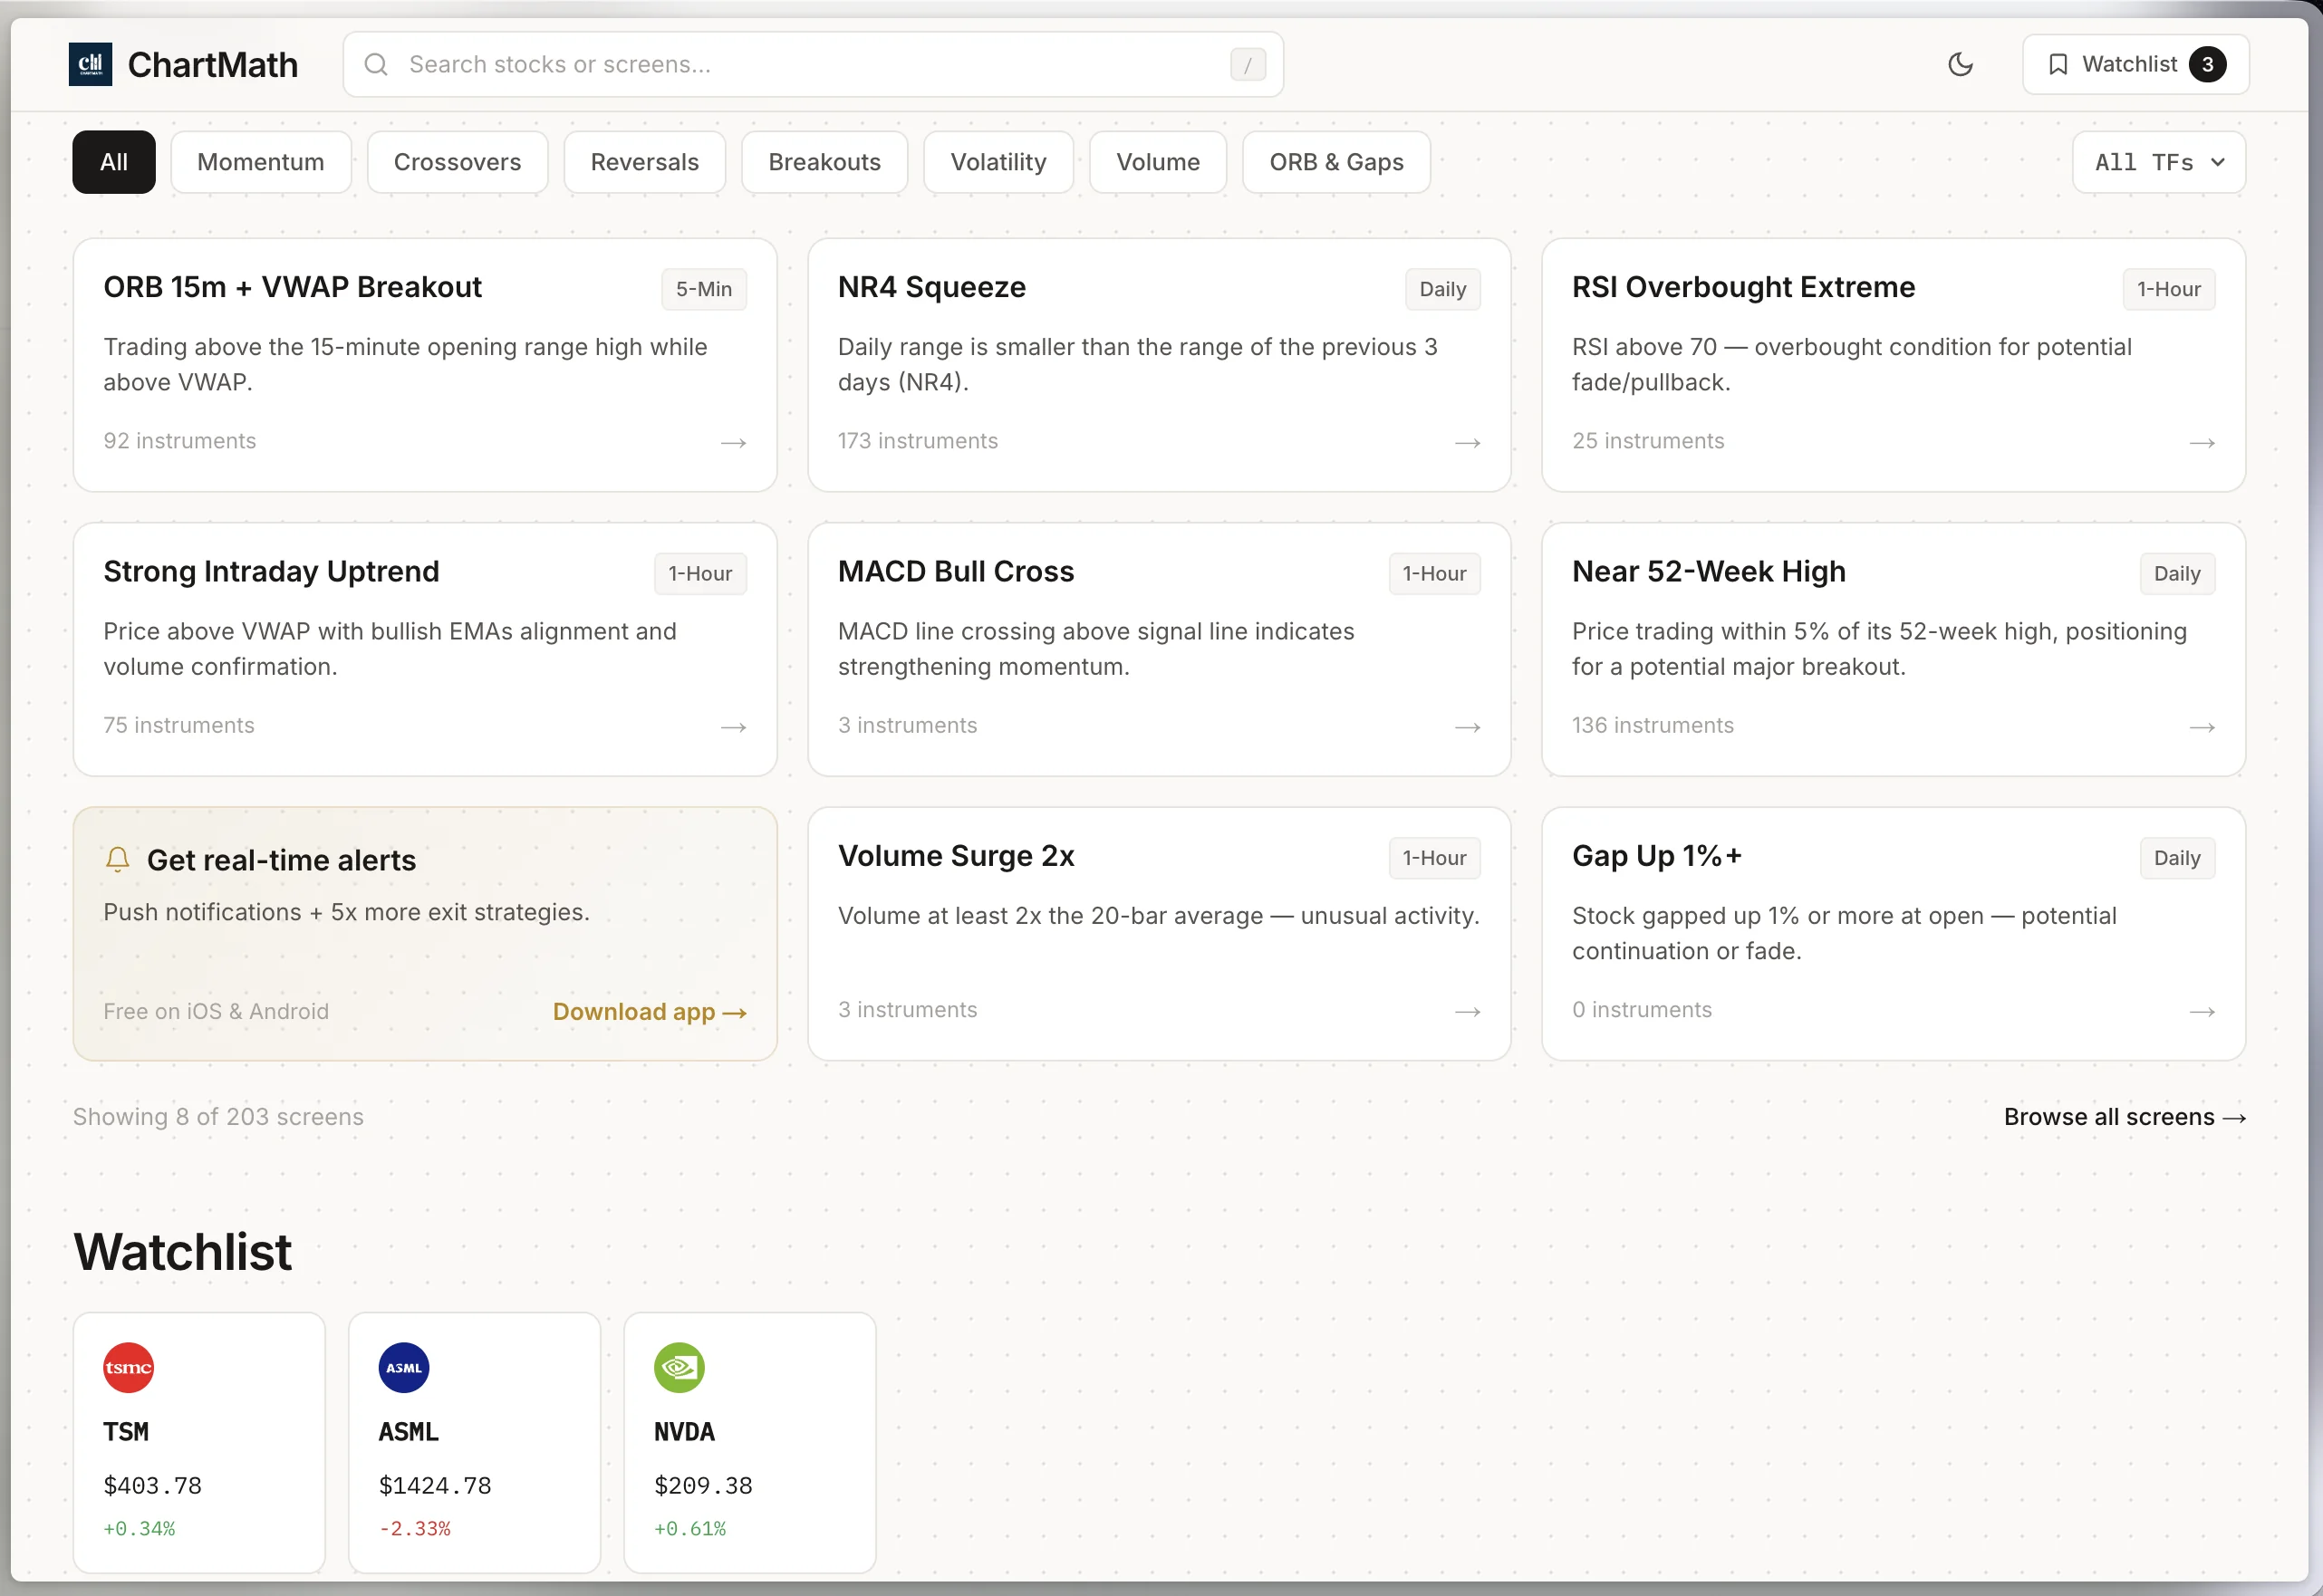
That workflow turns a pattern that used to require refreshing charts every few minutes into a push notification you check between meetings. If you want the full routine for building that stack, see our guide on integrating a stock screener into your daily routine, and pair it with our notes on confirming a swing setup across multiple timeframes before you size a trade.
Traders across the United States, the EU, and elsewhere run this same process regardless of which exchange they trade, since the underlying discipline, wait for the range, confirm with a backtested rule, size before entry, doesn't change by region.
Frequently Asked Questions
How long does a consolidation usually last before a breakout?
Most consolidations run anywhere from five sessions to several weeks, depending on the timeframe you're trading. There's no fixed duration; what matters is that the range keeps narrowing and volume keeps contracting the longer it lasts.
Is a breakout from consolidation a reliable trading signal?
A breakout from consolidation is reliable only when it's backed by rising volume and a documented backtested win rate for that specific rule. Without either check, a breakout on a chart alone is a guess dressed up as a signal.
What timeframe works best for spotting consolidation patterns?
Daily and weekly charts tend to produce the cleanest consolidation patterns for swing traders, since intraday ranges are noisier and prone to more false breaks. That said, the same compression logic applies on hourly charts for traders who prefer faster setups.
Put the Process to Work
A tight range and a confident-looking chart aren't enough on their own. The traders who consistently catch consolidation breakouts pair the pattern with a rule they can recompute, a plain-English reason for every alert, and a sized paper trade before real capital is on the line. That's the whole point of running screens instead of guessing.
You can browse the compression and breakout screens yourself on the web-based screener, or grab the mobile app to get the alert, the pre-filled order ticket, and the Portfolio tab in one place. Download the app and start rehearsing your next consolidation breakout as a paper trade before you risk a dollar on it, or watch a quick demo to see the workflow end to end.
Recommended Resources

See these setups live in ChartMath
200+ curated screens with backtest data. Free. No credit card required.