RSI Oversold Bounce: Swing Trading Setup for Day Job Traders
RSI drops below 30. You notice it on a stock you've been watching. Your first instinct is to buy the dip. That instinct is understandable — and it's also how a lot of traders get hurt. The RSI oversold bounce is a real, tradeable setup. But "oversold" by itself is not a reason to enter. The filter layer is everything, and if you have a day job, you need a system that applies those filters for you while you're in meetings.
This guide walks through exactly how the setup works, what separates a genuine bounce from a falling knife, and how to find high-probability RSI bounce candidates across 500+ US equities without staring at charts all day.
1. What the RSI Oversold Bounce Actually Is
The Relative Strength Index (RSI) is a momentum oscillator that measures the speed and magnitude of recent price changes on a scale of 0 to 100. Readings below 30 are conventionally labeled "oversold," meaning the stock has sold off hard enough that sellers may be exhausting themselves. Readings above 70 are "overbought."
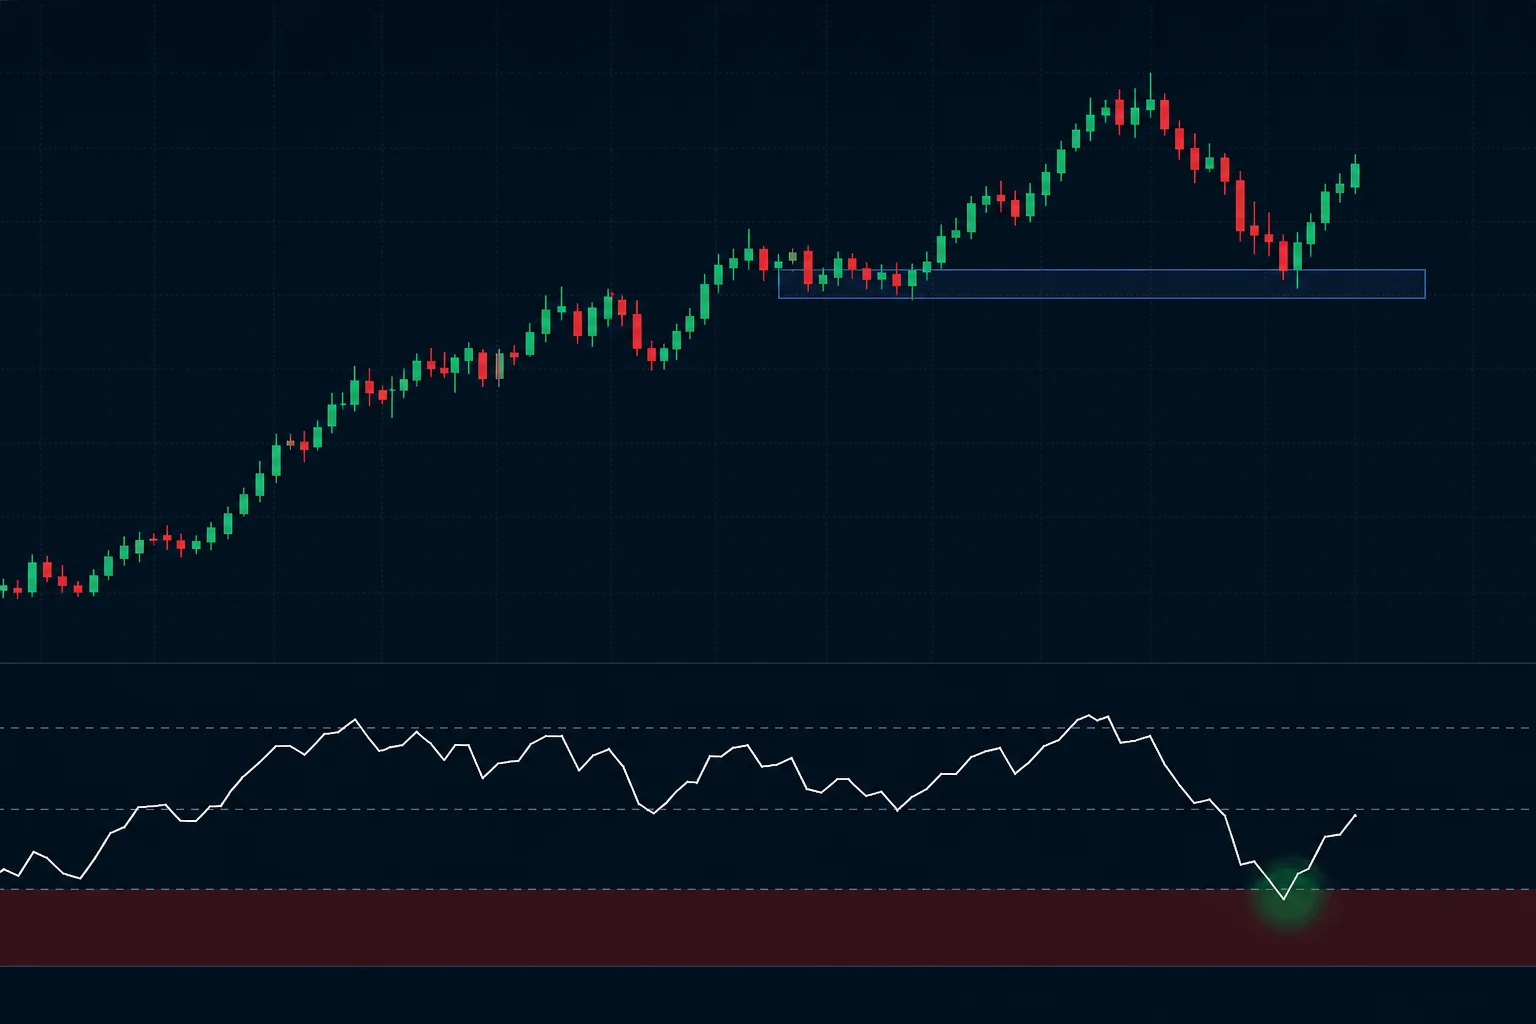
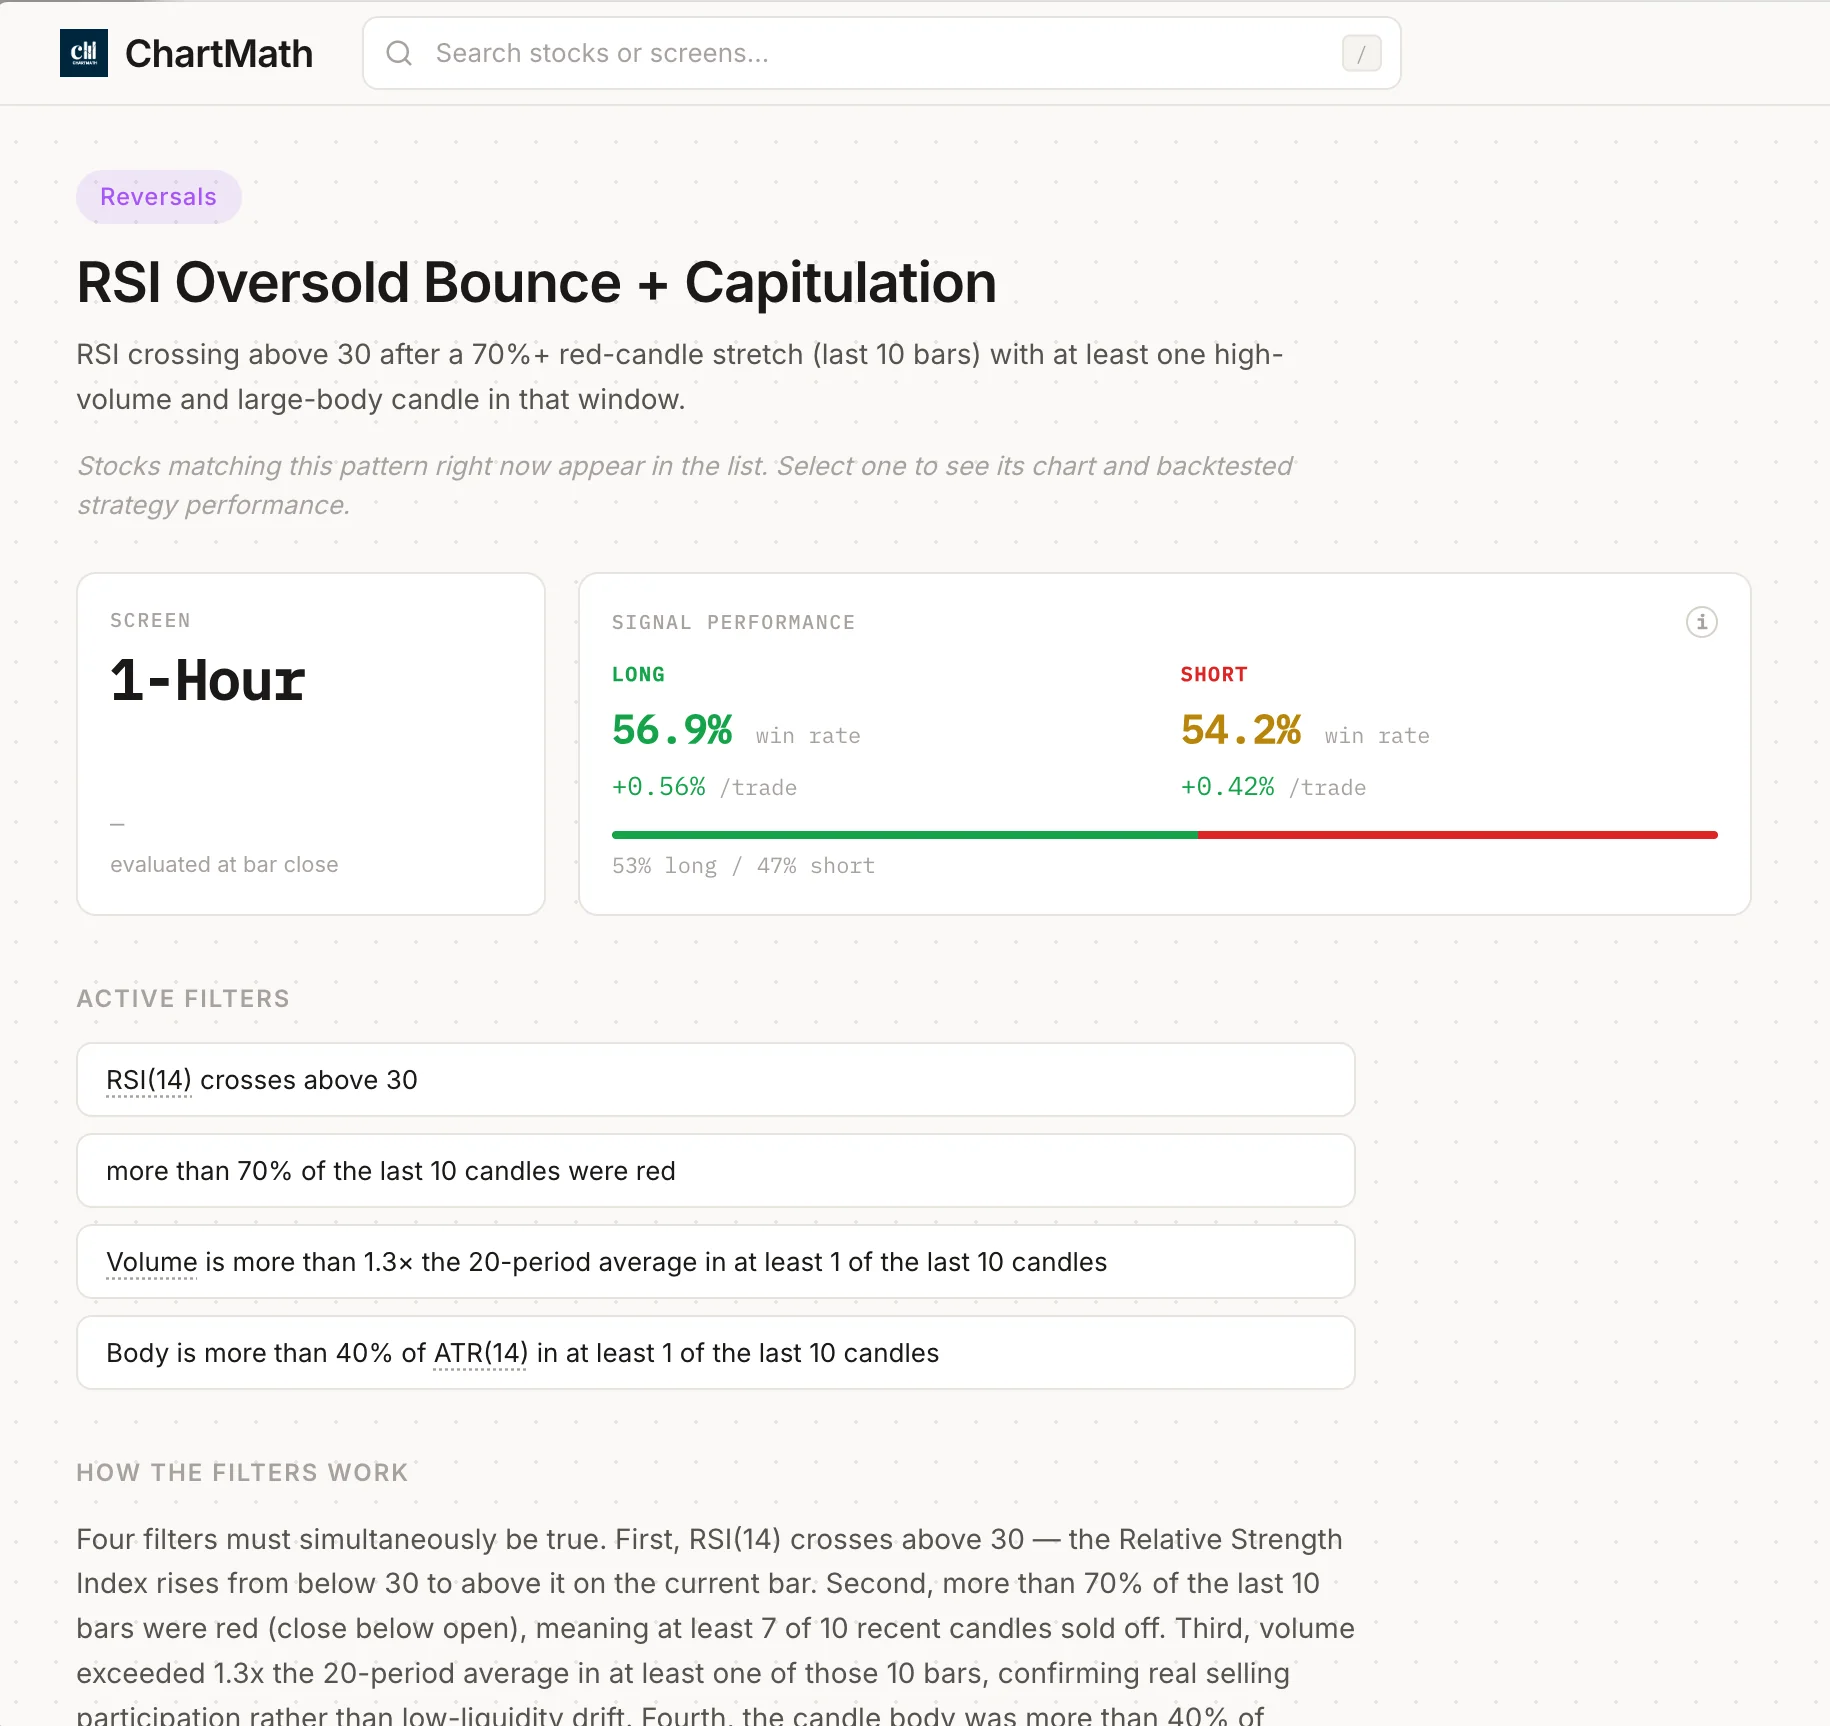
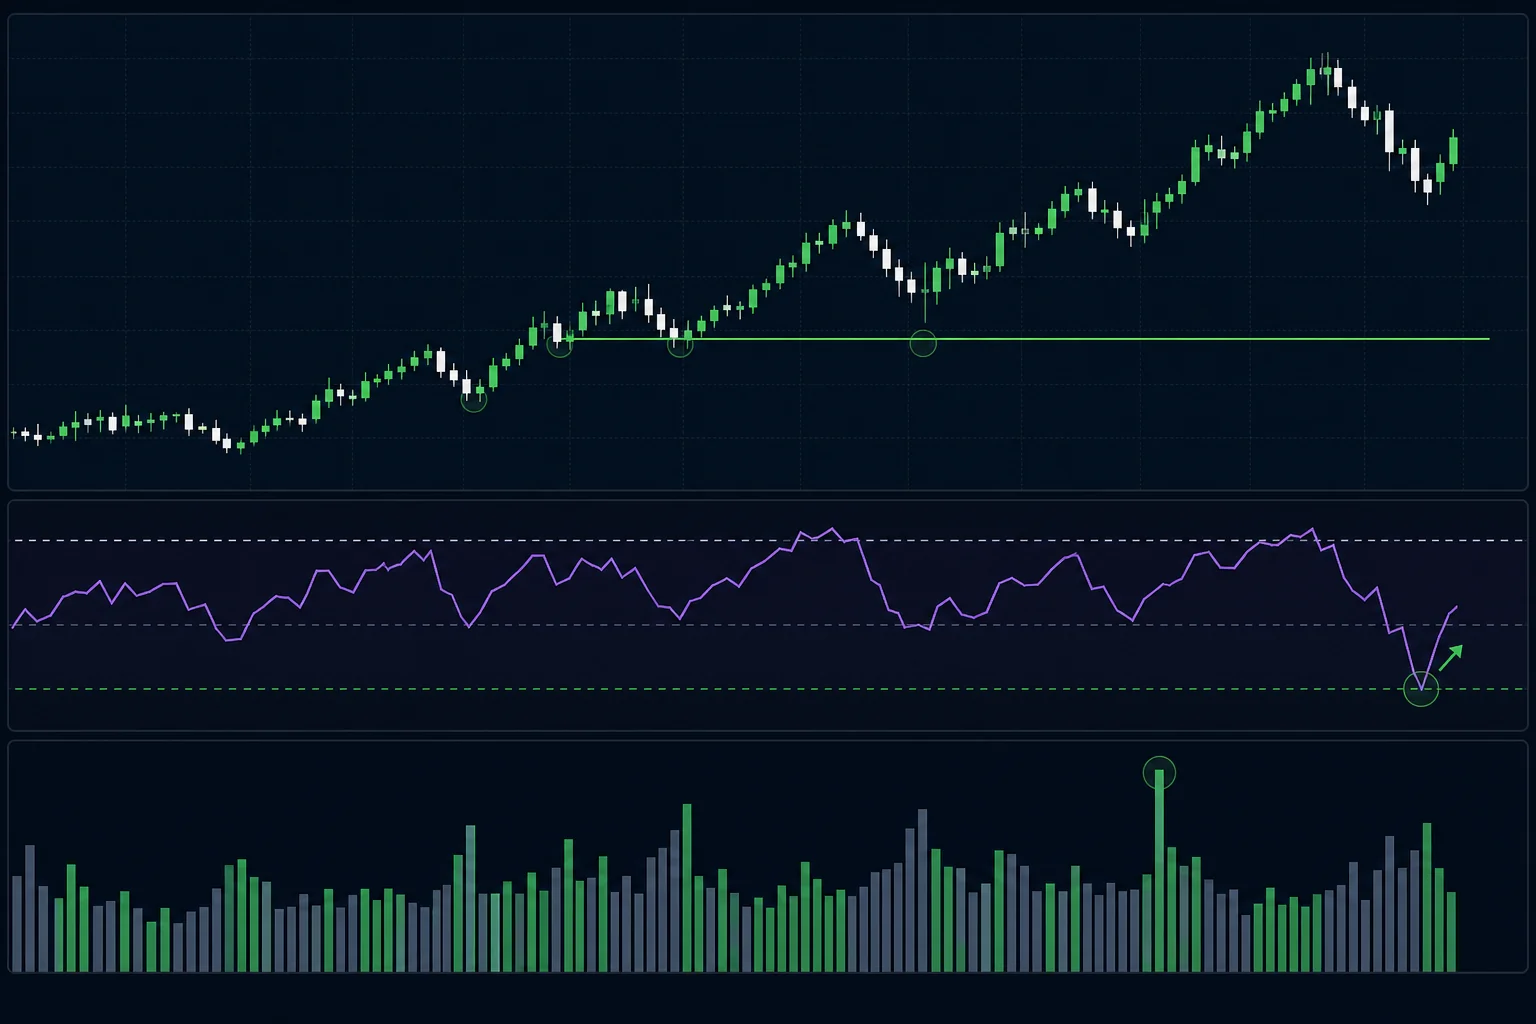
The RSI oversold bounce setup has two distinct moments. First, RSI falls below 30 — the stock is in a sharp pullback or correction. Second, RSI turns back up and crosses above 30 again. That second moment, the turn, is the actual entry signal. Not the dip. The turn.
For swing traders with a day job, the daily timeframe is the right frame to run this on. A daily RSI reading reflects a full session's worth of price action. You can check it in the evening, plan your entry for the next morning, and set a limit order before you leave for work. No intraday monitoring required. If you want to understand how daily chart setups fit into a broader scanning workflow, the post on daily chart swing trade setups and scanner workflow covers the mechanics in detail.
2. The Trap: Oversold Is Not a Buy Signal
Here's the thing most RSI tutorials skip: a stock can stay below RSI 30 for weeks. In a genuine downtrend, every bounce attempt gets sold. The RSI oscillates between 20 and 40 while the price makes lower lows. Buying every dip below 30 in that environment is not a strategy, it's a series of losses.
The classic mistake is treating the indicator reading as the signal. RSI below 30 tells you the stock has sold off hard. It does not tell you the selling is over. A stock in free fall after an earnings miss, a sector rotation, or a macro shock can look "oversold" for a long time before it finds a real floor.
This is why raw RSI readings, without context, have weak edge. The setup becomes meaningful only when you add filters that answer one question: is this a pullback in an uptrend, or is this a stock that's breaking down? Those are two completely different situations, and RSI alone cannot tell them apart.
Oversold means the stock has sold off hard. It does not mean the selling is over. The filter layer is what separates a setup from a guess.
3. The Filters That Turn Oversold Into an Edge
Four filters, applied together, shift the RSI oversold bounce from a coin flip into a setup with a documented historical edge. None of them is complicated. All of them are checkable on a daily chart in under two minutes.
Filter 1: Uptrend Context
The bounce works best when the stock is in an established uptrend on the daily chart. Look for a pattern of higher highs and higher lows over the prior two to three months. The RSI dip below 30 is then a pullback within that trend, not the beginning of a new downtrend. Buyers who missed the earlier move are often waiting at these levels, which is what creates the bounce.
If the stock has been making lower highs and lower lows for months, skip it. The RSI reading is the same, but the context is completely different.
Filter 2: Prior Support Level
The RSI dip should coincide with the price reaching a known support zone. That could be a prior swing low, a round number, a moving average that has acted as support before, or a multi-week consolidation base. When price hits a level where buyers have stepped in before, and RSI simultaneously reaches oversold, the two signals reinforce each other.
Support without RSI confirmation is weaker. RSI confirmation without support is weaker. Together, they're a meaningful setup.
Filter 3: Volume Pickup on the Turn
Watch the volume bar on the day RSI curls back above 30. A genuine bounce often comes with a noticeable increase in volume, buyers stepping in with conviction. A bounce on thin volume is more likely to fail. This doesn't need to be a dramatic volume spike; a meaningful uptick relative to the prior few sessions is enough to confirm that the move has participation behind it. For a deeper look at how volume confirms setups, the guide on using RVOL and volume spikes is worth reading alongside this one.
Filter 4: Daily Timeframe
This one is less about signal quality and more about practicality. Daily RSI readings are stable. They don't whipsaw every 15 minutes. You can check them at 7 PM, plan your trade, and act on it the next morning. For a trader with a full-time job, the daily timeframe is the only one that gives you enough time to think and act without needing to monitor the market intraday.
Intraday RSI bounces on the 5-minute or 15-minute chart are real setups too, but they require you to be watching. The daily chart is where the day-job trader has a structural advantage: you can plan the trade the night before and let a limit order do the work.
4. How to Find RSI Oversold Bounce Setups Without Manual Scanning
Applying four filters manually across hundreds of stocks every evening is not realistic. You'd spend an hour scrolling through charts, and you'd still miss names that triggered during the trading day while you were at work.
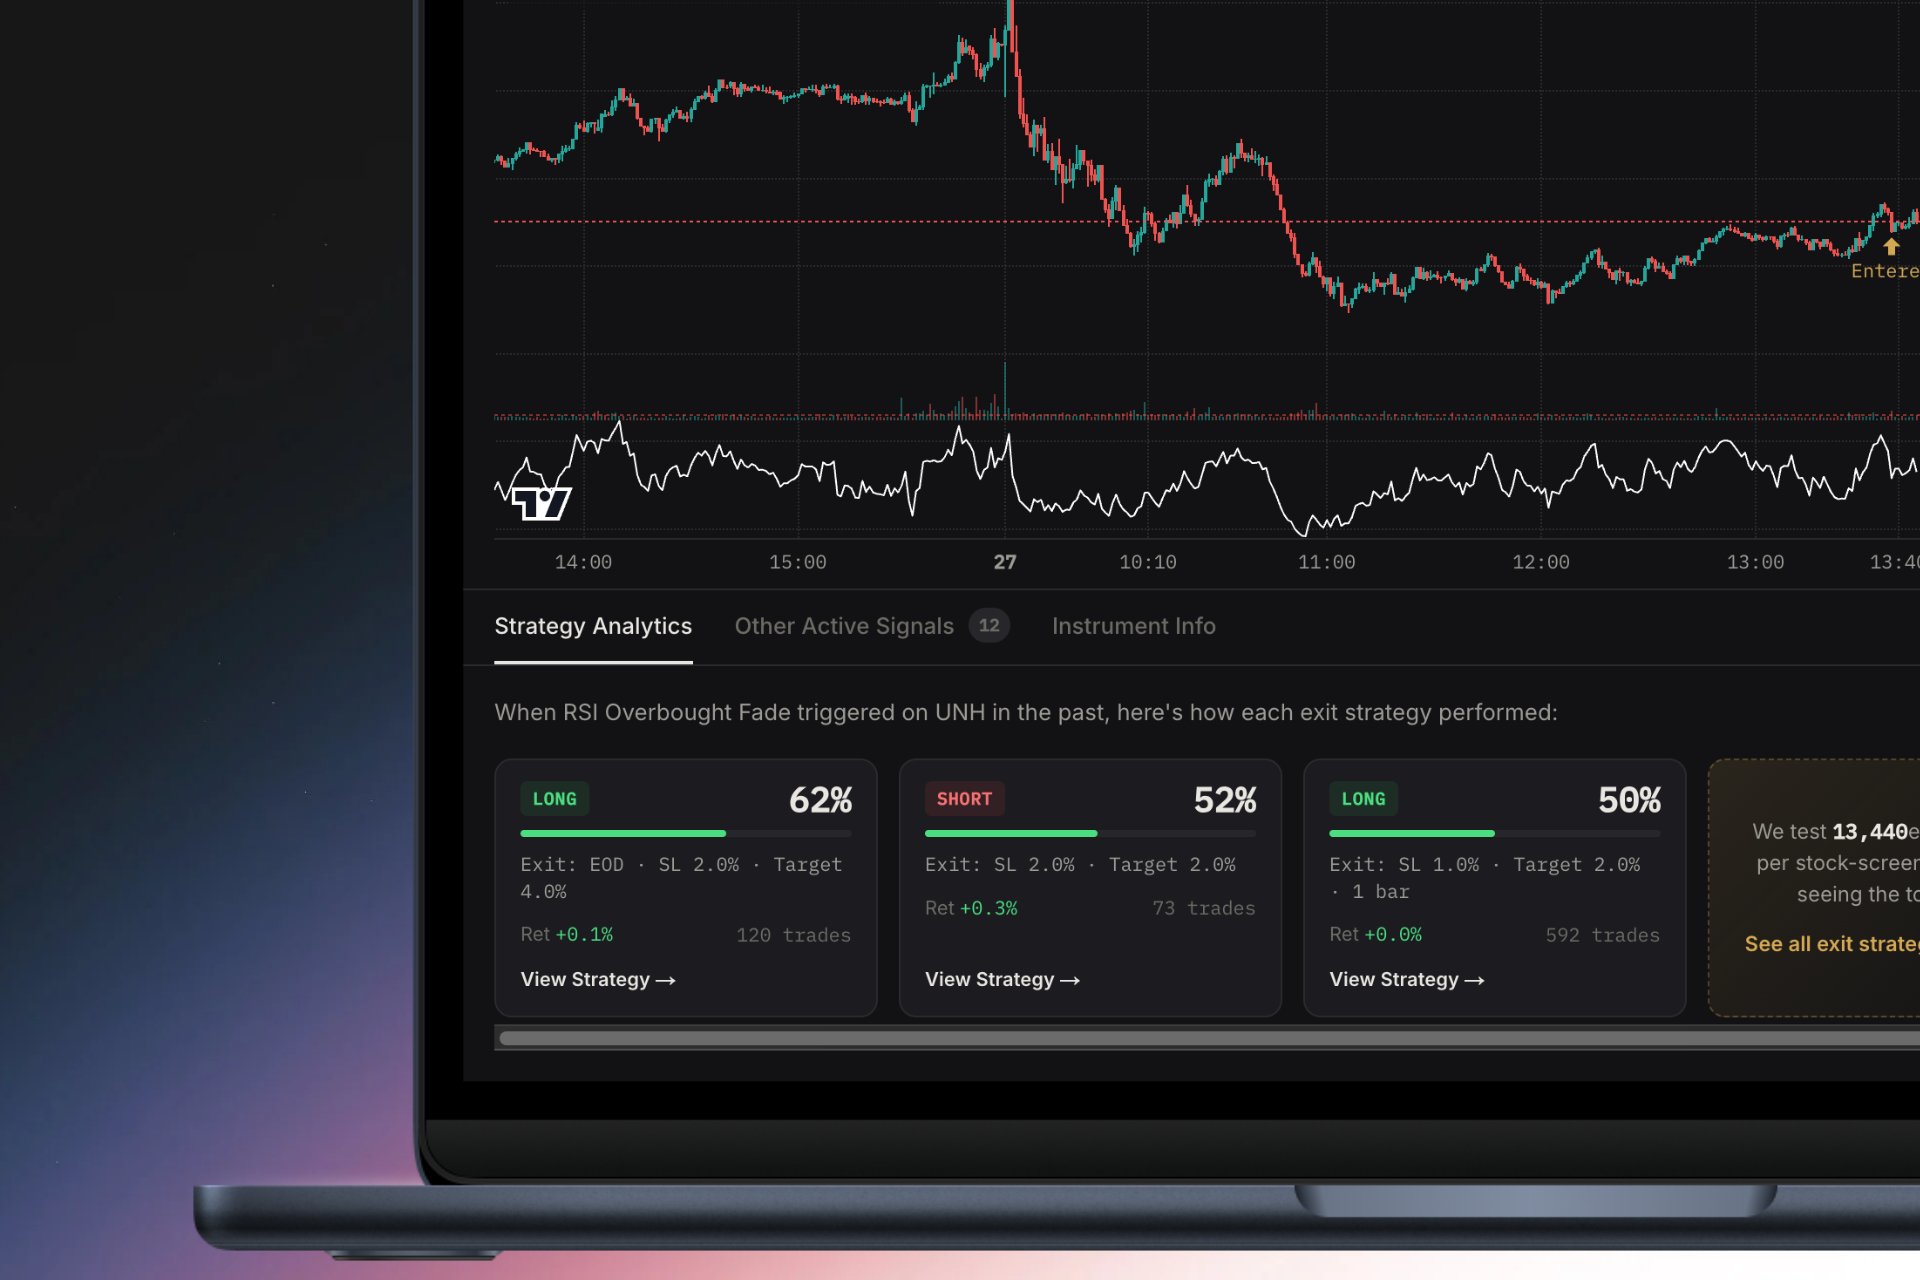
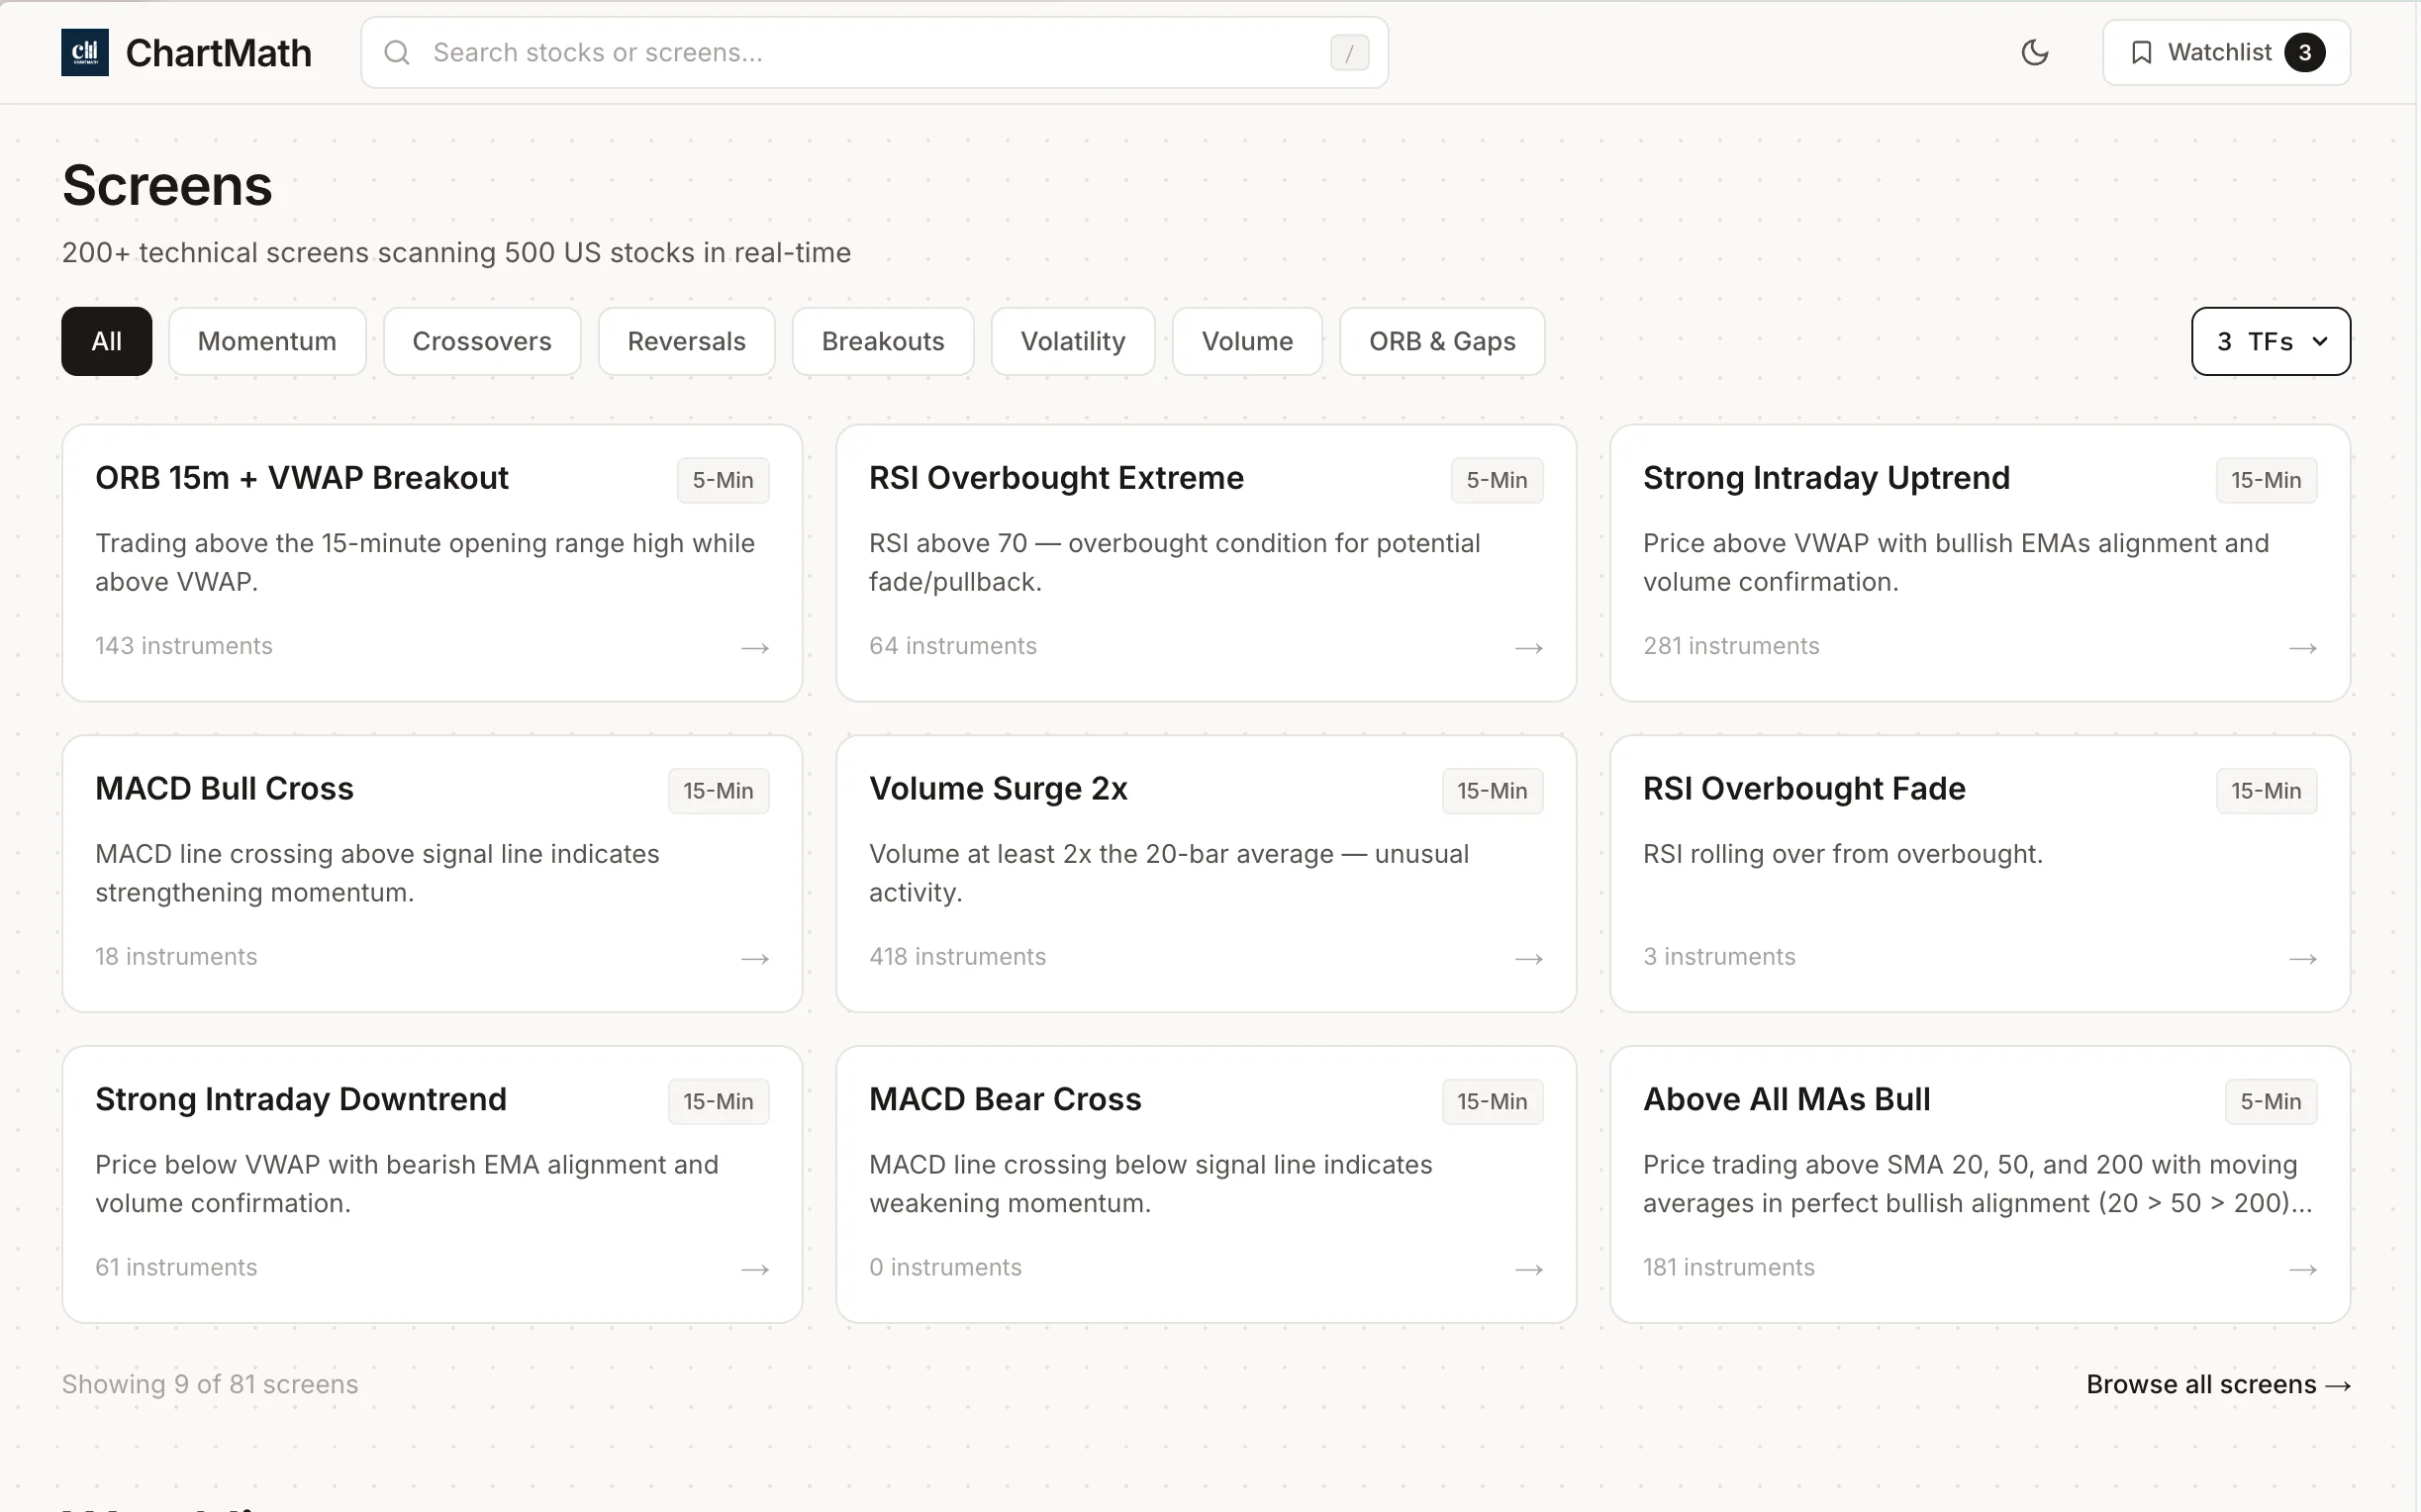
ChartMath runs a backtested RSI Oversold Bounce screen across its universe of 500+ US equities, scanning continuously across 7 timeframes from 1-minute to monthly. When a ticker meets the screen's criteria, it surfaces in the Discover feed with a plain-English explanation of why it triggered, not just "RSI oversold" but the specific context that made the screen fire.
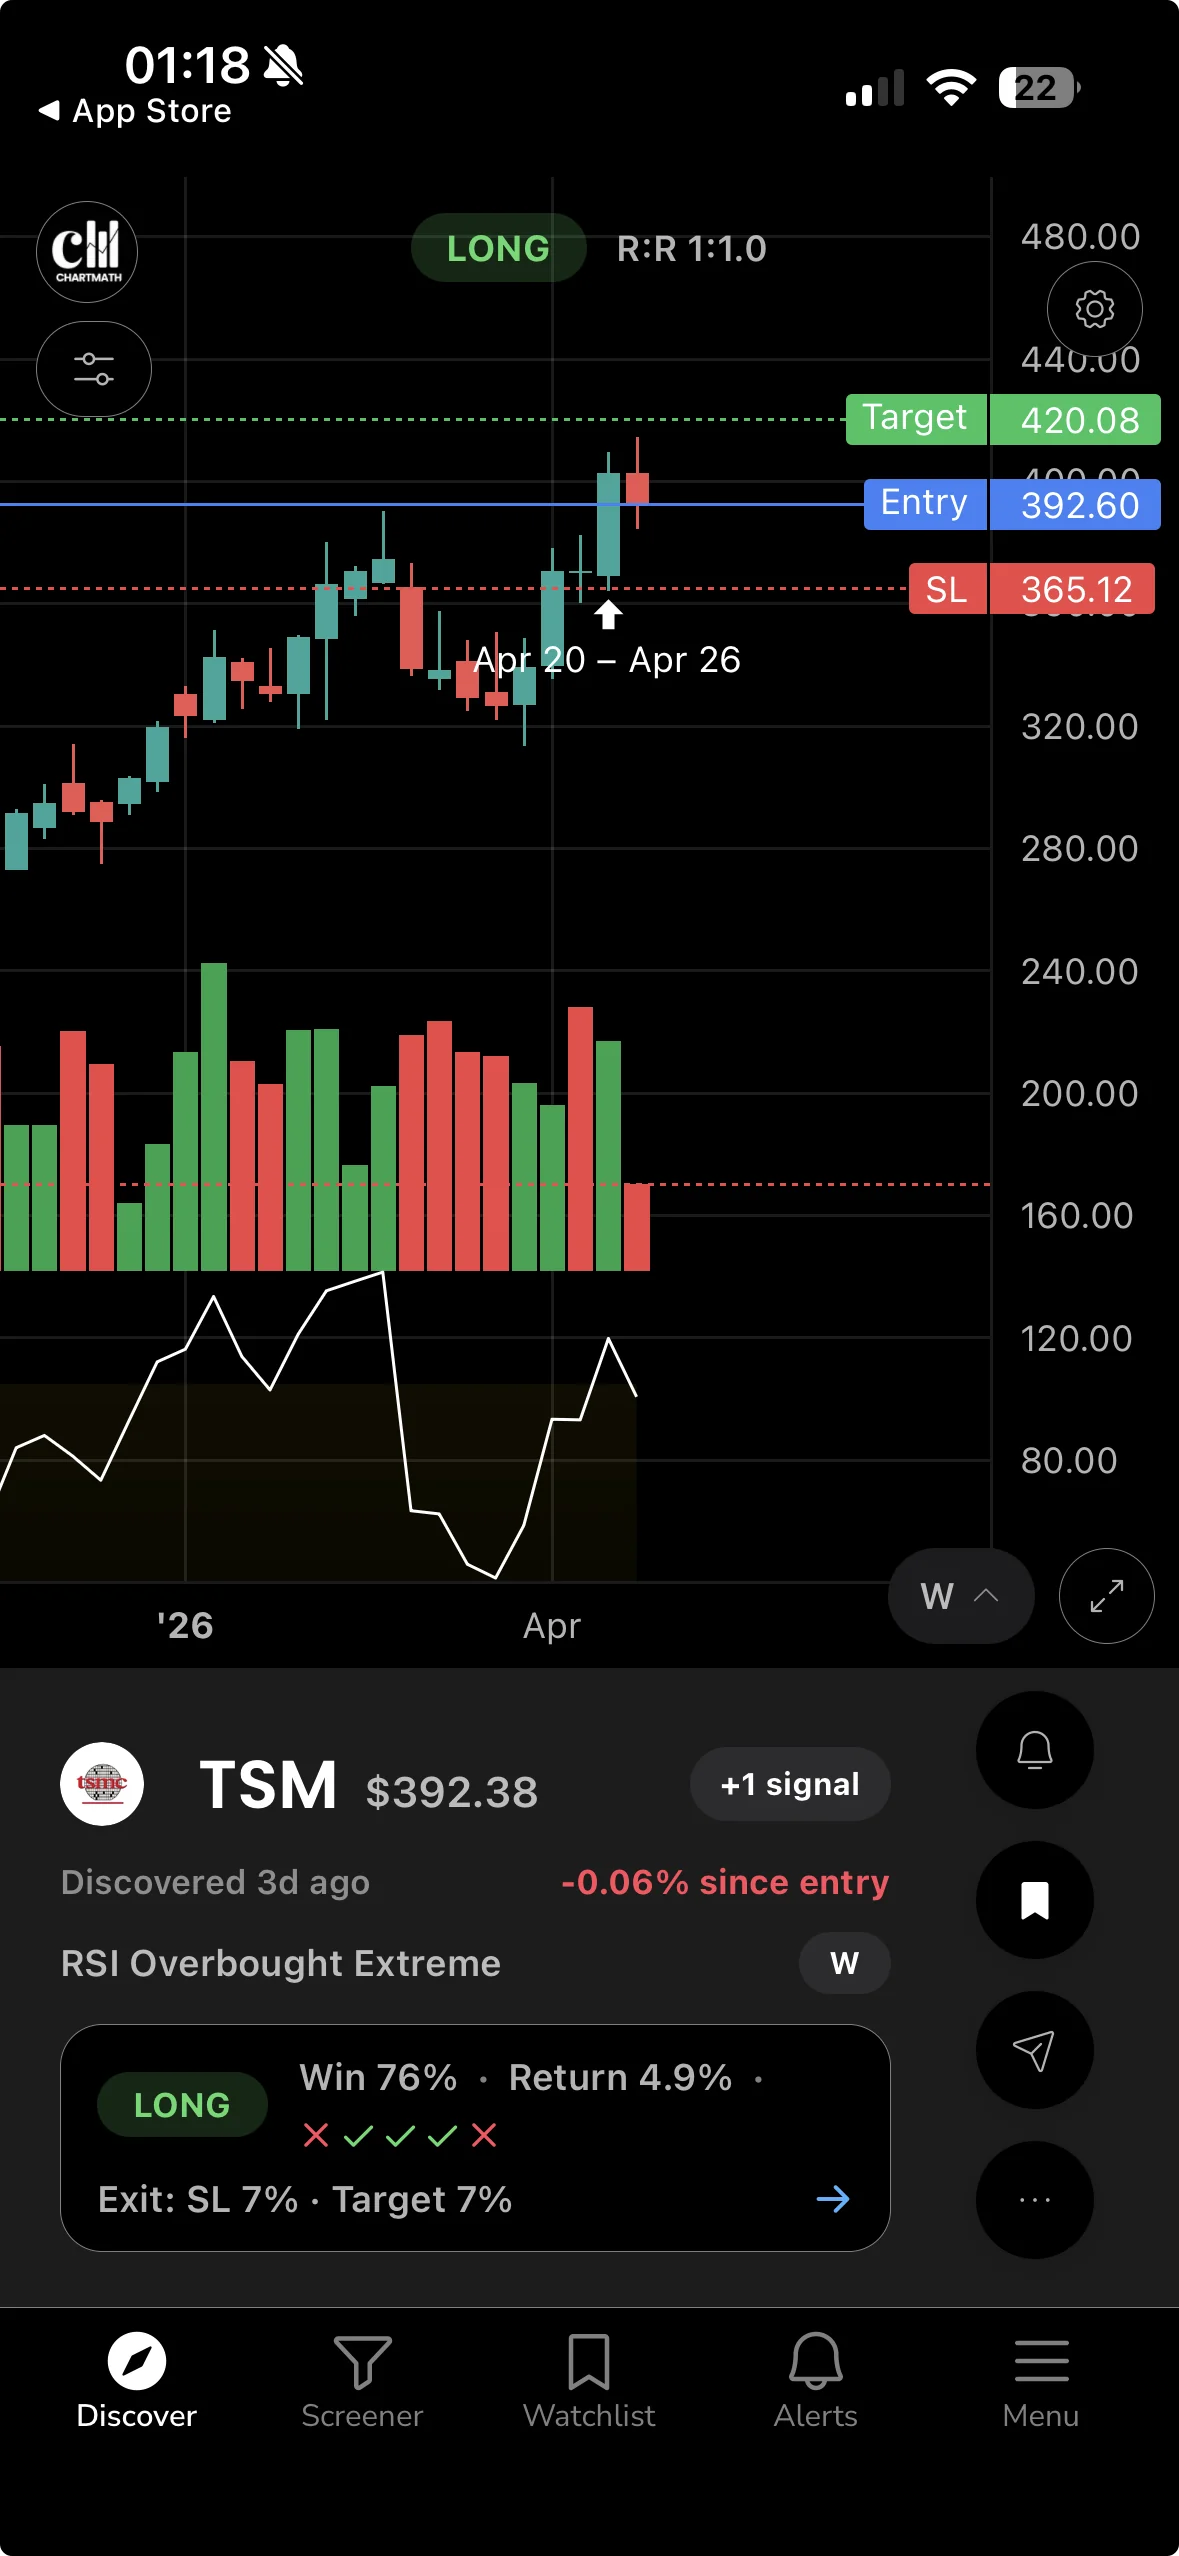
The Discover feed is a swipe-based card interface. Each card shows the symbol, the screen name, the timeframe, and the key metrics: Win Rate and Average Return from the screen's backtest history. You can see the edge before you decide whether to look further. That's a fundamentally different experience from a static screener that hands you a list of tickers with no context about whether the setup has historically worked.
Alerts go out via push notification and email the moment a ticker enters the screen. If a stock triggers the RSI Oversold Bounce screen at 11:30 AM on a Tuesday, you get a push alert on your phone. You can glance at it during a break, note the name, and do your full review that evening. You don't need to be watching the market to know something happened. For more on how this alert workflow fits into a broader trading system, the post on trading stocks without watching the screen all day covers the full picture.
The web-based screener at chartmath.com/screens lets you browse all 200+ curated technical screens, including RSI-based setups, without signing in. It's a useful starting point if you want to see what screens are available before downloading the app.
5. Reading the Backtest Card: What the Numbers Mean
Every screen in ChartMath ships with a backtest card. Understanding what those numbers actually mean, and what they don't, is the difference between using the data well and being misled by it.
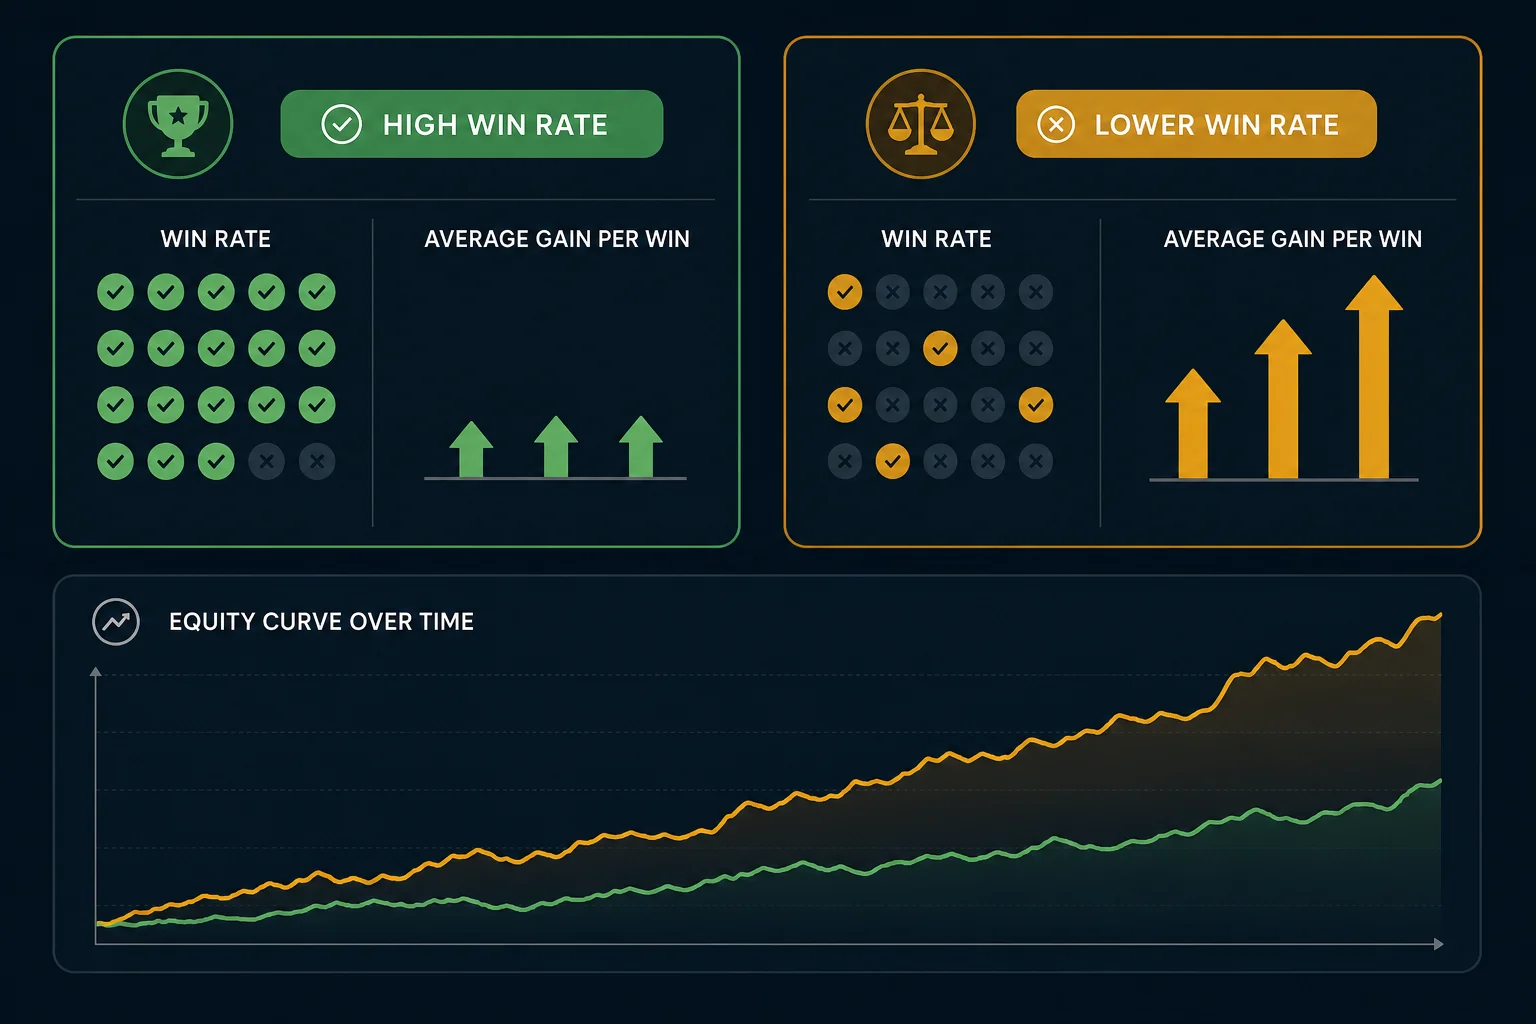
Win Rate and Average Return
Win Rate is the percentage of historical instances where the setup produced a positive return over the measured holding period. A 60% win rate means 6 out of 10 historical occurrences were profitable. Average Return is the mean return across all instances, wins and losses combined. Both numbers together give you a sense of the setup's edge. A high win rate with a low average return is a different risk profile than a moderate win rate with a high average return.
Neither number tells you what will happen on the next trade. They tell you what happened historically, across a defined sample, under specific entry and exit conditions. That's useful information. It's not a guarantee.
Sample Size Is the Sanity Check
A 70% win rate on 12 historical trades is noise. A 70% win rate on 200+ historical trades is signal. Always check the sample size alongside the win rate. Small samples produce extreme-looking statistics by chance. ChartMath shows the sample size on every backtest card precisely because it's the number that tells you how much weight to give the win rate.
If you want a deeper understanding of how to interpret backtest win rates and what sample sizes are meaningful, the post on building winning backtesting strategies goes into the methodology in detail.
The Honest Framing
ChartMath's backtests use bar-close entries with no look-ahead bias. That means the entry price is the closing price of the bar on which the signal fired, not an idealized intraday price. This is a more conservative and realistic assumption than many retail backtesting tools use.
What the backtests do not model: commissions, slippage, or spread. In practice, your actual returns will be slightly lower than the backtest average because of these transaction costs. For liquid large-cap US equities, the difference is small. For thinly traded names, it can be meaningful. Factor that in when you evaluate a setup.
The backtest is evidence of historical edge. It is not a prediction. Treat it the way a good poker player treats pot odds: useful information that improves your decision-making over many trades, not a guarantee on any single hand.
6. Copilot, Not Autopilot: Your Confirmation Step
ChartMath surfaces the setup. You confirm it. That's the workflow, and the distinction matters.
When you get an RSI Oversold Bounce alert, the next step is to open the stock on your own charting platform and spend two to three minutes checking the four filters manually. Is the stock in an uptrend on the daily? Is the RSI dip landing near a prior support level? Did volume pick up on the turn? If all three check out, you have a setup worth sizing into. If one of them is missing, you can pass without guilt, the screen did its job by surfacing the candidate; your judgment does the final filter.
ChartMath has no broker connection and does not place orders. You execute in your own brokerage account, using whatever platform you already use. This is intentional. The app is a research and discovery tool, not an execution layer. You stay in control of every trade decision. For traders building out a full workflow around this kind of tool, the guide on building an efficient trading workflow in 2026 is a practical companion.
Setting Your Stop
For the RSI oversold bounce, the natural stop placement is below the support level that triggered the bounce. If the stock pulled back to a prior swing low at $47.50 and RSI bounced from there, your stop goes below $47.50, typically a few percent below to avoid being stopped out by normal noise. If price breaks that level convincingly, the thesis is wrong and you want to be out.
The After-Hours Review
The practical workflow for a day-job trader looks like this: you get a push alert during the day, note the ticker, and do your full review that evening. Pull up the daily chart, check the four filters, look at the backtest card in the app, decide on your entry price and stop level, and set a limit order for the next morning. The whole process takes 10 to 15 minutes per name. You're not reacting in real time, you're making a deliberate, planned decision with full information.
7. Position Sizing and Risk Management for the RSI Bounce
The RSI oversold bounce is a probabilistic setup. Even with all four filters in place, some trades will lose. Position sizing is how you make sure the losses are manageable and the wins compound over time.
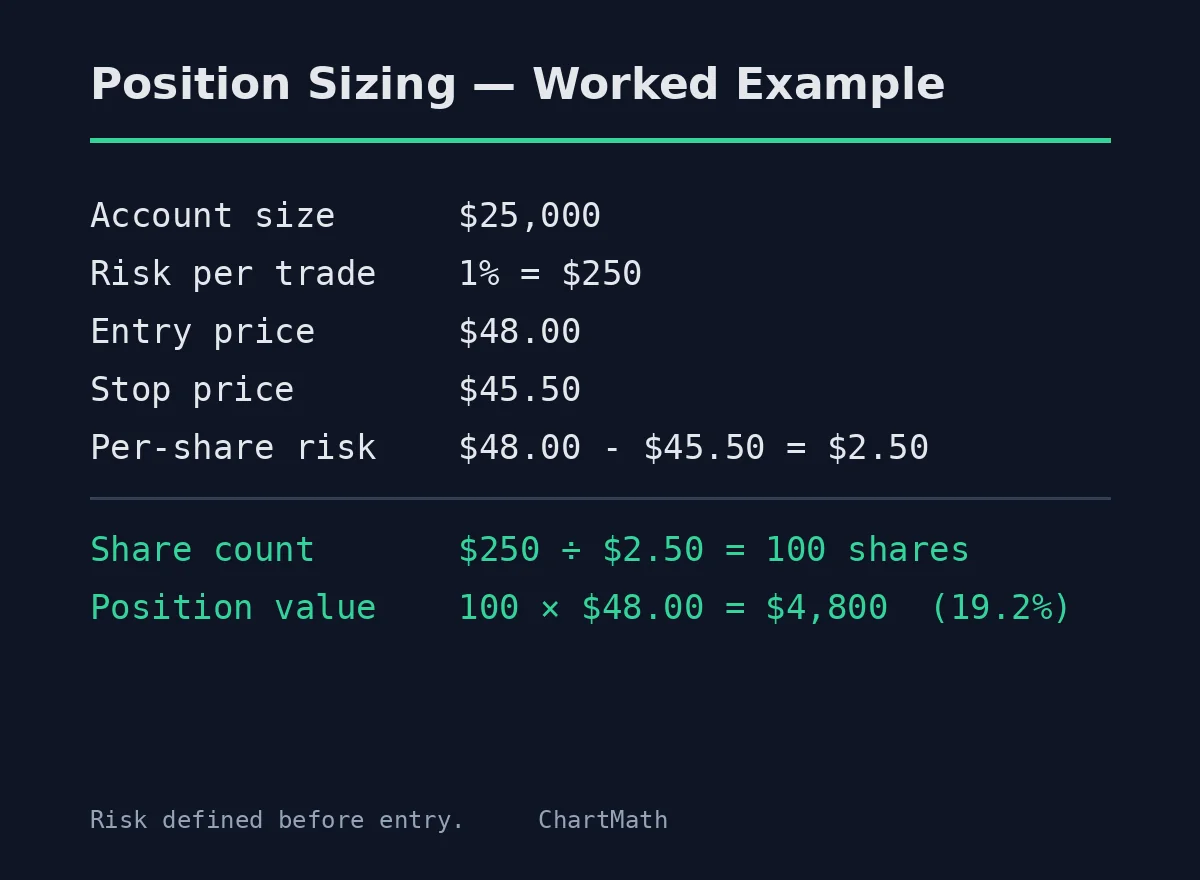
The standard framework for swing traders is to risk a fixed percentage of your account on each trade, typically 1% to 2%. That means if your stop is $2.50 below your entry, you size the position so that a full stop-out costs you no more than 1-2% of your total capital. This keeps any single loss from doing serious damage to your account, and it keeps your position sizes consistent regardless of the stock's price.
For the RSI bounce specifically, your target should be at least a 2:1 reward-to-risk ratio. If you're risking $2.50 per share, you're looking for a move of at least $5.00 to the upside. The natural target is the prior resistance level, the high the stock made before the pullback that triggered the oversold reading. That's where sellers who bought earlier will be looking to exit, and it's a reasonable place to take partial or full profits.
Position sizing is the variable you control when the edge is probabilistic. You can't control whether any individual trade wins. You can control how much you lose when it doesn't. The post on swing trading with a full-time job covers the full risk management framework in more depth if you want to build this into a complete system.
8. Putting It Together: A Day-Job Trader's RSI Bounce Workflow
The setup is only as good as the system around it. Here's how a day-job trader can run the RSI oversold bounce as a repeatable process without it consuming your evenings.
Evening Prep (15 Minutes)
Open the ChartMath Discover feed. Filter for RSI-related screens on the daily timeframe. Review any cards that fired during the day. For each one, open the stock on your charting platform, run through the four filters, and decide whether it's worth adding to your watchlist. If it passes, note your entry price, stop level, and target. Set your limit order before you go to bed.
Pre-Market (5 Minutes)
Check whether any of your planned entries are still valid given overnight news or pre-market price action. Adjust limit orders if needed. This is a quick sanity check, not a full analysis session.
During the Day
Your limit orders are working. If a new RSI bounce alert fires, you'll get a push notification. Glance at it during a break. If it looks interesting, add it to your evening review list. You don't need to act immediately on daily chart setups, the signal is valid for the full session and often into the next day.
End of Day (5 Minutes)
Check your open positions. If any have moved significantly, consider adjusting your stop to lock in gains. Review any new alerts that came in during the day and add them to your evening prep list.
The total active time is under 30 minutes on most days. The scanning, the filtering, and the alerting happen automatically. You spend your time on the decisions that require human judgment: confirming the setup, sizing the position, and managing the trade.
Frequently Asked Questions
What RSI level signals the bounce?
The conventional threshold is 30. RSI falling below 30 marks the oversold condition; RSI turning back above 30 is the entry trigger. Some traders use 35 as a slightly earlier entry, but 30 is the standard level with the most historical data behind it.
Does the RSI oversold bounce work on all timeframes?
The setup exists on every timeframe, but the daily chart is the most practical for swing traders with a day job. Intraday RSI bounces on the 5-minute or 15-minute chart require real-time monitoring. The daily timeframe gives you time to plan and act without being at your screen during market hours.
How many filters do I need before entering?
All four: uptrend context, prior support level, volume confirmation, and daily timeframe. Skipping any one of them meaningfully reduces the setup's historical edge. The filters are not optional extras, they're what separates the setup from a random oversold reading.
What's the difference between ChartMath and just setting an RSI alert on TradingView?
A TradingView RSI alert fires when RSI crosses a level. It doesn't apply the filter layer, it doesn't show you the historical Win Rate and Average Return for that specific screen, and it doesn't explain in plain English why the signal fired. ChartMath's RSI Oversold Bounce screen is a pre-built, backtested setup that applies the full criteria and shows you the historical edge before you decide to act. The difference is between a raw data alert and a validated, explainable setup.
Is ChartMath free?
ChartMath starts with a 14-day free trial — every screen, every backtest, every alert, no card to start. After the trial, founding pricing is $24.99/mo (locked for your first 12 months) or $149/yr. You can download the app on iOS or Android, or browse the screen library at chartmath.com/screens without signing in.
Start Finding RSI Bounce Setups Tonight
The RSI oversold bounce is one of the cleaner swing trading setups available to a trader who can't watch the market intraday, precisely because the daily timeframe gives you time to plan. The edge comes from the filter layer, not the RSI reading alone. And the filter layer is most useful when it's applied automatically, across a broad universe, while you're doing something else.
ChartMath runs the RSI Oversold Bounce screen across 500+ US equities continuously, pushes an alert the moment a name triggers, and shows you the historical Win Rate and Average Return so you can evaluate the edge before you commit capital. It's a copilot, not an autopilot, you make every decision and execute in your own broker. But the scanning, the filtering, and the alerting happen without you.
If you want to see what the setup looks like in practice, the web-based screen library is free to browse without an account. To get push alerts when RSI bounce setups trigger during the trading day, download the ChartMath app on iOS or Android — a 14-day free trial, no card required to start.

Ankush Jindal
LinkedInSee these setups live in ChartMath
200+ curated screens with backtest data. 14-day free trial.