MACD Bull Cross: Test It Before You Trade It
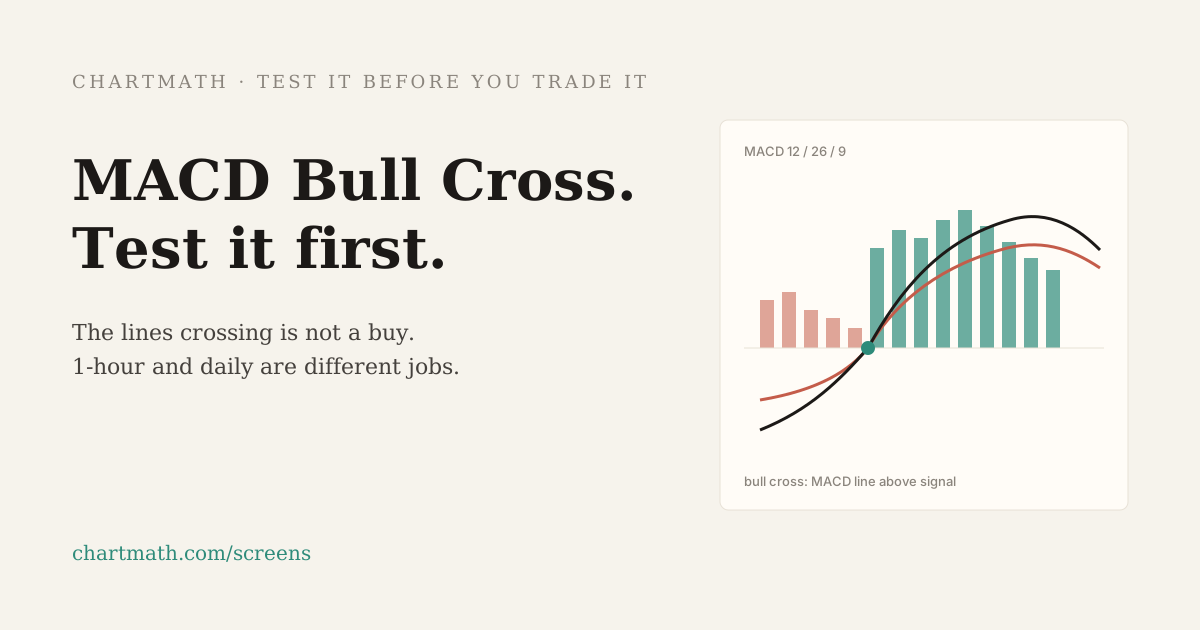
A MACD bull cross is two lines swapping places. It looks like a buy. It is not a buy until you freeze the rule, pick one timeframe, and read the backtest on that timeframe. Whether the cross makes money depends on the trend around it, the stop you attach, and how many times the rule actually fired, not on how clean the arrow looks.
Key Takeaways
- The cross is a lagging confirmation. MACD is moving averages of moving averages. By the time the lines cross, part of the move has usually already happened.
- Chop prints MACD crosses for free. In a range the two lines weave through each other. You can collect a dozen "bull crosses" that never trend.
- A green histogram bar after a red one is a screenshot, not a system. A system states the MACD settings, the timeframe, the confirmation, the stop, and the exit.
- A 1-hour MACD bull cross is an intraday momentum check. A daily cross is a swing-bias change. Do not average their win rates.
- A 58% win rate on 12 trades is a story. A 52% win rate on 200 trades with a positive expectancy is a number you can use.
MACD Bull Cross At a Glance
| Element | What It Means |
|---|---|
| The signal | MACD line (12/26 EMA difference) crosses above the 9-period signal line, and the bar closes that way |
| What it claims | Short-term momentum has turned up relative to the recent MACD trend |
| What it does not claim | That price will keep going, that the stock is cheap, or that the next bar is a buy |
| Default settings | 12, 26, 9 on the chart you actually trade, not a mix of timeframes |
| Worst habitat | Tight ranges and low ATR, where the lines cross because nothing is happening |
| Better habitat | A stock already above a longer trend filter, with enough volatility that a stop can sit somewhere real |
| What to read before trading it | Win rate, average return, profit factor, max drawdown, and trade count on that exact timeframe |
| Minimum sample | Treat fewer than about 30 trades as inconclusive; prefer more than one market regime |
What a MACD Bull Cross Actually Is
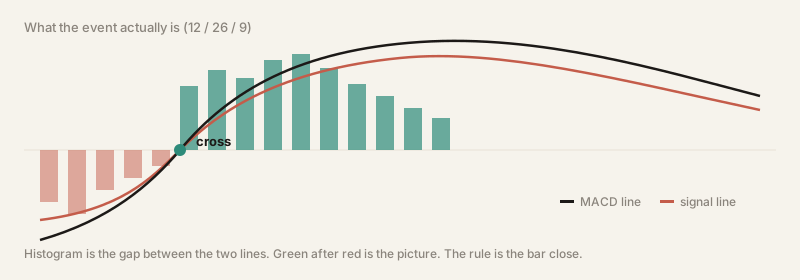
MACD is the difference between a fast EMA and a slow EMA, usually 12 and 26. That difference is the MACD line. A 9-period EMA of the MACD line is the signal line. A MACD bullish crossover is just this: the MACD line prints above the signal line on this bar, after being at or below it on the prior bar. The histogram is that gap, drawn as bars so the cross is easier to see.
That is the entire mechanic. There is no hidden intelligence in the default 12/26/9. Those numbers are a convention Gerald Appel published decades ago. They survived because they are easy to remember, not because they were fitted to your watchlist in 2026.
Because both lines are smoothed, the cross is late on purpose. You wait for momentum to confirm, and you pay for that confirmation by missing the first part of the move. Whether that trade-off is worth it is a measurement, not a personality.
A bear cross is the mirror image and should be tested as its own rule. Do not assume the short side of MACD is the long side with the sign flipped. Liquidity, drift, and how shorts actually get filled are different jobs.
Why the Cross Looks Better Than It Trades
MACD is on every default chart layout, which is why it shows up in every "top 5 indicators" thread. The bull cross is visually clean: two lines, one event, an obvious arrow. Clean and profitable are not the same variable.
Three things inflate how good it looks in hindsight. First, people mark the crosses that started trends and ignore the ones that died in three bars. Second, they mix timeframes. A daily cross on a stock that then ran for two weeks gets credited to a 15-minute MACD the trader was also watching. Third, they change the stop after the fact. "I would have held" is not a backtest.
If you cannot write the rule in one paragraph, you cannot measure it. "MACD bull cross, then I wait to see if it feels strong" is not a rule.
1. Freeze the Rule Before You Touch a Chart
Write the definition down before you look at a single ticker. A usable version looks like this:
- Universe: a fixed list (liquid US equities, or NSE cash), not whatever you happened to have open.
- Timeframe: one. 1-hour or daily for a day-job swing trader. Not "1-hour unless the 5-minute also agrees," unless you are willing to test that extra filter as its own screen.
- Entry: MACD (12, 26, 9) line crosses above the signal line, and the bar closes that way. Intrabar wiggles do not count.
- Optional confirmation: one filter you can compute, such as price above the 50-day EMA, or 20-day average volume above a floor. Add filters one at a time later. Do not stack five on day one.
- Stop: a fixed rule. Below the signal bar's low, or 1.5× ATR(14) under entry. Pick one.
- Exit: a target (2× risk), a time stop (8 bars), a trail, or a MACD bear cross. Pick one primary exit so the backtest is readable.
If two traders cannot take this paragraph and mark the same bars, the rule is still mush. Fix the mush before you argue about the win rate.
2. Run the Backtest and Read the Ugly Numbers Too
A MACD crossover strategy should be scored like any other screen. Look at these together, never one in isolation:
- Win rate: percent of trades that closed green under your exit rule. Useful, incomplete.
- Average return: what a typical win and a typical loss actually paid. A 60% win rate with tiny wins and fat losses is a losing system.
- Profit factor: gross profits divided by gross losses. Under 1.0, the screen lost money in sample, period.
- Max drawdown: the worst peak-to-trough on the equity curve. This is what it feels like to trade it for real.
- Sample size: trade count, not calendar days. 40 trades in a raging bull is not the same as 40 trades through a choppy year.
- Last computed at: a timestamp. If the number can be edited after the fact, it is marketing.
Do not average 5-minute, 1-hour, and daily results into one "MACD win rate." They are different games. ChartMath keeps them as separate screens for that reason: MACD Bull Cross 1h and MACD Bull Cross daily are not the same object. Open either and the frozen backtest sits next to the chart, on the same universe the rest of the library uses. Anyone can recompute it.
3. Timeframe by Timeframe
On a 5-minute chart, MACD crosses often. Many are noise around VWAP. If you day trade them, you need a session plan, a hard stop, and a way to sit on your hands after two losers. Most people with a day job should not start here.
On the 1-hour chart, you get fewer crosses and they last longer. This is the version that can fit a lunch check and an after-close review. It still fails in ranges. A 1-hour bull cross inside a three-week rectangle is not a new trend. It is MACD noticing that the last 12 bars were slightly greener than the last 26.
On the daily chart, a MACD bull cross is a swing-bias change. You might get a handful per name per year. That is a feature. You have time to size the trade after work. The cost is lag: daily MACD will not get you in the first two days of a breakout. If that bothers you, you are asking MACD to do a breakout's job. Use a breakout screen for that, and test it the same way. The 20-day high breakout piece is the sibling writeup for that job.
4. Filters That Change the Distribution
Raw MACD bull crosses are a noisy set. Filters do not magically create edge. They throw away trades. The question is whether the trades you throw away were the losers.
- Trend filter: only take the cross if price is above a slower average (50 EMA, 100 EMA). This cuts the mean-reversion crosses that fire at the bottom of a range and then fail.
- Volatility floor: skip names where ATR is tiny relative to price. MACD will still cross. Your stop will be noise-width.
- Volume: require the signal bar, or the prior 5 bars, to show above-average volume. Weak volume crosses in dead names are cheap to generate and expensive to sit in.
- Histogram confirmation: some traders wait for the histogram to print a second higher bar after the cross. That is a later entry. Test it as a different rule, with its own sample, not as a vibes add-on.
Add one filter, recompute, look at win rate and trade count. If you take the sample from 400 trades to 18, you did not find a better screen. You found a small anecdote with nicer bars.
The 9/20 EMA cross has the same chop problem. If you already tested that one, you already know the move: define the rule, then read the numbers. MACD is not a personality upgrade on EMAs. It is EMAs, rearranged.
5. Judge It by Sample, Not the Last Chart You Liked
A MACD bull cross on NVDA in a tape that only went up is not evidence. It is a souvenir. You need enough trades that one name, one month, or one Fed week cannot dominate the average.
A practical bar, not a law of nature: fewer than about 30 trades, you do not know. Across only one regime (straight bull, or straight chop), you also do not know. Paper trade the exact rule on a watchlist before the size is real. If you cannot follow the stop on fake money, you will not follow it on a name you believe in.
For how to fold that checking into a short daily loop, read swing trading with a full-time job. The screen should fit the calendar you actually have.
MACD Bull Cross Rules Recap
- Write the MACD settings, timeframe, entry, stop, and exit in one paragraph before you look at charts.
- Test one timeframe at a time. Never blend 5-minute, 1-hour, and daily into one win rate.
- Read win rate with average return, profit factor, drawdown, and trade count.
- Add at most one confirmation filter per test, and check what it does to sample size.
- Treat a bear cross as a separate screen, not the inverse of the bull cross.
- Paper trade the frozen rule before it is real size.
Run It On Your Own Ticker
The fastest way to stop guessing about a MACD bull cross is to read its documented history on the timeframe you will actually trade, then watch it fire on a name you already follow. ChartMath's MACD Bull Cross screens on the 1-hour and daily keep the rule and the backtest on the same page, against a frozen universe, with a timestamp.
When you want that on a watchlist with a simulated order, stop, and target filled in, open the ChartMath app. The cross is not a bad signal. For most people who trade it, it is an unmeasured one. Measure it, then decide.
Frequently asked questions
Is a MACD bull cross a buy signal?
No. It is two lines swapping places: the MACD line (12 minus 26 EMA) closing above its 9-period signal line. Whether that event has edge depends on the timeframe, the stop, and the sample. Read the backtest on that exact rule before you size it.
Should I use the same MACD settings on every timeframe?
Use 12, 26, 9 if you want to compare against the default that everyone else quotes. Then test one timeframe at a time. A 1-hour cross and a daily cross are different jobs. Do not average their win rates.
How many trades is enough to trust a MACD backtest?
Treat fewer than about 30 trades as inconclusive. Prefer a sample that spans more than one market regime, not a straight bull tape on one name. If a filter drops you from hundreds of trades to a handful, you have an anecdote, not a screen.
Where can I see ChartMath's MACD bull cross screens?
The 1-hour and daily MACD Bull Cross screens keep the frozen rule next to the backtest. Open either from the screens catalog, then paper trade the same setup in the app before it is real size.

See these setups live in ChartMath
200+ curated screens with backtest data. Free. No credit card required.