Learn Trading Setups With a Stock Screener: A Beginner's Method
Most traders spend their first six months doing the same thing: reading a chart patterns textbook, watching YouTube breakdowns of perfect historical setups, and wondering why none of it clicks when they open a real chart. The patterns look different. The context is missing. And the market doesn't wait for you to figure it out.
Here's the thing nobody tells you upfront: pattern recognition is a perceptual skill, not a memorization task. You don't learn it by reading about it. You learn it by seeing hundreds of real examples until your brain starts connecting the shape on the chart to the market behavior that created it. The fastest way to get those reps? Use a stock screener as your teacher — one that surfaces live examples of patterns forming right now, with plain-English explanations of why each one triggered.
This guide walks you through exactly how to do that. We'll cover the four core patterns every beginner should study first (ORB, VWAP, breakout, and momentum), explain the market logic behind each one, and give you a structured 20-minute daily routine that builds real pattern recognition through consistent exposure to live setups.
Why Most Beginners Learn Chart Patterns the Wrong Way
The traditional approach to learning technical analysis goes something like this: buy a book, watch some videos, study a few "textbook perfect" examples, then try to apply what you learned to a live chart. It sounds reasonable. It almost never works.
The problem is that textbook examples are curated. They show you the cleanest possible version of a head-and-shoulders pattern or a bull flag — the one that played out perfectly, with ideal volume, ideal price action, and a tidy resolution. Real markets are messier. Patterns form partially, fail, restart, and sometimes look like three different setups at once before resolving.
Passive study also separates the pattern from its context. You see the shape, but you don't feel the tension of a stock sitting at resistance for three days before breaking out. You don't see the volume dry up before the move, or notice that the broader market was selling off while this one stock held its ground. That context is where the real edge lives.
Active screening flips this entirely. Instead of studying old examples, you're watching patterns form in real time across hundreds of stocks simultaneously. Every alert that fires is a live case study. Every setup that triggers is an opportunity to ask: why did this happen? What does the chart tell me about who's buying and who's selling? What would need to be true for this to follow through?
That's the learning loop that actually builds pattern recognition — and it's the one we're going to build for you here.
What a Stock Screener Actually Teaches You
A stock screener, at its core, is a filter. It scans a fixed universe, in ChartMath's case 500+ US equities, and surfaces only the stocks that match a specific set of conditions. But for a beginner, it's something more useful than that: it's a curated stream of real examples.
When you open a pre-built screen for "VWAP Reclaim" and see five stocks that just triggered it, you're not looking at a hypothetical. You're looking at five real companies, right now, where price just crossed back above the volume-weighted average price on meaningful volume. You can pull up each chart, study what led up to the reclaim, and watch what happens next. That's a learning experience no textbook can replicate.
Pre-built screens are especially valuable for beginners because they remove the chicken-and-egg problem: you don't need to already know what to look for in order to find examples of it. The screen does the pattern identification. Your job is to study the examples it surfaces and build your own understanding of what makes each one work.
The best screeners also explain why an alert triggered, not just that a stock matched a filter, but what the underlying market conditions are. That explanation is the bridge between "I see the pattern" and "I understand why this pattern has an edge." Tools like ChartMath are built around this idea: every alert comes with a plain-English explanation of what triggered it, so you're always learning, not just reacting.
Chart Patterns vs the Setups You Can Actually Screen
Classic chart patterns, such as head and shoulders, triangles, wedges, double tops, and cup and handle, are shapes drawn and judged by eye. Because of this, two traders can look at the same chart and reach different conclusions. ChartMath does not attempt to detect these visual shapes. Instead, it applies deterministic rules across a bounded universe of 500+ US equities, where a condition either fires or it does not, and each screen carries a backtested win rate and average return that can be recomputed independently.
The skill worth developing, then, is not the ability to spot ambiguous shapes on a chart, but the discipline of reading setups that can be verified. Consider real examples such as VWAP Reclaim, ORB 15m Breakout, 20-Day Consolidation Breakout, and Momentum Regime Change Bull. The screener narrows the field to the names that actually meet the rule, and you keep the final call on which ones deserve your capital.
The 4 Core Setups Every Beginner Should Study First
There are dozens of technical patterns you'll eventually learn. But trying to study all of them at once is one of the most common beginner mistakes. Start with four. Get genuinely good at recognizing them in live markets. Then expand.
These four patterns, ORB, VWAP reclaim, breakout, and momentum, are the best starting point because they're well-defined, they have clear market logic behind them, and they show up frequently enough that you'll get plenty of reps.
1. Opening Range Breakout (ORB): The First 15 Minutes Tell a Story
The Opening Range Breakout is one of the most studied intraday setups in technical trading, and one of the most beginner-friendly to understand. The concept is simple: the first 5 to 15 minutes of the trading day establish a price range (a high and a low). When price breaks above that range with conviction, it often signals the direction for the rest of the day.
Why does this work? The market open is when the most information is being processed simultaneously, overnight news, premarket moves, institutional order flow, and retail sentiment all collide in those first few minutes. The opening range captures that initial battle between buyers and sellers. A clean break above the range, especially on elevated volume, suggests that buyers have won that battle and momentum is likely to continue.
What to look for on the chart: a tight, well-defined range in the first 5, 15 minutes, followed by a strong candle that closes above the range high. Volume should be higher than the average for that time of day. The cleaner the range (fewer wicks, less chop), the higher the probability of follow-through.
ChartMath's ORB screen surfaces stocks that are breaking out of their opening range in real time, with RVOL confirmation built in. You can study these setups as they happen, then review them after the close to see how they resolved. For a deeper dive into the strategy itself, see our guide on VWAP vs RVOL vs ORB: Which Technical Indicators Work Best?
2. VWAP Reclaim: When Price Comes Back to the Mean
VWAP (Volume-Weighted Average Price) is the single most important intraday benchmark used by institutional traders. It represents the average price at which a stock has traded throughout the day, weighted by volume. When price is above VWAP, buyers are in control. When it's below, sellers are.
A VWAP reclaim happens when a stock that has been trading below VWAP pushes back above it, and holds. This is a momentum shift signal. It tells you that the sellers who were in control have been absorbed, and buyers are now willing to pay above the average price. When this happens on strong volume, it often leads to a sustained move higher.
The opposite, a VWAP rejection, is equally useful to study. When a stock rallies up to VWAP and gets rejected, it confirms that sellers are still in control and the downtrend is likely to continue. Learning to distinguish between a genuine reclaim and a failed test is one of the most valuable skills you can develop as a technical trader.
ChartMath includes dedicated VWAP screens that flag both reclaims and rejections in real time. Studying these daily sharpens how quickly you read a momentum shift. For a full breakdown of how VWAP works, check out our guide on VWAP Trading: How to Use Volume-Weighted Average Price.
3. Breakout Setups: When Resistance Becomes Support
A breakout occurs when price clears a significant level that has previously acted as resistance, a 52-week high, the top of a multi-week consolidation, a prior earnings gap, or a round number that has rejected price multiple times. When price finally breaks through that level on strong volume, the dynamic flips: what was resistance becomes support, and a new leg higher often begins.
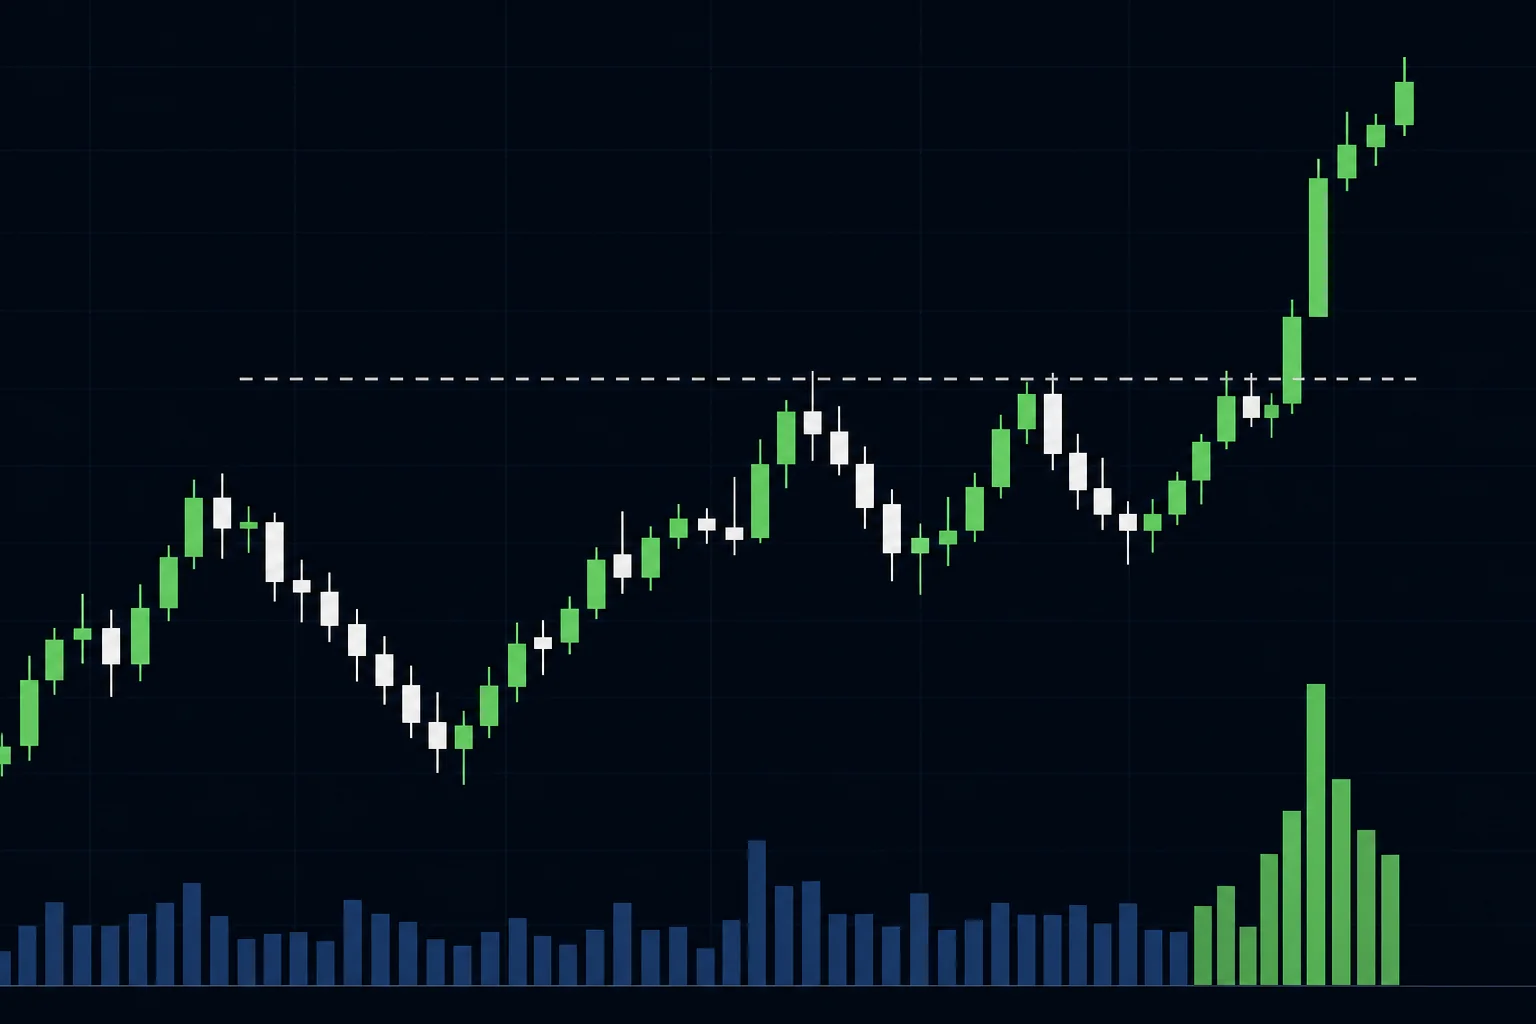
The market logic is straightforward. Every time a stock approaches a resistance level and fails, it creates a group of frustrated buyers who got stopped out or sold too early. When price finally breaks through, those same buyers rush back in, creating a surge of demand. Meanwhile, short sellers who were betting on the resistance holding are forced to cover, adding more buying pressure. The result is often a sharp, sustained move.
Volume is the key confirmation signal. A breakout on low volume is a warning sign, it suggests the move lacks conviction and may be a false breakout. A breakout on 2x or 3x average volume is a much stronger signal that institutional money is participating.
ChartMath's breakout screens cover multiple timeframes and setup types: 52-week high breakouts, consolidation breakouts on the daily chart, and intraday breakouts above premarket highs. Each screen includes backtest data showing historical win rates and average returns, so you can see which breakout conditions have the strongest edge. You can explore the full range of screens at chartmath.com/screens. For more on catching these moves in real time, see How to Catch Breakout Trading Opportunities in Real-Time.
4. Momentum Setups: Riding the Wave, Not Chasing It
Momentum trading is based on a simple observation: stocks that are moving tend to keep moving. A stock with strong relative strength, elevated volume, and a clear trend is more likely to continue in that direction than to reverse. The challenge for beginners isn't understanding this, it's learning the difference between entering a momentum setup at the right time versus chasing a move that's already extended.
The key filter for momentum setups is RVOL (Relative Volume), the ratio of today's volume to the average volume for that time of day. An RVOL of 2.0 means the stock is trading at twice its normal volume pace. High RVOL confirms that the momentum is real and that institutional participation is elevated. Low RVOL on a big price move is a red flag.
The best momentum entries come on pullbacks to a key level (VWAP, a prior breakout level, or a moving average) after the initial surge, not at the top of the first move. Learning to identify these pullback entries is a skill that takes time, but studying live momentum setups through a screener every day accelerates the process dramatically.
ChartMath's momentum and RVOL screens surface stocks with elevated relative volume and strong price action across multiple timeframes. Reviewing these screens daily gives you a steady stream of real examples to study. For a deeper look at how RVOL works, see Volume Analysis for Day Traders: How to Use RVOL and Volume Spikes.
Your Daily Self-Study Routine: 20 Minutes That Build Real Pattern Recognition
Consistency beats intensity when it comes to building pattern recognition. Twenty focused minutes every day will teach you more than a four-hour weekend study session. Here's a structured routine that fits around a full-time job and uses a screener as the core learning tool.
Step 1, Premarket (5 Minutes): Review What Triggered Overnight
Before the market opens, check your screener for any alerts that fired after yesterday's close or in premarket. For each one, ask three questions: What pattern triggered? What does the chart look like leading up to this? What would need to happen at the open for this to be a valid setup?
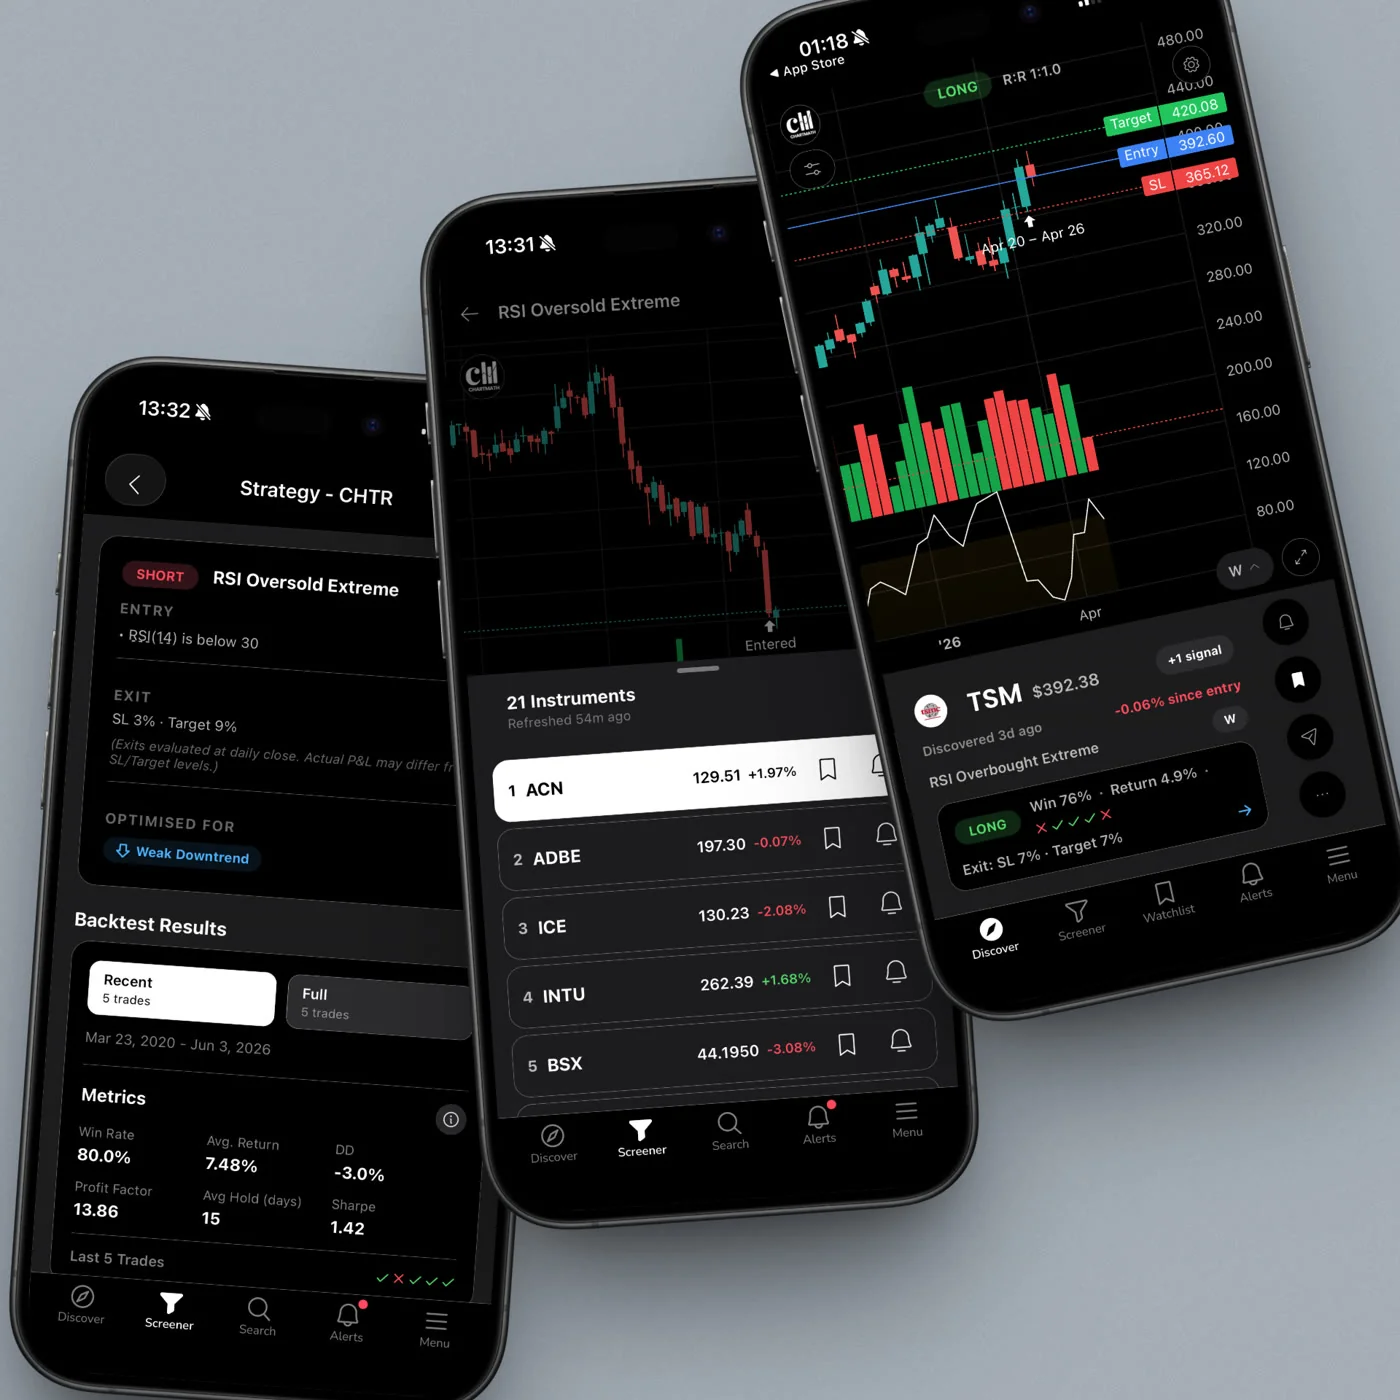
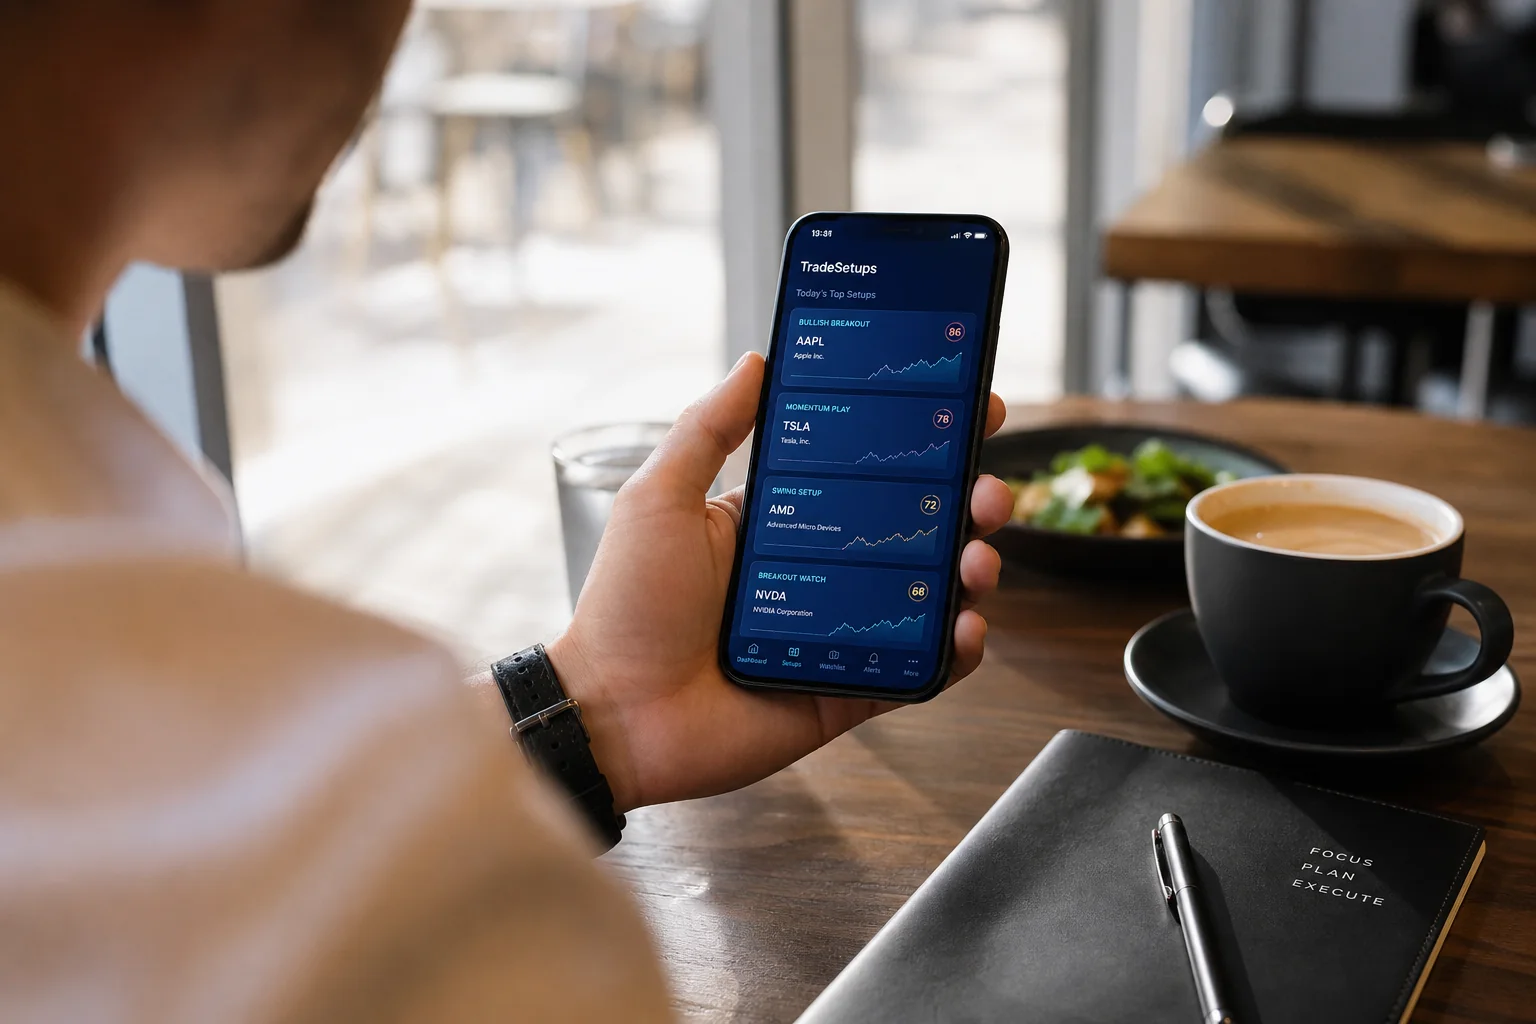
ChartMath sends push alerts to your phone the moment a setup triggers, with a plain-English explanation of why it fired. This makes the premarket review fast, you're not hunting for setups, you're evaluating the ones that came to you. This is especially useful if you're checking your phone before work rather than sitting at a desk.
Step 2, Market Open or Lunch (5 Minutes): Check Live Screens
At or shortly after the open (or at lunch if you're at work), open ChartMath's ORB and VWAP screens. Look at what's triggering. For each setup, spend 60 seconds studying the chart: Is the breakout clean? Is volume confirming? Is the broader market supportive?
You don't need to trade these setups to learn from them. The goal at this stage is exposure, seeing as many real examples as possible and training your eye to recognize the conditions that make each pattern valid or invalid.
Step 3, Postmarket (10 Minutes): The Most Important Part
This is where the real learning happens. After the close, go back through the setups you reviewed earlier and check how they resolved. Did the ORB breakout follow through? Did the VWAP reclaim hold? Did the momentum setup pull back to a clean entry before continuing?
Keep a simple pattern journal. A screenshot of the chart plus three sentences is enough: what the setup was, what happened, and what you'd do differently next time. After 30 days of this, you'll have a personal library of real examples drawn from the market you actually trade, not a curated textbook.
This postmarket review habit is the foundation of an efficient trading workflow. For a broader system that fits around a day job, see How to Build an Efficient Trading Workflow in 2026.
How to Use ChartMath's Pre-Built Screens as a Learning Lab
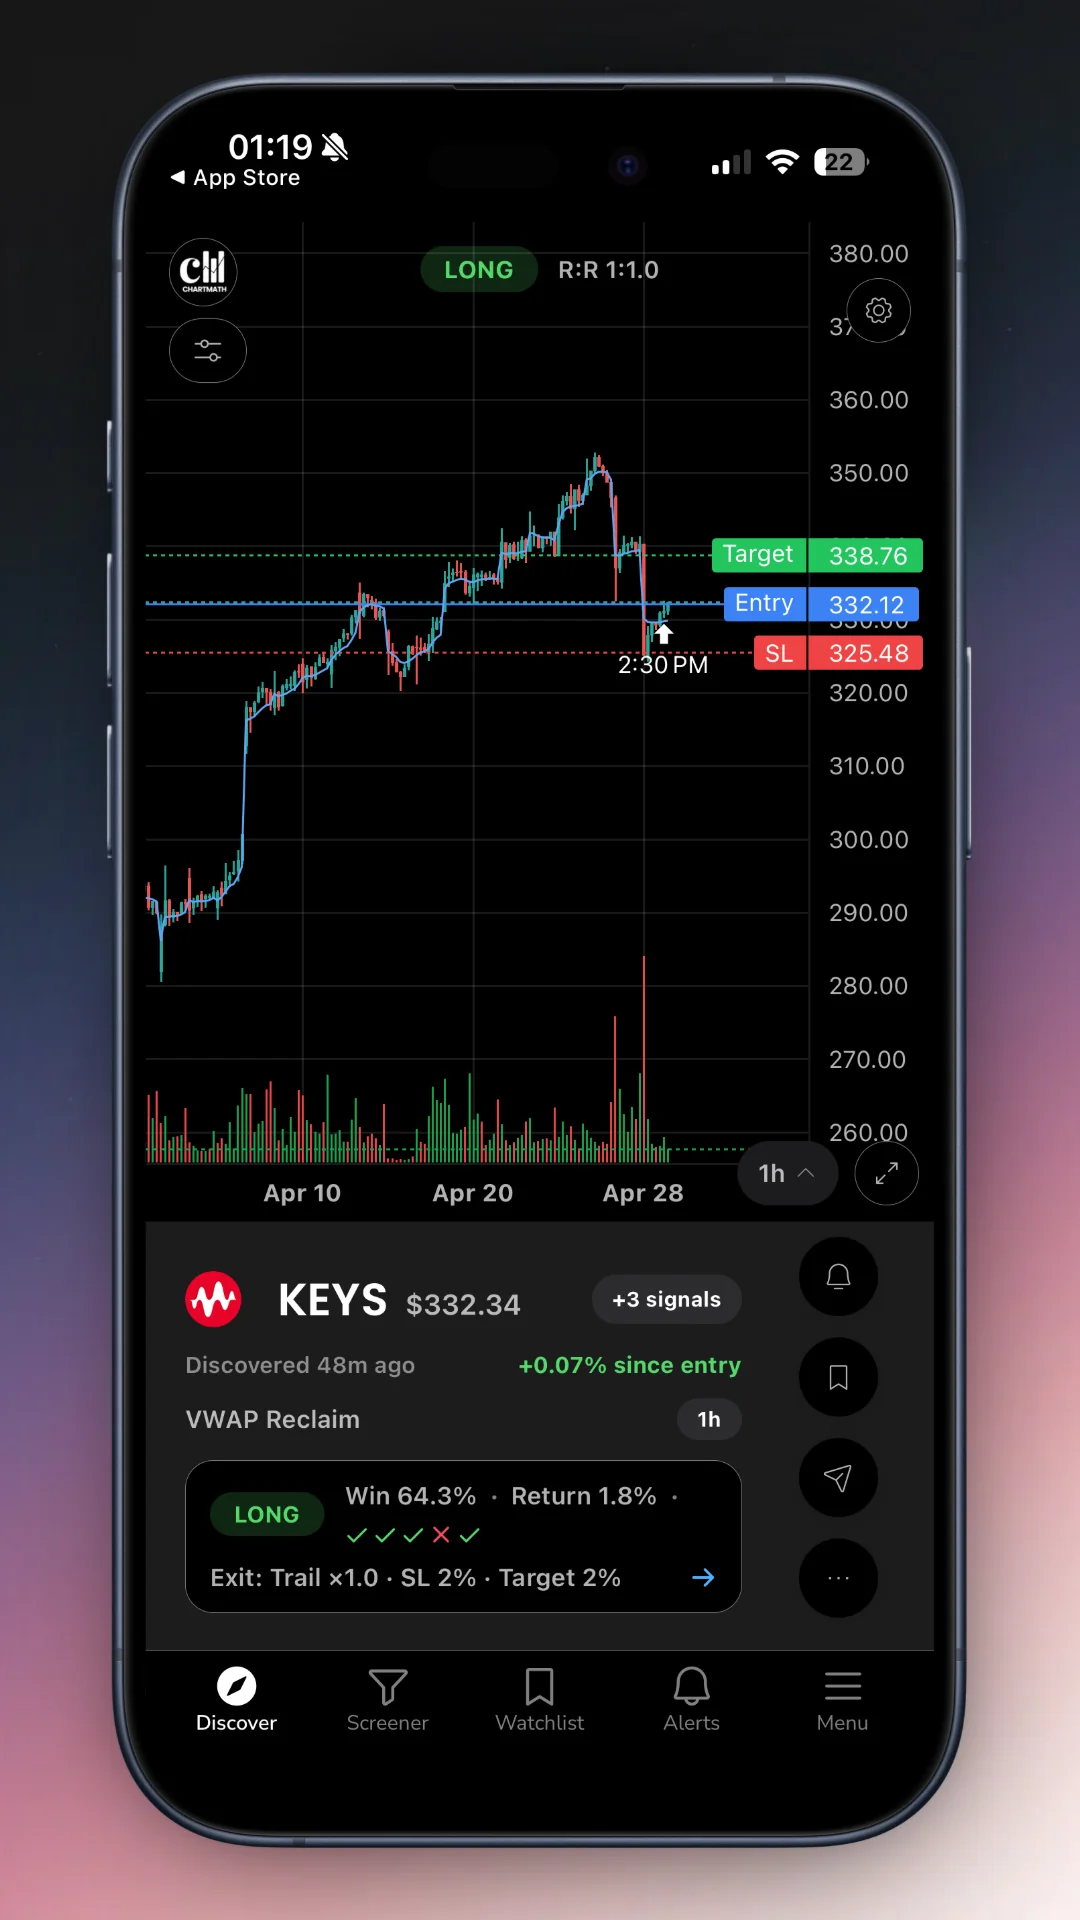
ChartMath was built specifically for traders who want the system to do the scanning while they keep the final call. Its 200+ pre-built screens cover every major setup type, organized so you can go straight to the patterns you're studying without building anything from scratch.
Here's how to use those screens as a structured learning tool:
- Start with four screens: ORB Breakout, VWAP Reclaim, 52-Week High Breakout, and High RVOL Momentum. These map directly to the four patterns covered above. Spend your first two weeks studying only these.
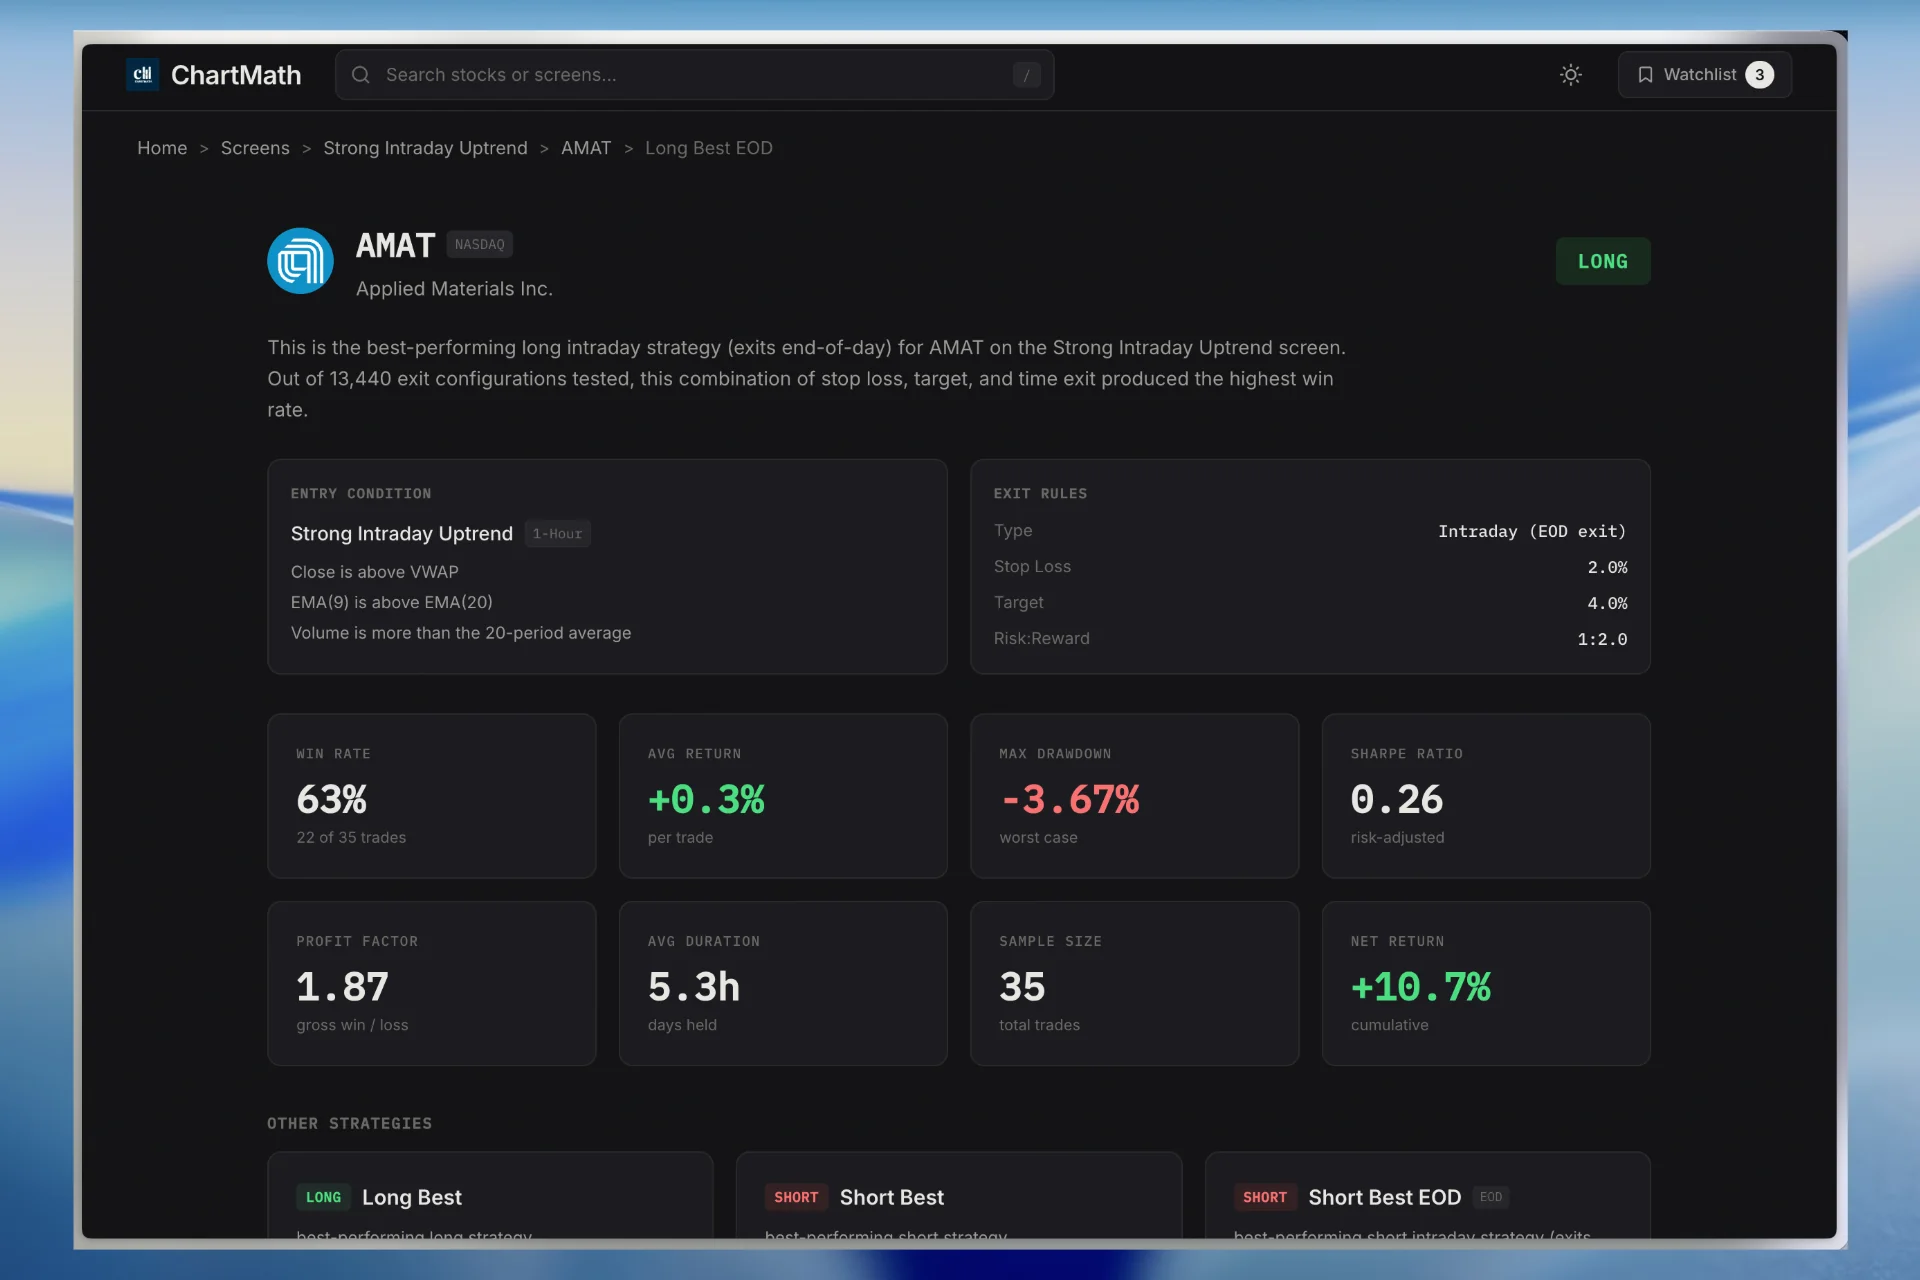
- Use backtest data as a learning tool: Every ChartMath screen includes historical performance data, win rates, average returns, and drawdown stats. Before you study a live example, check the backtest. Knowing a setup's win rate, and how many matched instances produced it, gives you context for evaluating the live example in front of you. It is a figure you can recompute yourself rather than take on trust.
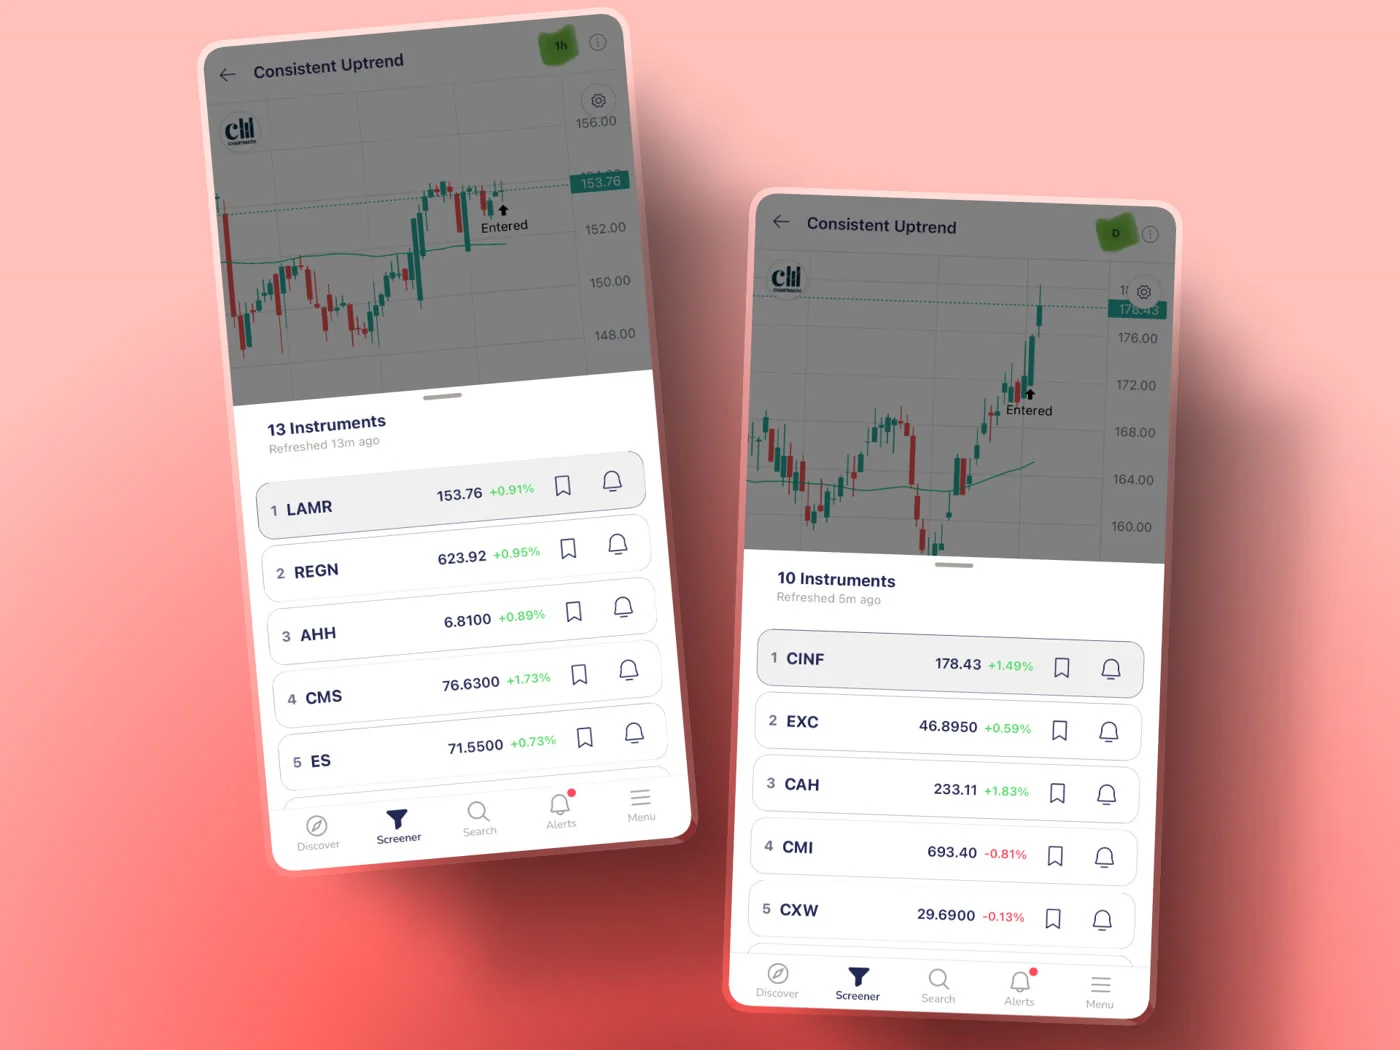
- Make the daily review a habit: Triggered setups arrive as a ranked queue you move through one at a time, evaluating each in seconds. This is ideal for the lunch-break check-in, you can review 10, 15 live setups in five minutes without sitting at a desktop.
- No coding required: Every screen is pre-built and ready to use. There's no Pine Script, no custom alert setup, no filter configuration. You open the app, pick a screen, and start studying. This is a significant advantage over platforms like TradingView, where building a custom alert requires writing code.
- Use it alongside your existing charting platform: ChartMath is designed as a discovery layer, not a replacement for TradingView or TrendSpider. When ChartMath surfaces a setup, you pull it up on your charting platform for deeper analysis. The two tools complement each other perfectly.
If you're already using a charting platform and want to understand how ChartMath fits into your existing workflow, see Stock Scanner Without Pine Script: 200+ Ready-Made Screens.
Common Beginner Mistakes When Studying Chart Patterns
Even with the right tools, there are a few traps that slow down the learning process. Here are the five most common ones, and how to avoid them.
Mistake 1: Studying Patterns Without Volume Context
A chart pattern without volume data is like a weather forecast without humidity, technically present, but missing the information that makes it actionable. Volume tells you whether the move has institutional participation behind it. Always check volume before drawing any conclusion from a pattern.
Mistake 2: Memorizing the Shape Without Understanding the Logic
If you can draw a bull flag but can't explain why it works (consolidation after a strong move, with sellers exhausting themselves before buyers push higher), you'll struggle to recognize it in real markets where it doesn't look exactly like the textbook version. Always ask: what is the market doing here, and why?
Mistake 3: Only Studying Winning Examples
Failed patterns are just as educational as successful ones, sometimes more so. When a breakout fails, ask why. Was volume weak? Did the broader market turn against it? Was the setup extended before the breakout? Failed setups teach you the conditions that reduce pattern reliability, which is knowledge you can't get from studying only the winners.
Mistake 4: Skipping the Postmarket Review
The postmarket review is where passive observation becomes active learning. Without it, you're just watching setups without processing what they mean. Even five minutes of reviewing how the day's setups resolved compounds your pattern recognition over a season.
Mistake 5: Trying to Learn Too Many Patterns at Once
There are dozens of named chart patterns. Trying to learn all of them simultaneously means you'll develop shallow familiarity with many rather than deep recognition of a few. Pick two or three patterns, study them obsessively for a month, then expand. Depth beats breadth at every stage of the learning curve.
For a broader look at the setups worth adding to your repertoire once you've mastered the basics, see 15 Proven Technical Setups Every Day Trader Should Know.
Frequently Asked Questions
How long does it take to get good at pattern recognition?
With consistent daily practice using live market examples, most traders develop solid pattern recognition within 60 to 90 days. The key word is consistent, 20 minutes every day beats a weekend marathon every time. Using a screener to surface live examples dramatically accelerates this timeline compared to studying static charts.
Do I need to watch charts all day to learn technical analysis?
No. In fact, the structured routine in this guide is designed specifically for people who can't watch charts all day. A premarket check, a quick lunch-break review, and a 10-minute postmarket debrief are enough to build strong pattern recognition over time. The screener does the watching for you.
What's the difference between a screener and a charting platform?
A charting platform (like TradingView or TrendSpider) analyzes stocks you already know about. A screener proactively scans a fixed universe of 500+ US equities and surfaces stocks that match specific criteria. For learning purposes, a screener is more valuable because it brings new examples to you rather than waiting for you to find them.
Can I use ChartMath alongside TradingView or TrendSpider?
Yes, that's exactly how it's designed to work. ChartMath acts as a discovery layer that finds setups across 500+ US equities and pushes them to your phone. When something interesting triggers, you pull it up on TradingView or TrendSpider for deeper chart analysis. The two tools complement each other rather than competing. For more on this, see How to Integrate Trading Alerts with Your Charting Platform.
Do I need to know how to code to use a stock screener?
Not with ChartMath. All 200+ screens are pre-built and ready to use out of the box. There's no Pine Script, no custom filter configuration, and no technical setup required. You open the app, pick the pattern you want to study, and start reviewing live examples immediately.
How do I know which patterns actually have an edge?
This is where backtest data becomes essential. ChartMath includes historical performance stats for every screen, win rates, average returns, and drawdown data across hundreds of historical trades. Before spending time studying a pattern, check its backtest. If the historical edge is weak, it may not be worth prioritizing. For a deeper look at how to interpret this data, see How to Build Winning Backtesting Strategies: A Complete Guide.
Start Learning Patterns From the Market Itself
The fastest path from "I've read about chart patterns" to "I can recognize them in real time" runs directly through live market exposure. Not more textbooks. Not more YouTube videos. Real setups, forming right now, with the market logic explained in plain English.
ChartMath gives you exactly that: 200+ pre-built screens covering ORB, VWAP, breakout, momentum, and dozens of other setups, each one backed by backtest data, each alert explained in plain English, all delivered to your phone the moment a setup triggers. No coding. No desktop required. No alert spam.
If you're ready to turn your daily market time into a structured learning routine, watch the ChartMath demo to see how the screens and alerts work in practice. Or download the app and run today's ORB and VWAP screens against the tickers you already follow. The machine narrows the field. You still make the call.

See these setups live in ChartMath
200+ curated screens with backtest data. Free. No credit card required.