How to Connect a Stock Scanner to Your Trading Workflow
Your phone buzzes at 11:40 AM, in the middle of a meeting you can't step out of. It's a scanner alert. By the time you check it at 12:15, the setup is either still valid or it's gone. That gap, between an alert firing and you actually acting on it, is the whole reason to connect a stock scanner to your trading workflow instead of running it as a disconnected browser tab you forget about by Wednesday.
Key Takeaways
- A scanner fills one job: discovery. It should feed your charting tool and broker, not replace either one.
- Filter alerts before you look at the chart: a screen's backtested Win Rate and Avg. Return tell you whether the setup has a history worth your attention.
- Layer, don't switch: keep TradingView (or your existing charting platform) for verification while a scanner handles the discovery layer full-time.
- Check alerts at fixed points, not continuously — premarket, one intraday break, and after close is enough for a swing setup held over days.
- Close the loop with sizing and paper trading before capital moves, since a high win rate alone never guarantees a profitable trade.
At a Glance: Scanner-to-Workflow Setup
| Step | Tool | When You Do It | Time Cost |
|---|---|---|---|
| Discover a setup | Scanner (e.g. ChartMath alert feed) | Premarket or on push notification | 1-2 min |
| Check the rule and history | Screen detail (Win Rate, Avg. Return, sample size) | Right after the alert | 1 min |
| Verify on a live chart | TradingView or your charting platform | Before entry | 2-3 min |
| Size the position | Capital split / risk plan | Before placing an order | 1 min |
| Rehearse (optional) | Paper trading with stop/target pre-filled | New setups, first few reps | 2 min |
| Place the order | Your broker | After verification | 1 min |
| Review | Portfolio tab or trade journal | End of day / weekly | 10-15 min |
1. Map the Three Stages a Scanner Actually Fills
A working trading stack has three separate jobs: discovery, verification, and execution. A stock scanner is built for the first one. It watches a defined universe of tickers around the clock and flags the moment one matches a rule. It is not built to replace your charting software, and it definitely isn't a broker.
This is also where the "real-time scanner vs end-of-day screener" question actually matters. An end-of-day screener runs its scan once, usually after the close, and hands you a list to review that night or the next morning. A real-time scanner checks continuously through the session and pushes an alert the second a ticker enters a screen, which matters if you trade intraday setups or want to catch a swing entry as it forms rather than a day late. Neither is wrong; they answer different questions. If you hold positions for days and check your phone a few times daily, a scanner with per-minute checking against your watchlist covers both jobs without you doing the scanning by hand. Our breakdown of real-time vs end-of-day scanner software goes deeper into which one fits your actual trading cadence.
Verification is the second stage, and that's where your charting platform stays fully in the picture. A scanner narrows 500+ tickers down to a handful worth ten seconds of your attention. Your chart tells you where support sits, what the broader trend looks like, and whether the entry still makes sense right now. Execution is the last stage, where you actually place the order in your own broker. A scanner that tries to do all three tends to do none of them well.
2. Pick a Scanner That Attaches a Track Record to Every Alert
Most alert noise comes from one place: a signal with no history behind it. A ticker flagged in a Discord channel or a generic screener list tells you what's happening right now, but not whether that pattern has ever actually worked. That's the gap that turns an alert into a guess.
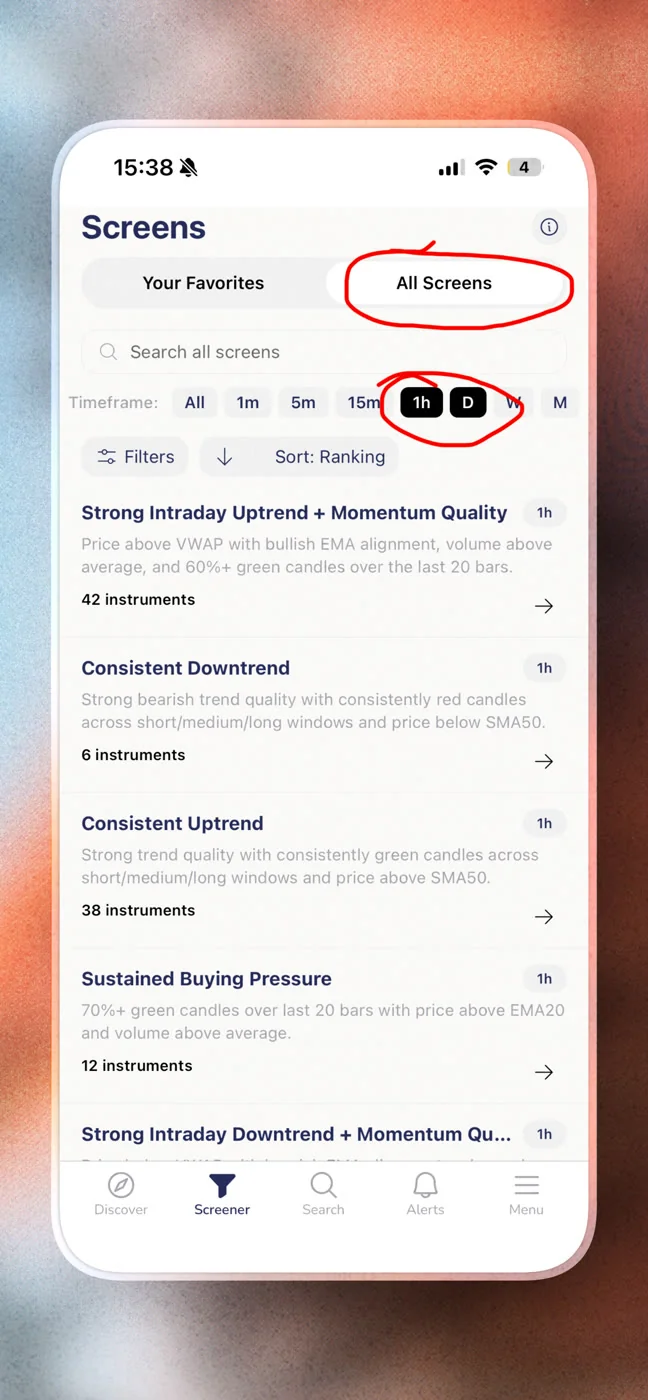
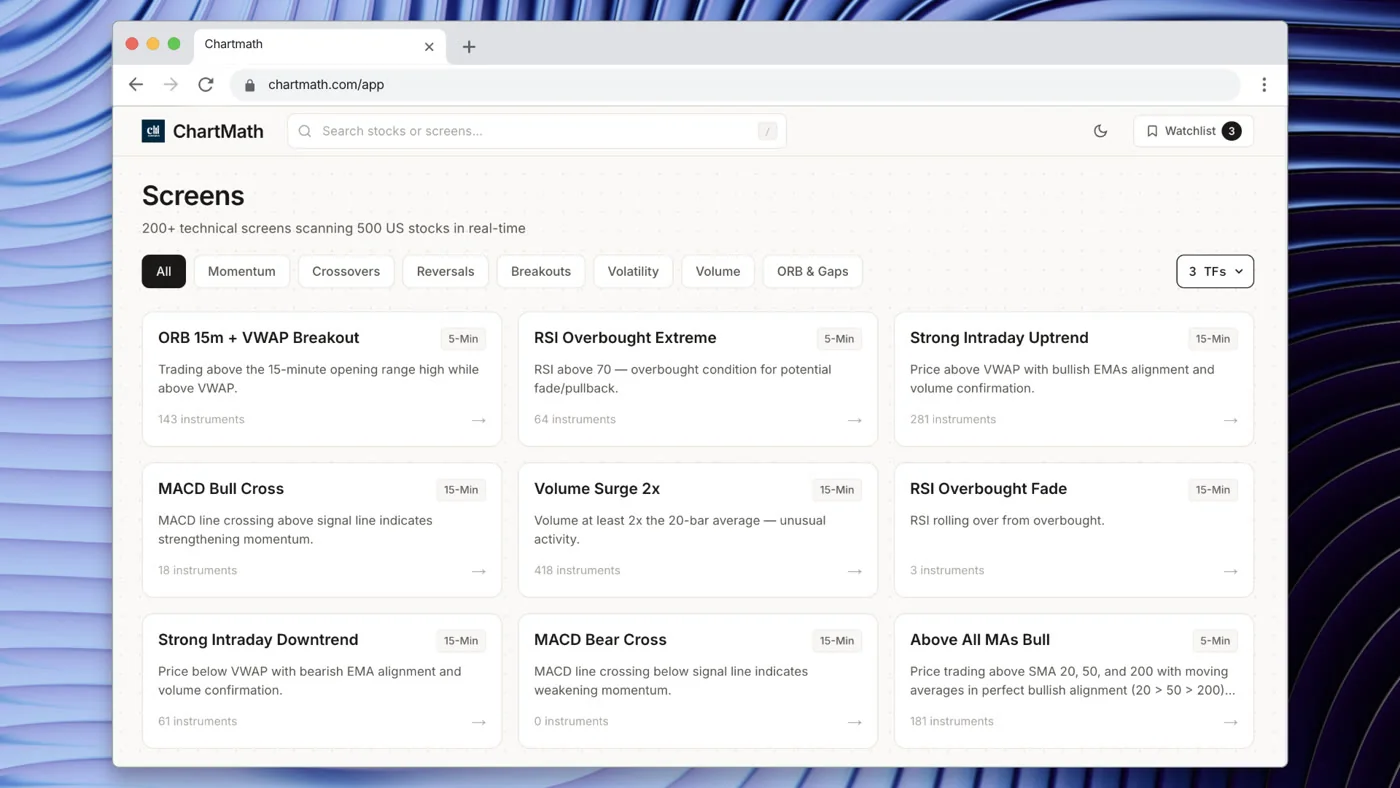
The fix is simple to state and harder to find: every alert should carry a Win Rate and Avg. Return computed from a fixed, restatable rule, not a vibe. ChartMath runs 200+ deterministic technical screens across a curated universe of 500+ US equities, and each screen carries its own backtested record because the rule behind it is fixed. The Consistent Uptrend screen (daily) and the VWAP Reclaim screen (1H) are two you can open and check right now. That means the number can be recomputed by anyone, not taken on trust.
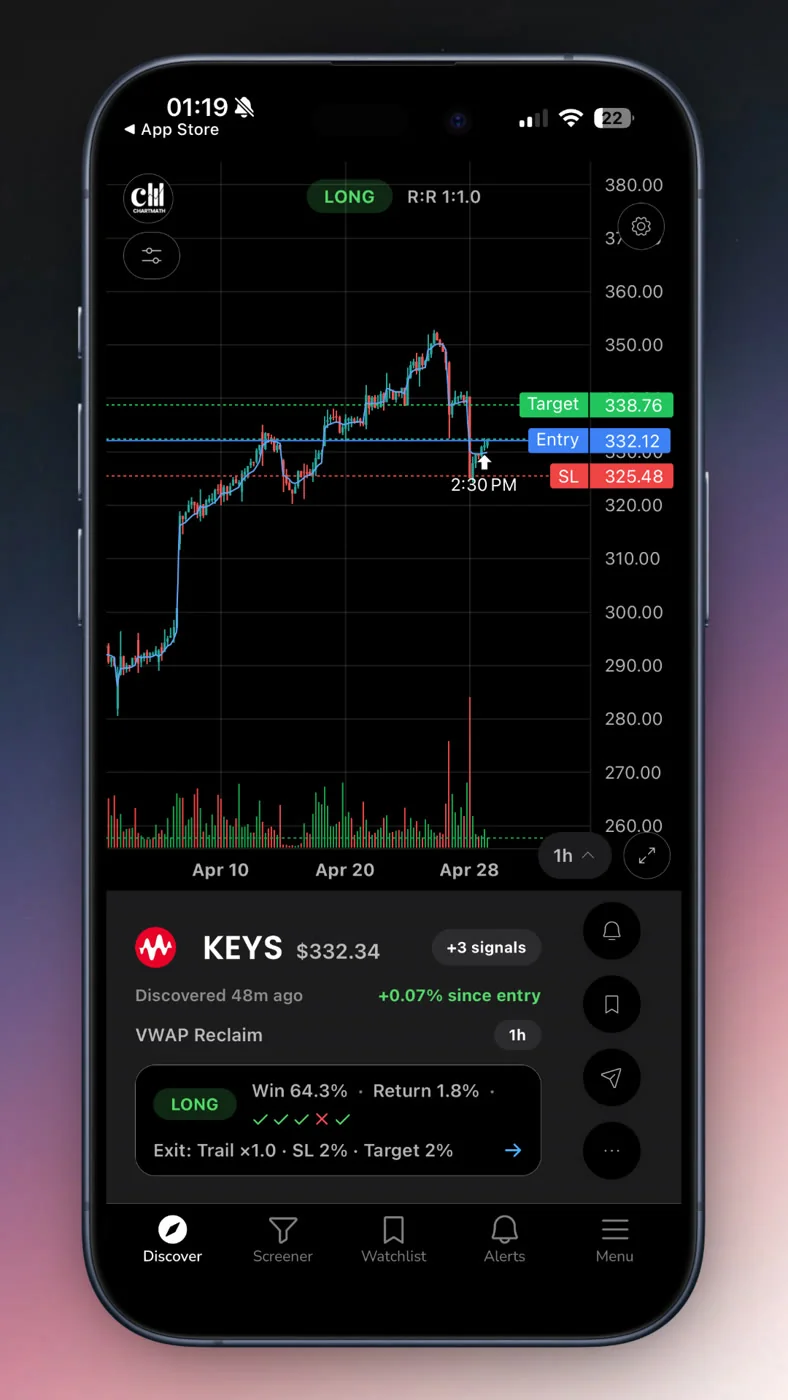
Sample size matters as much as the win rate itself. A screen that's fired 12 times in the last year and won 8 of them is a different animal than one that's fired 400 times at a similar rate. Before you trust any number, check how many times the rule has actually triggered.
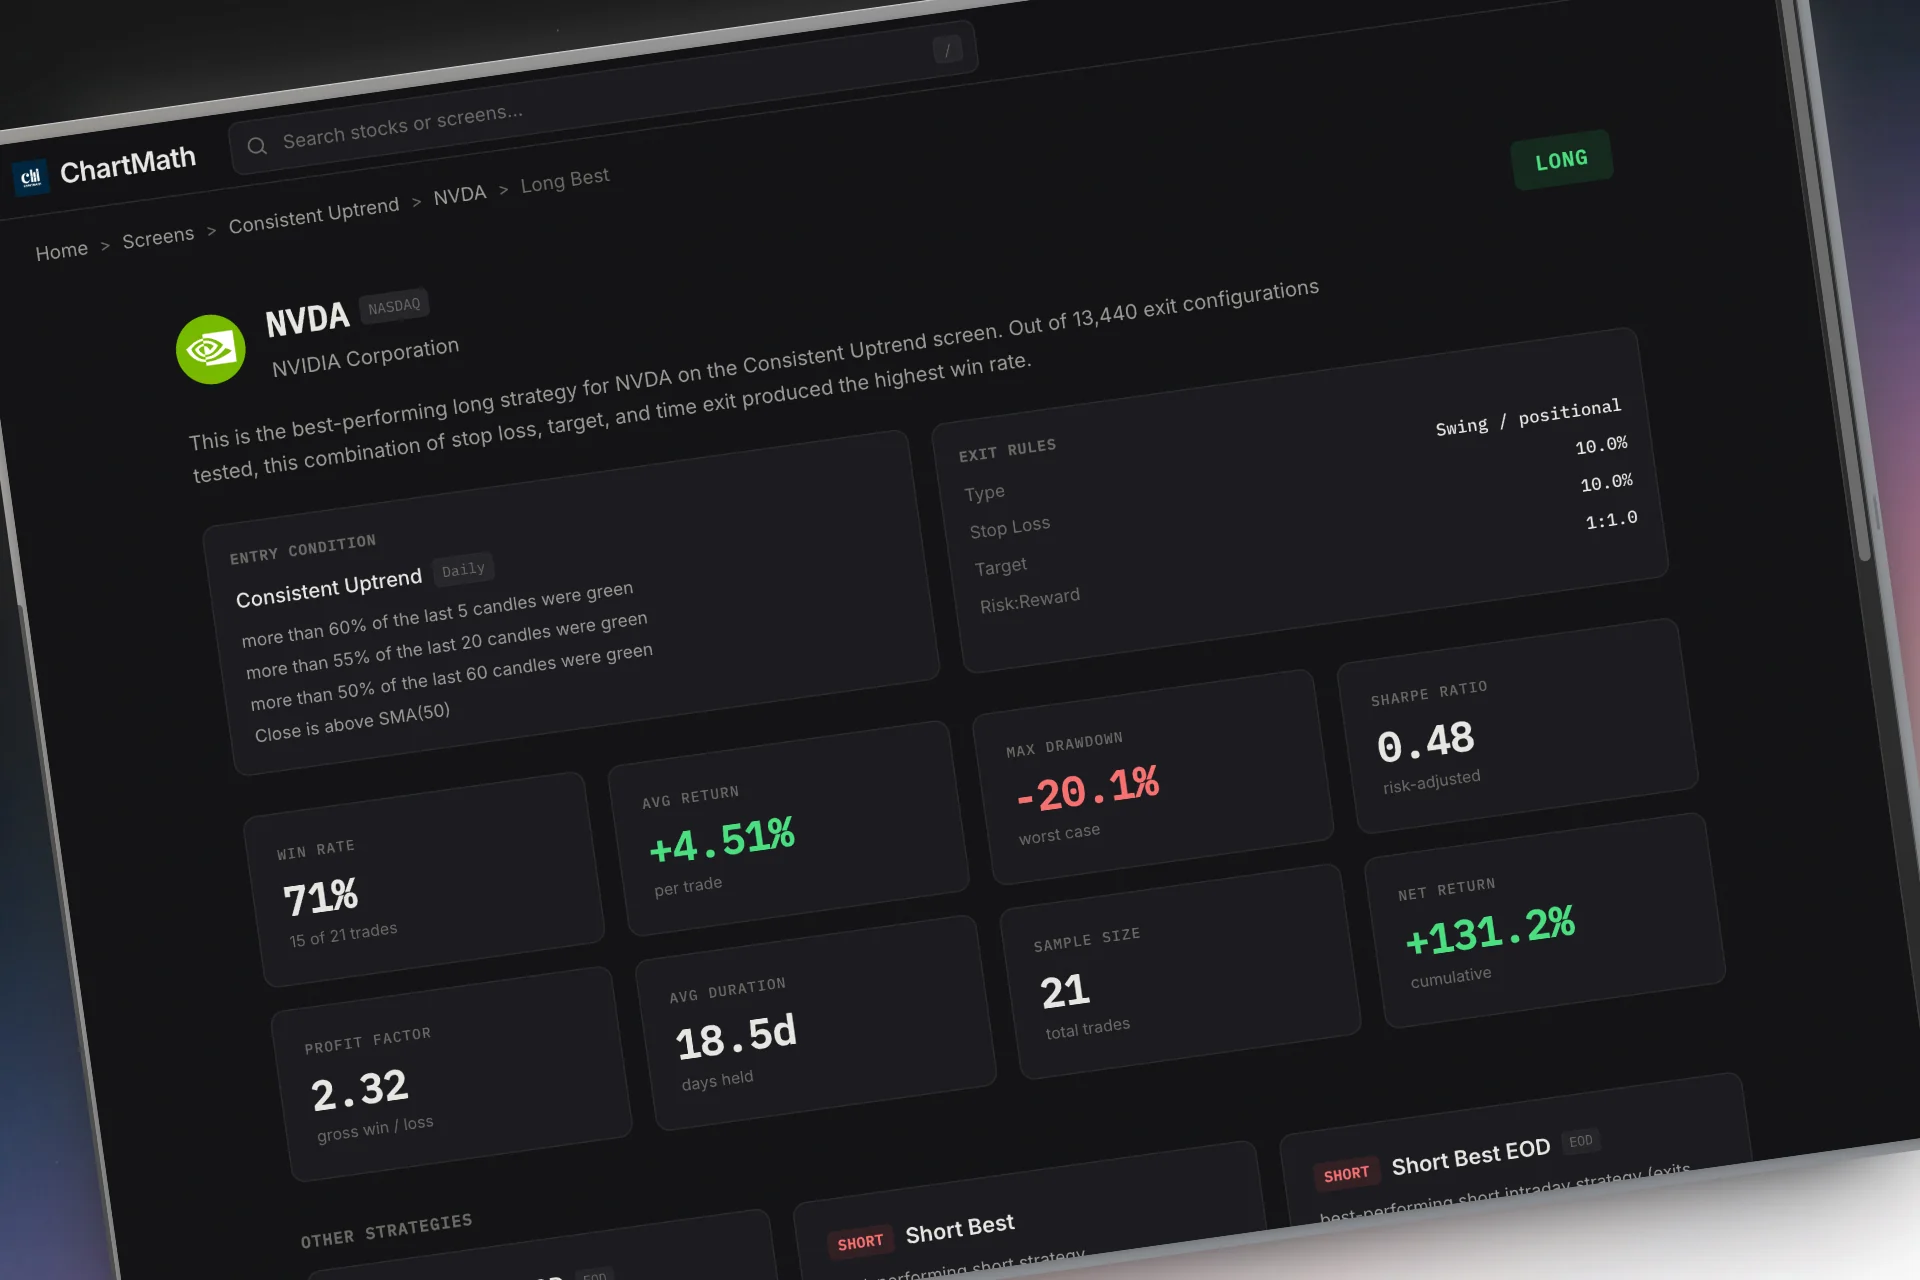
This is also the honest answer to "best stock screener and trading execution platform": no single tool does discovery, backtesting, charting, and order placement equally well, and you shouldn't want one that claims to. What you want is a scanner that hands you a validated shortlist, a charting tool that lets you confirm it, and a broker you already trust to execute. ChartMath is designed to slot into that stack rather than replace the pieces you already rely on.
3. Layer Scanner Alerts on Top of Your Charting Tool
Don't drop TradingView. That's the short version. TradingView is still where you draw trendlines, mark support, and eyeball multi-timeframe structure, and none of that goes away once a scanner is in the mix. What changes is what triggers you to open the chart in the first place.
Instead of scrolling a watchlist tab by tab, hoping something looks interesting, a scanner alert tells you a specific ticker just matched a specific rule on a specific timeframe. You open TradingView with a reason already in hand: "AAPL just crossed above its 20/50 EMA on the daily, and that screen has a documented history." That rule is live as the Price Above 20/50 EMA screen (daily), with its own backtested record attached. Now you're verifying one setup with context, not fishing through forty charts.
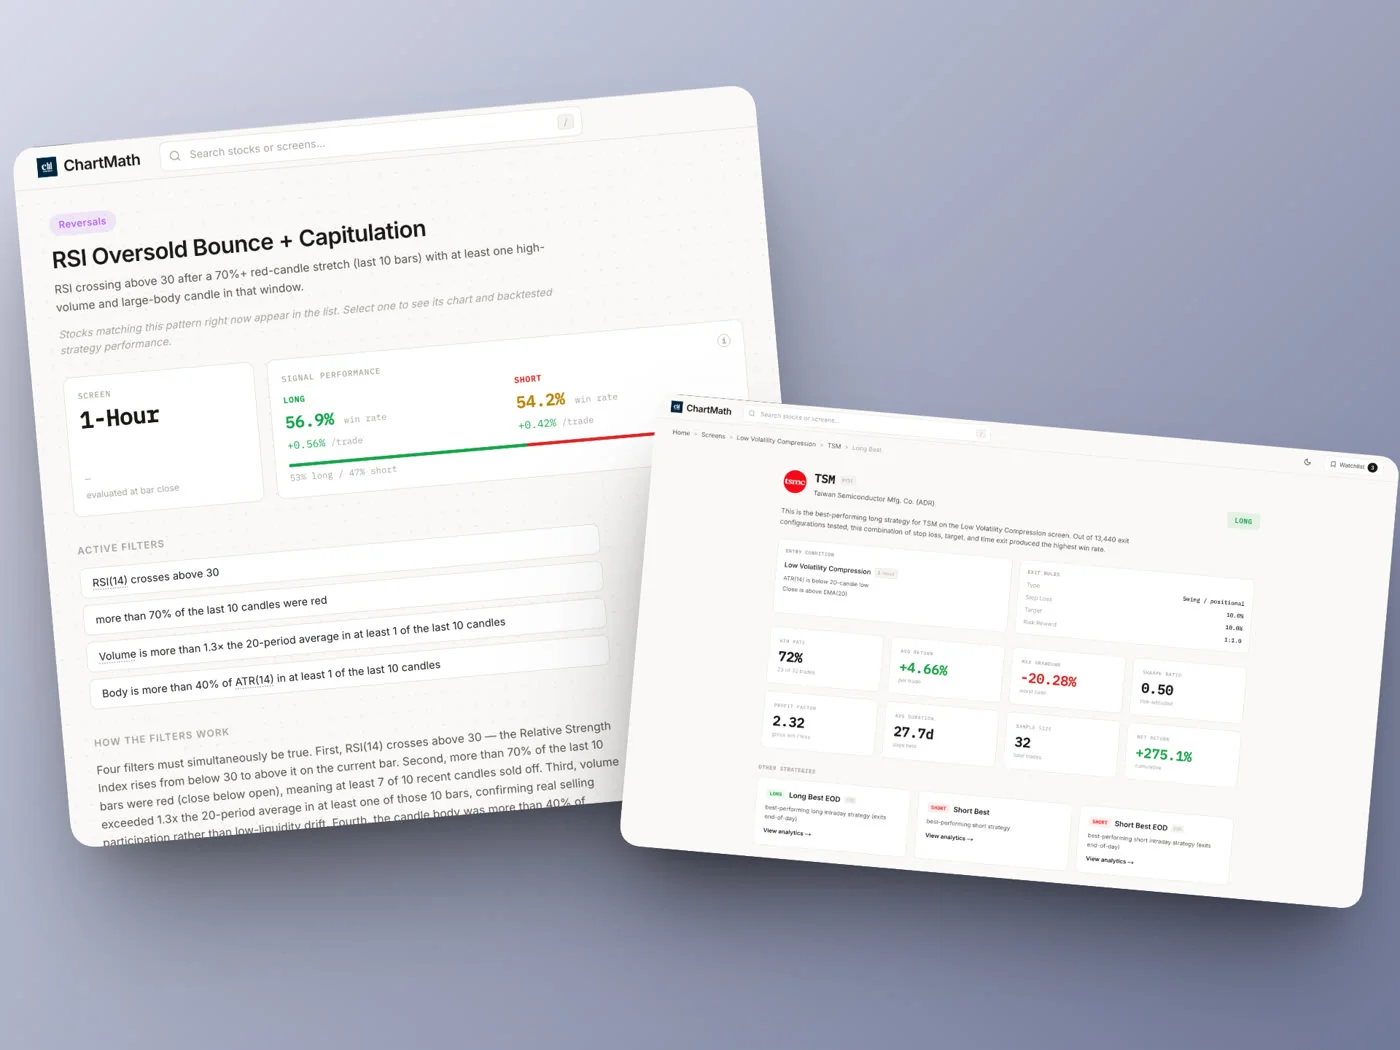
A single, well-maintained watchlist checked continuously does more work than a dozen manual scans. ChartMath checks every ticker on your watchlist against all 200+ screens continuously and only alerts you when one actually matches, so the watchlist becomes something that works while you're in a meeting instead of something you have to remember to open.
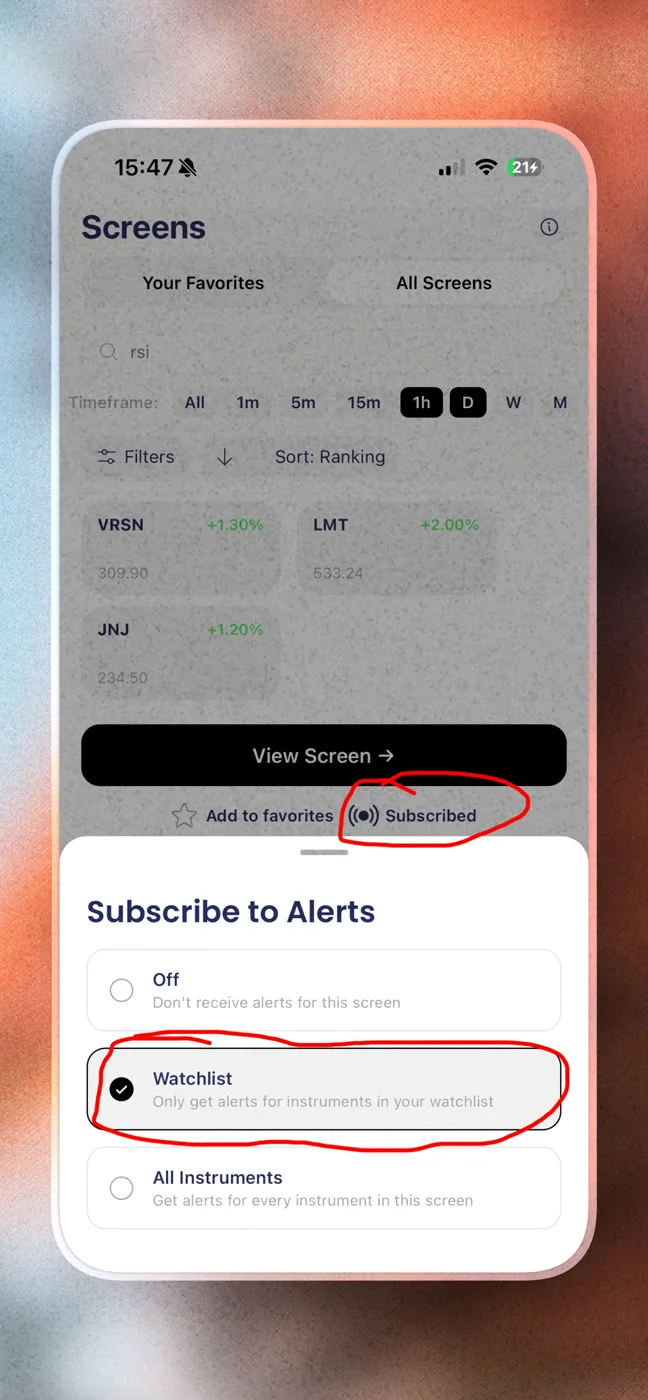
If you already run TradingView as your primary chart workspace, think of a real-time scanner as a companion layer that decides when TradingView is worth opening. We cover this pairing in more detail in how to use a stock scanner alongside TradingView, and if you want the tool-specific comparison, see our note on the best stock scanner apps with real-time alerts for iPhone and Android.
4. Set Up Alerts You Can Act on Without Staring at a Screen
Alert fatigue kills more workflows than bad setups do. If every alert demands your attention right now, you either quit your job or you start ignoring the app. Neither helps you trade.
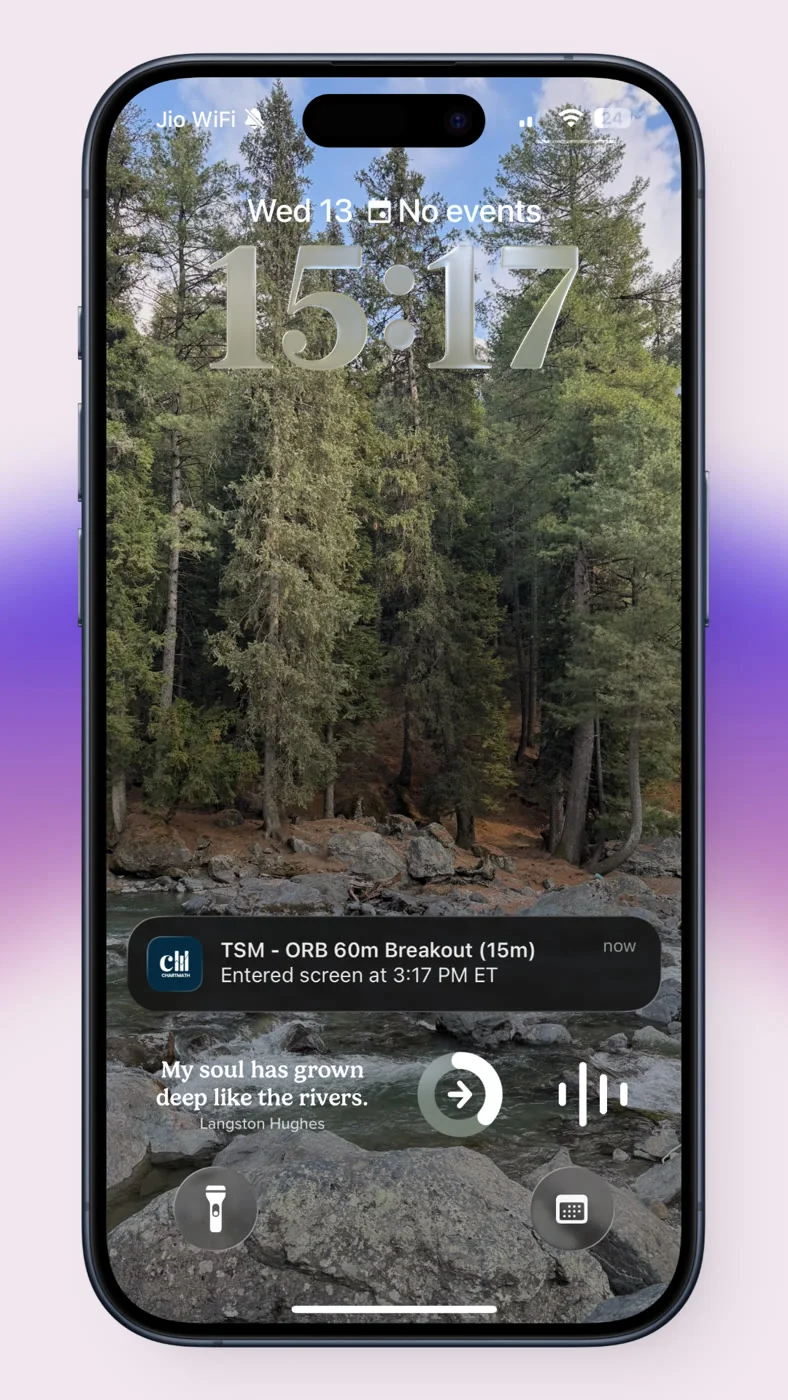
ChartMath sends alerts by push and email, and each one carries enough context to make a decision without opening five other tabs: the ticker, the timeframe, the screen name, a plain-English reason it fired, and a timestamp. That last part matters. An alert from 90 minutes ago is a different decision than one from 90 seconds ago.
Build fixed checkpoints instead of reacting to every buzz. A workable rhythm for someone with a day job looks like this:
- Premarket (10-15 min): check overnight alerts, glance at the screens your watchlist tickers matched.
- One midday break (5 min): scan whatever fired since the open, verify anything worth acting on.
- After close (15-20 min): review the day's alerts, update your watchlist, log any trades taken.
That's three touchpoints, not a constant scroll. If you want a fuller version of this cadence, our piece on swing trading with a full-time job in a 20-minute daily routine walks through the exact timing.
5. Build the Decision Rule Before You See a Signal
Here's the part traders skip and shouldn't: a high win rate on a screen does not guarantee your next trade wins. A screen that's won 63% of the time across its backtested history is describing a population of past trades, not forecasting this specific one. Treat the number as an edge, not a promise, and size accordingly.
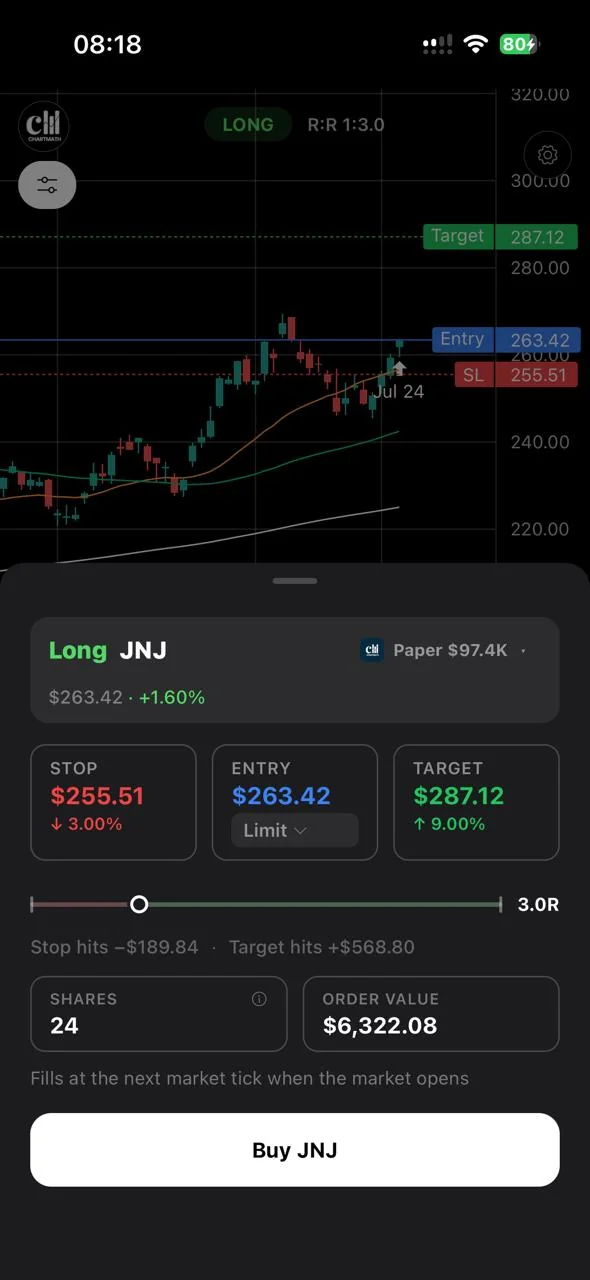
That means deciding your position sizing rule before an alert ever fires, not while you're staring at one. A capital split, a fixed dollar amount divided across your maximum number of open positions, keeps any single trade from doing outsized damage to your account regardless of how good the backtest looked. Our rules-based method for picking swing trades covers how to combine a screen's history with a sizing rule instead of trading the number alone.
Momentum indicators and relative volume are useful confirmation tools here, not standalone triggers. A stock showing high relative volume alongside a matched screen, the kind the Volume Surge 2x screen (daily) flags, is telling you more people are paying attention right now, which can support conviction, but it's a supporting signal, not the whole rule. If you're new to reading relative volume, our explainer on how automated scanners identify high-probability patterns is a useful next read.
Before any new setup gets real capital, rehearse it. ChartMath's built-in paper trading lets you place a simulated order with the stop and target pre-filled and share count computed for you, tracked in a Portfolio tab, so you can watch how a setup behaves in real market conditions without risking a dollar. This is a copilot, not an autopilot: you tap to place every order, nothing fires automatically. The paper trade is a rehearsal step, not a substitute for eventually trading your own capital with your own judgment.
6. Run the Daily Loop
Put the pieces together and the routine looks like this, in order:
- Set your watchlist once, tickers you already follow, checked against 200+ screens continuously.
- Let alerts come to you by push and email at natural checkpoints instead of refreshing a scanner tab all day.
- Check the screen's Win Rate, Avg. Return, and sample size before you even open a chart.
- Verify on TradingView (or your existing charting tool) to confirm structure and context.
- Size the position using a capital split decided in advance, not on the fly.
- Paper trade unfamiliar setups first to see how they actually play out.
- Place the order in your own broker once you've verified it yourself.
- Review weekly, not just daily, to see which screens are actually earning their place in your routine.
This is what replaces refreshing Finviz for the fortieth time or watching four charts at once during a lunch break. The scanner does the watching; you do the deciding.
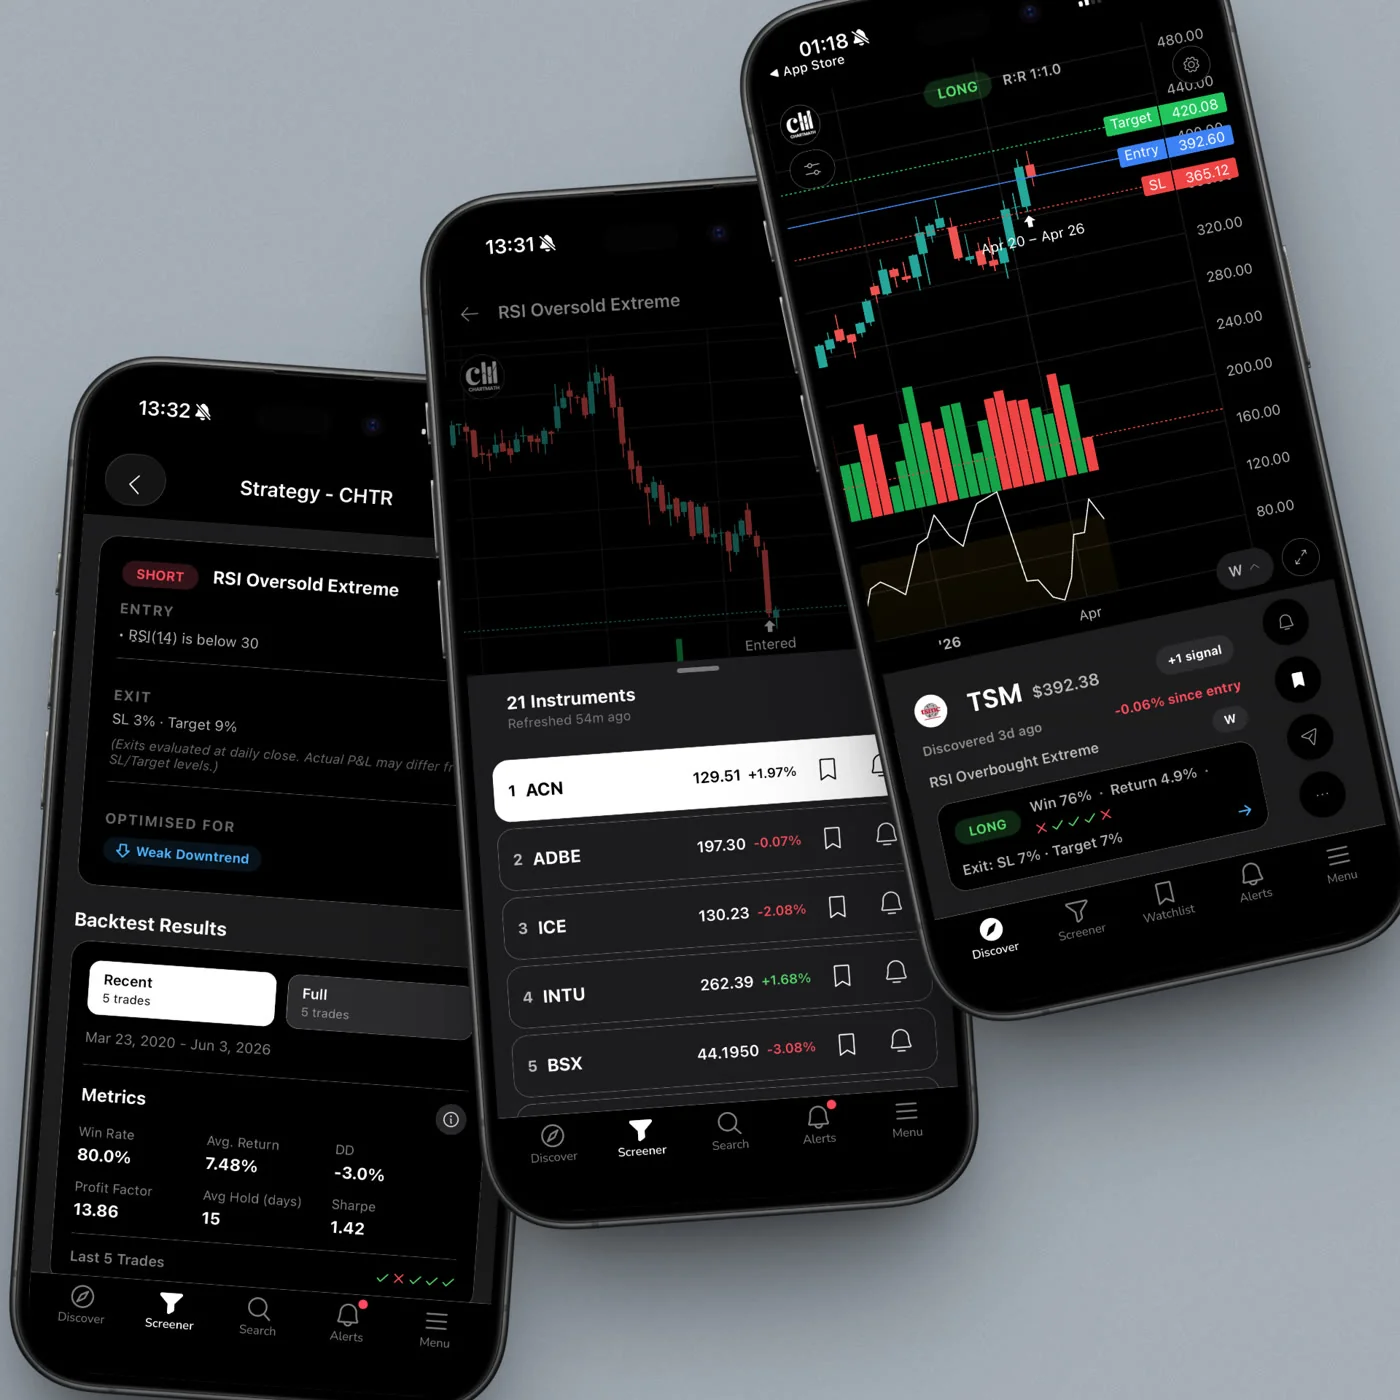
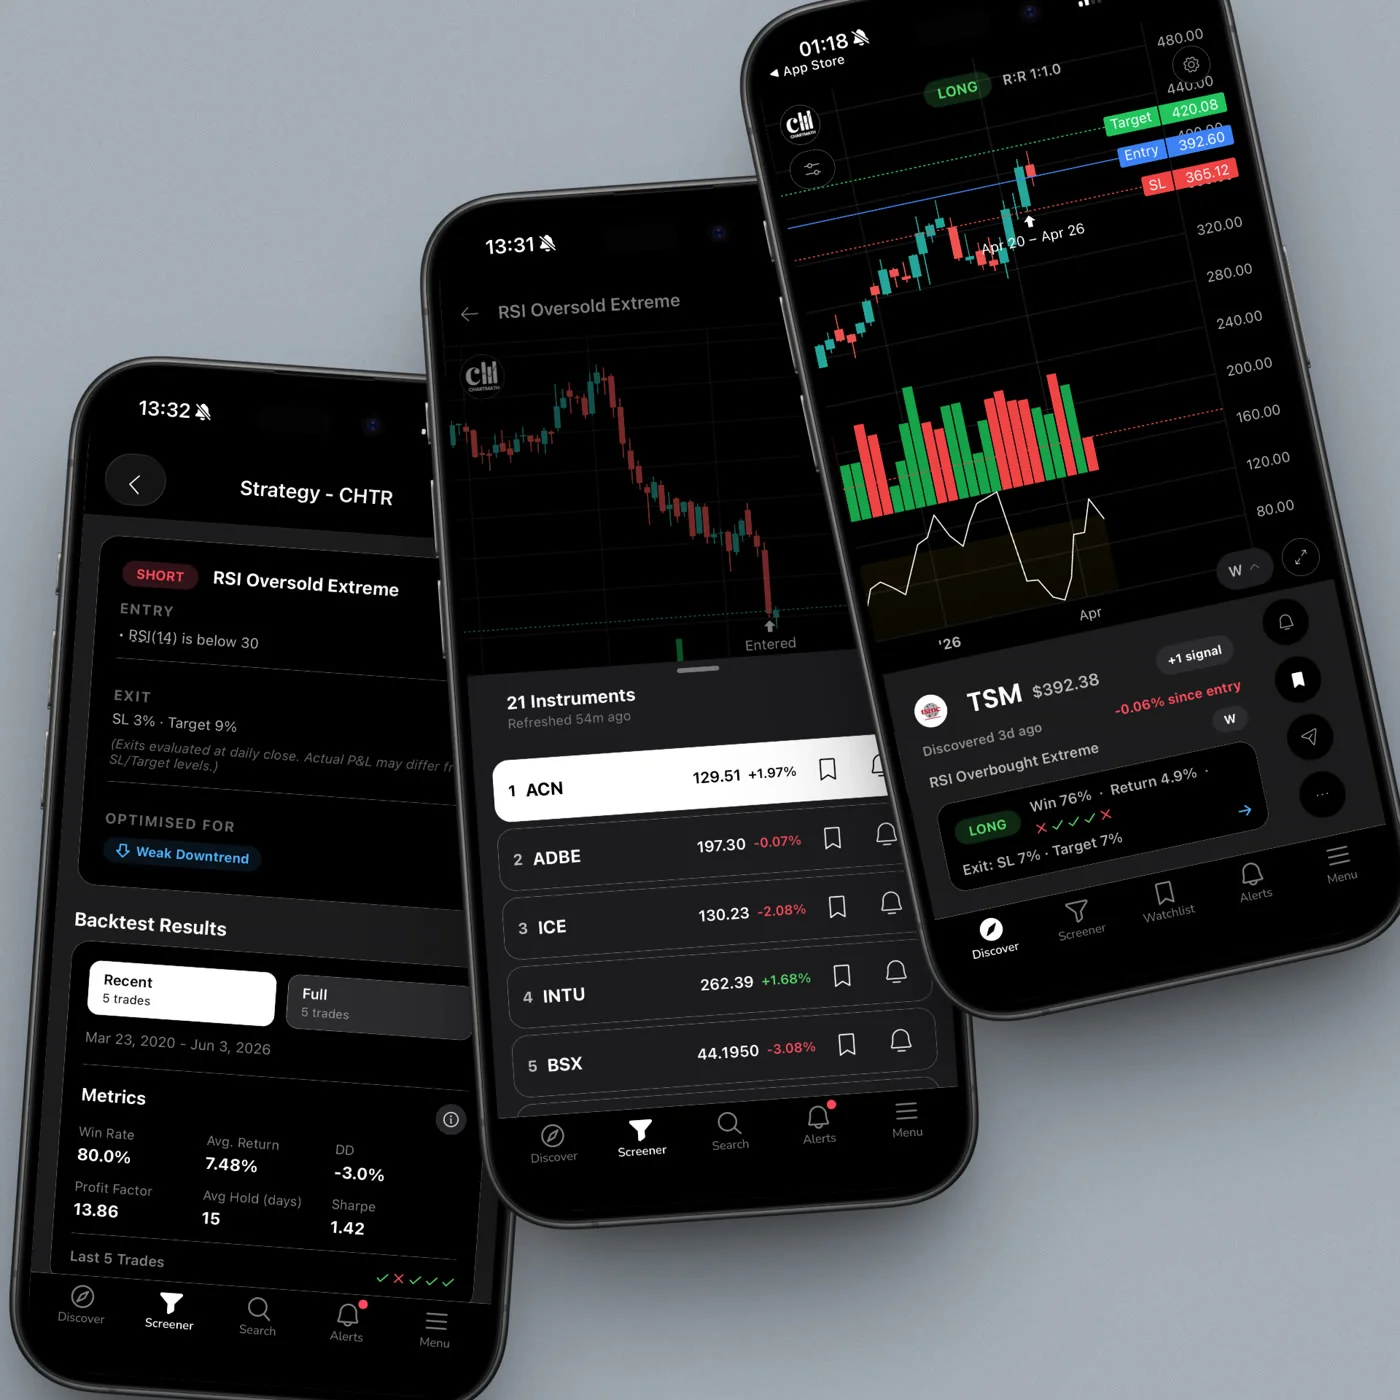
You can see the whole scan-to-chart path across screens in this view of the discovery flow:
FAQ
What's the difference between a real-time scanner and an end-of-day screener?
A real-time scanner checks its universe continuously and alerts the moment a ticker matches, useful for catching intraday setups or a swing entry as it forms. An end-of-day screener runs once after the close and gives you a static list to review before the next session. If you can't watch charts all day, a real-time scanner with push alerts does the watching for you.
Is a stock scanner the same as a stock screener?
The terms overlap but people generally mean this: a screener is the list of rules or filters, and a scanner is what runs those filters continuously and alerts you live. A tool can do both, filtering a universe (screener function) and pushing alerts as matches happen (scanner function).
Which trading platforms have a built-in scanner instead of requiring a separate tool?
TradingView has screener functionality built in but leans heavily on manual setup and Pine Script for anything custom. ChartMath is built specifically as a mobile-first scanner with 200+ ready-made, backtested screens, so there's no coding required to get real-time alerts across a curated universe of 500+ US equities.
Do I still need TradingView if I'm using a scanner?
Yes, for most traders. A scanner tells you what and when; a full charting platform like TradingView is still the best place to draw levels, check multi-timeframe context, and do your own visual read before you commit capital.
If you're ready to stop scanning tickers by hand, ChartMath is free with no credit card required, and it runs on iOS and Android. You can browse the full screen catalog and read the rule and the backtested record behind any screen before you commit to anything, or go straight to the download page and connect your first watchlist today. Set up one screen, let it run for a week, and see whether the alerts you get are worth the attention they ask for.

See these setups live in ChartMath
200+ curated screens with backtest data. Free. No credit card required.