How to Trade Stocks Systematically as a Beginner
The fastest way to trade stocks systematically as a beginner is to stop picking trades from a feeling and start picking them from a rule that has a documented history. That means using pre-built, backtested screens instead of a hunch, checking the plain-English reason a setup fired, sizing the position before you enter, and logging the result against a large enough sample to mean something. Everything else in this guide builds on that one shift.
Key Takeaways
- Evidence beats intuition: A systematic setup carries a documented Win Rate and Avg. Return over a real sample size, so you know its track record before you risk a dollar.
- Screens remove the "what to watch" problem: Instead of scrolling a static list and guessing, a curated screen tells you which tickers currently match a specific, pre-defined rule.
- Alerts should teach, not just ping: A plain-English explanation of why a signal triggered is what turns a random notification into an actual lesson about market behavior.
- Small samples lie: Four or five trades tell you almost nothing about whether a strategy has an edge. You need dozens of occurrences, not a lucky week.
- Systematic does not mean automatic: You still decide and place every trade yourself. The system just makes sure every decision starts from the same rule.
At a Glance: Systematic vs Gut-Feel Trading
| Factor | Gut-Feel Trading | Systematic Trading |
|---|---|---|
| Decision basis | Feeling, chart "looks good," a tip from a group chat | A documented rule with a Win Rate and Avg. Return |
| What you're watching | Whatever tab is open, whatever ticker is trending | A curated screen scanning a defined universe continuously |
| Entry timing | Whenever you happen to notice the move | The moment the setup matches, via push or email alert |
| Position size | Decided in the moment, often inconsistent | Calculated ahead of time from a fixed risk percentage |
| Learning loop | Vague sense of "that worked" or "that didn't" | Logged results compared against the setup's historical sample |
| Sample size used to judge a strategy | Last 3-5 trades | Dozens to hundreds of historical occurrences |
| Tools typically involved | Static screener, Discord/Telegram calls | Backtested screens plus plain-English alerts |
What Does It Mean to Trade Stocks Systematically?
Trading systematically means every trade follows a rule you defined in advance, not a decision you make in the moment. The rule covers three things: what counts as a valid entry, where you get out, and how big the position is. If you can't write the rule down in one sentence, you're not trading systematically yet, you're improvising with a chart open.
This is different from automated trading. A systematic approach doesn't require a bot placing orders while you sleep. It just means the setup itself, the "why now," is defined ahead of time and has a track record attached to it. You're still the one who taps buy. The system is copilot, not autopilot: it surfaces the setup and the evidence, you make the final call and place the order.
For a beginner, this distinction matters more than almost anything else. New traders don't usually lose money because they lack market knowledge. They lose money because every decision resets to zero. One day they're trading breakouts, the next day they're trading a tip from a group chat, and there's no consistent thread connecting Tuesday's trade to Thursday's trade. Systematic trading is the fix: the same rule, applied the same way, every time it appears.
Why Gut-Feel Trading Fails Beginners
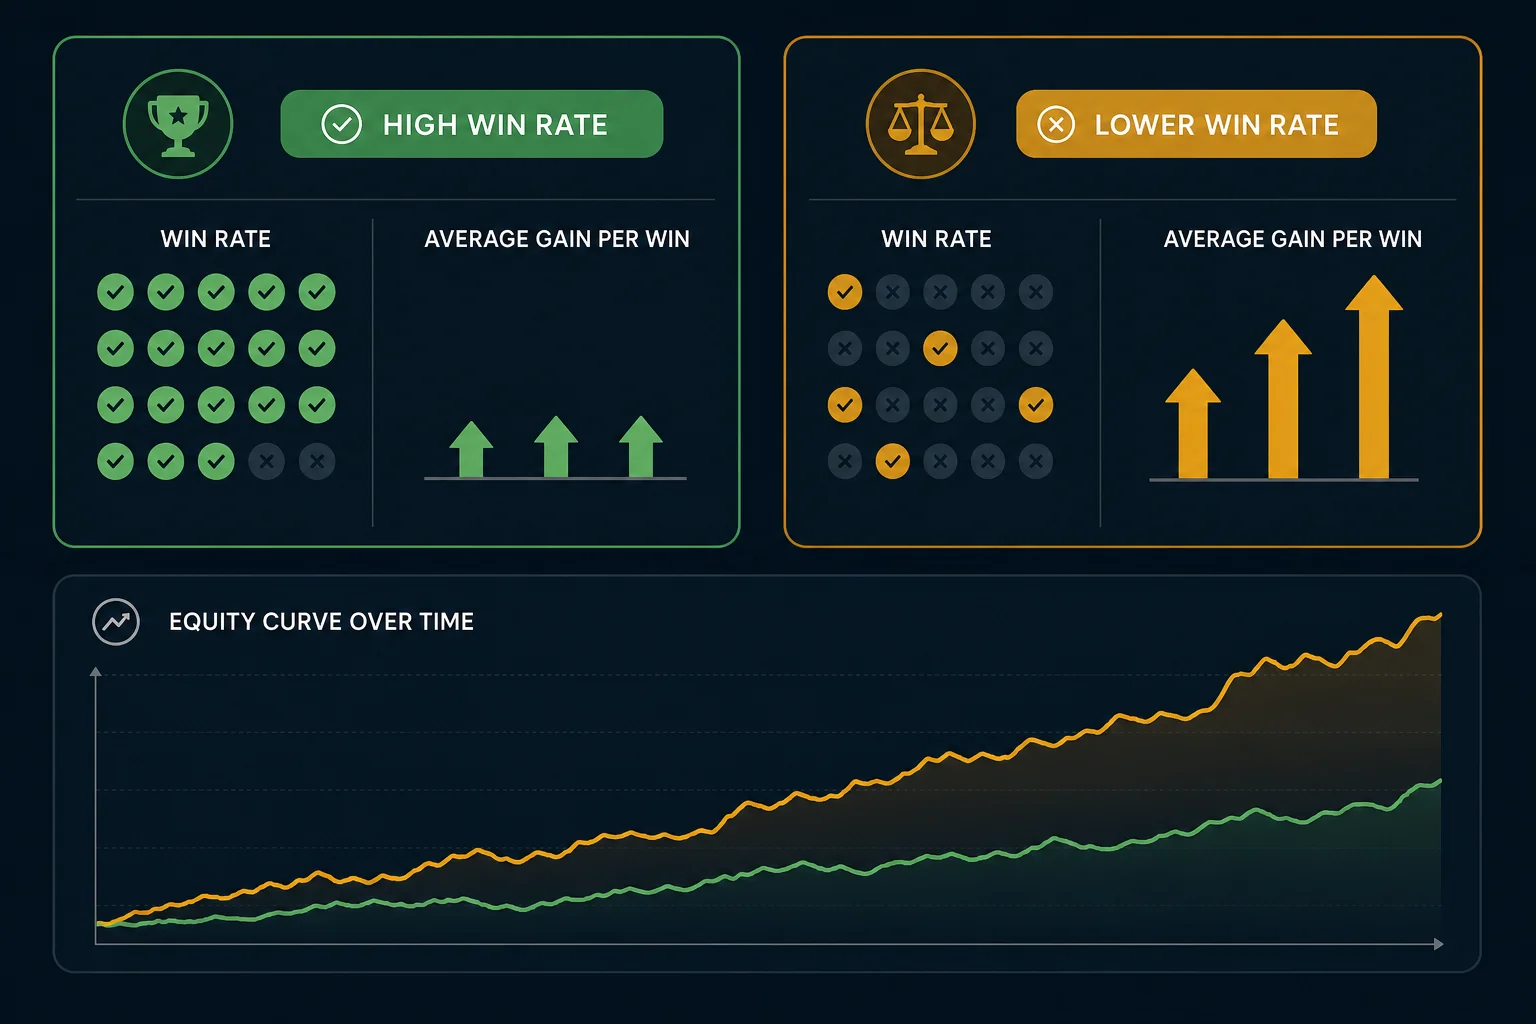
Here's the pattern almost every new trader repeats. You take a trade because the chart "looks like" something you saw work before. It wins. You take a similar-looking trade a few days later. It loses. After five or six trades you have a feeling about whether you're "good at this," but you don't actually have data. You have a coin flip you're calling a strategy.
Recency bias makes this worse. A trader who wins four trades in a row starts believing they've found an edge, when in reality four trades is nowhere near enough to know anything. The same trap runs the other direction: a trader who loses two trades in a row often abandons a setup that, over a larger sample, actually had a real edge. Neither reaction is really about the setup. It's about drawing conclusions from a sample size too small to conclude anything.
Signal groups on Discord and Telegram compound the problem. Someone posts a ticker with confidence, you buy it, and there's no historical record behind the call at all, just one person's opinion delivered at the right volume. If you can't answer "how many times has this exact setup worked before, and by how much," you're not trading a system. You're trading someone else's mood.
1. Start From a Backtested Screen, Not a Hunch
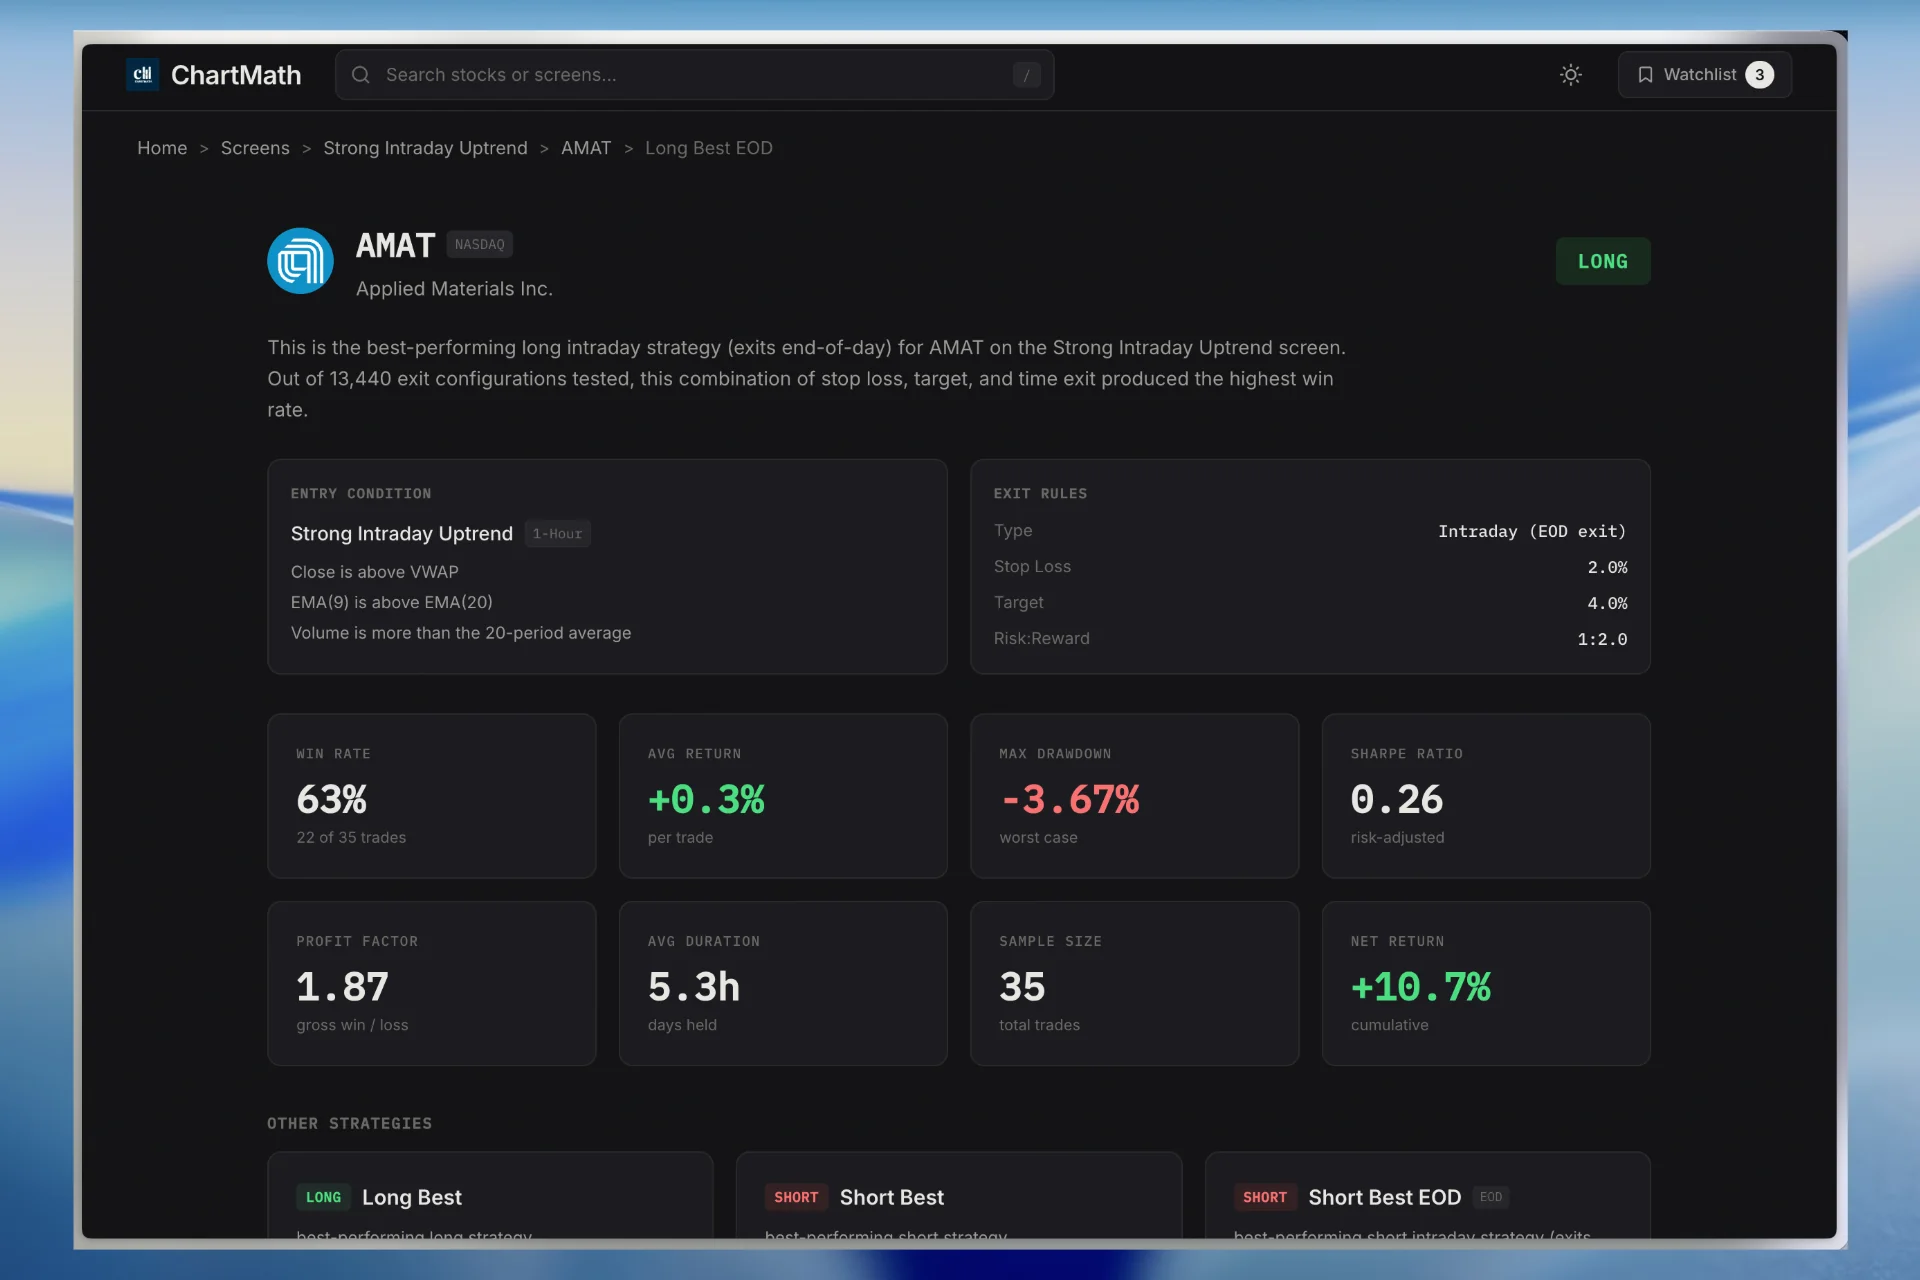
A backtested screen is a specific, repeatable rule, like "price reclaims VWAP on rising volume" or "a stock breaks its opening range high within the first 60 minutes," that has been run against historical data to produce a Win Rate and Avg. Return over a real sample of past occurrences. That's the entire foundation of systematic trading: instead of asking "does this look right," you ask "how has this exact pattern performed historically, and how many times has it happened."
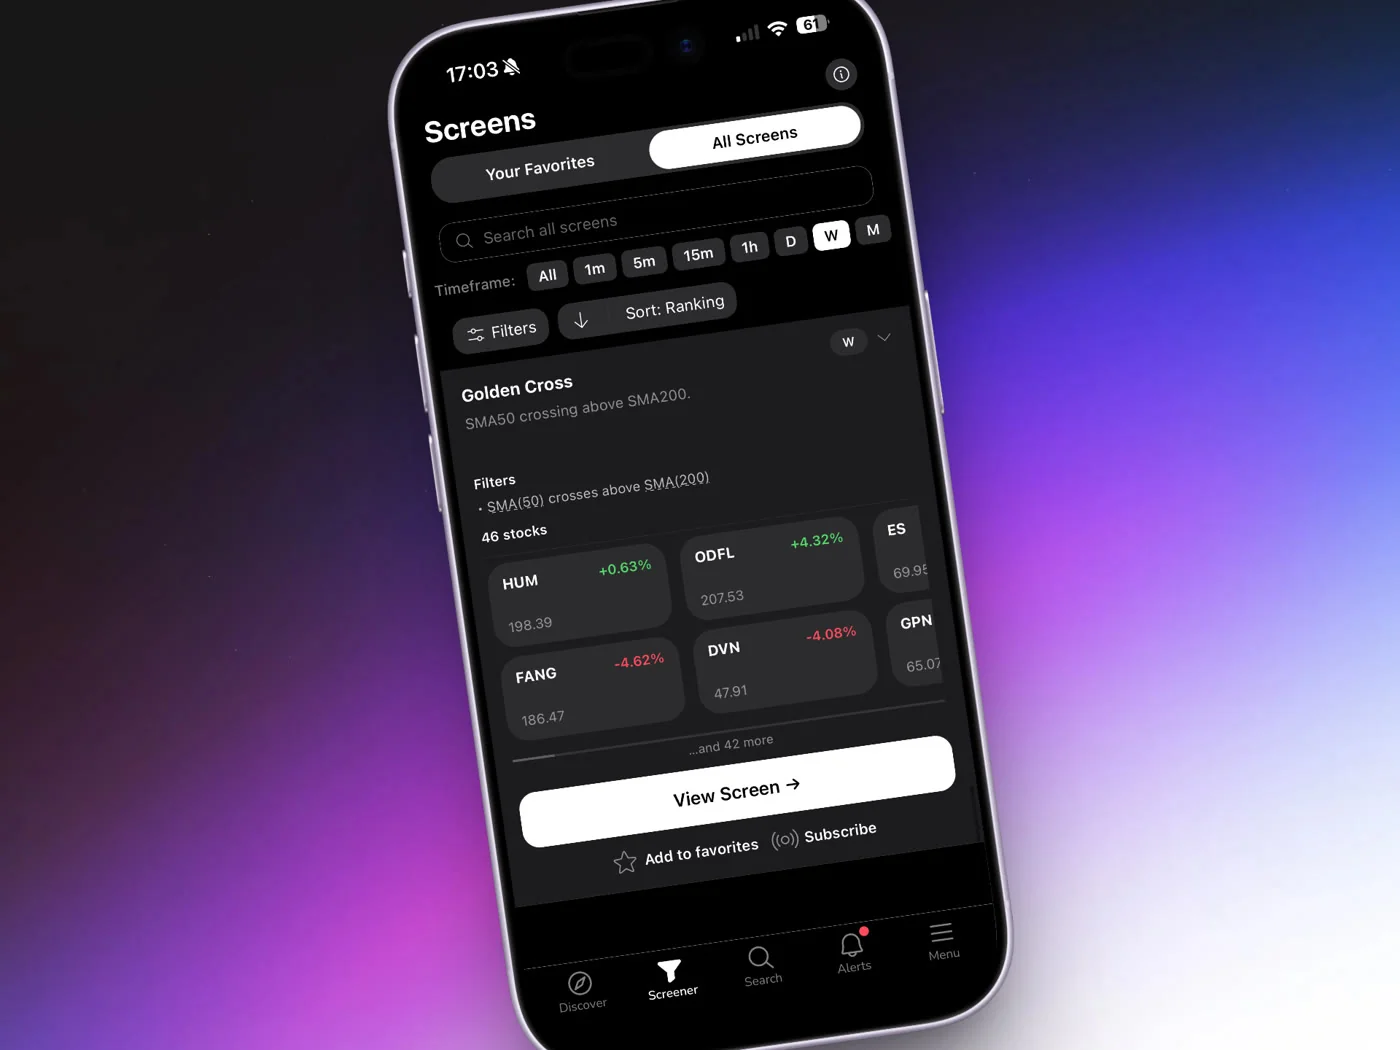
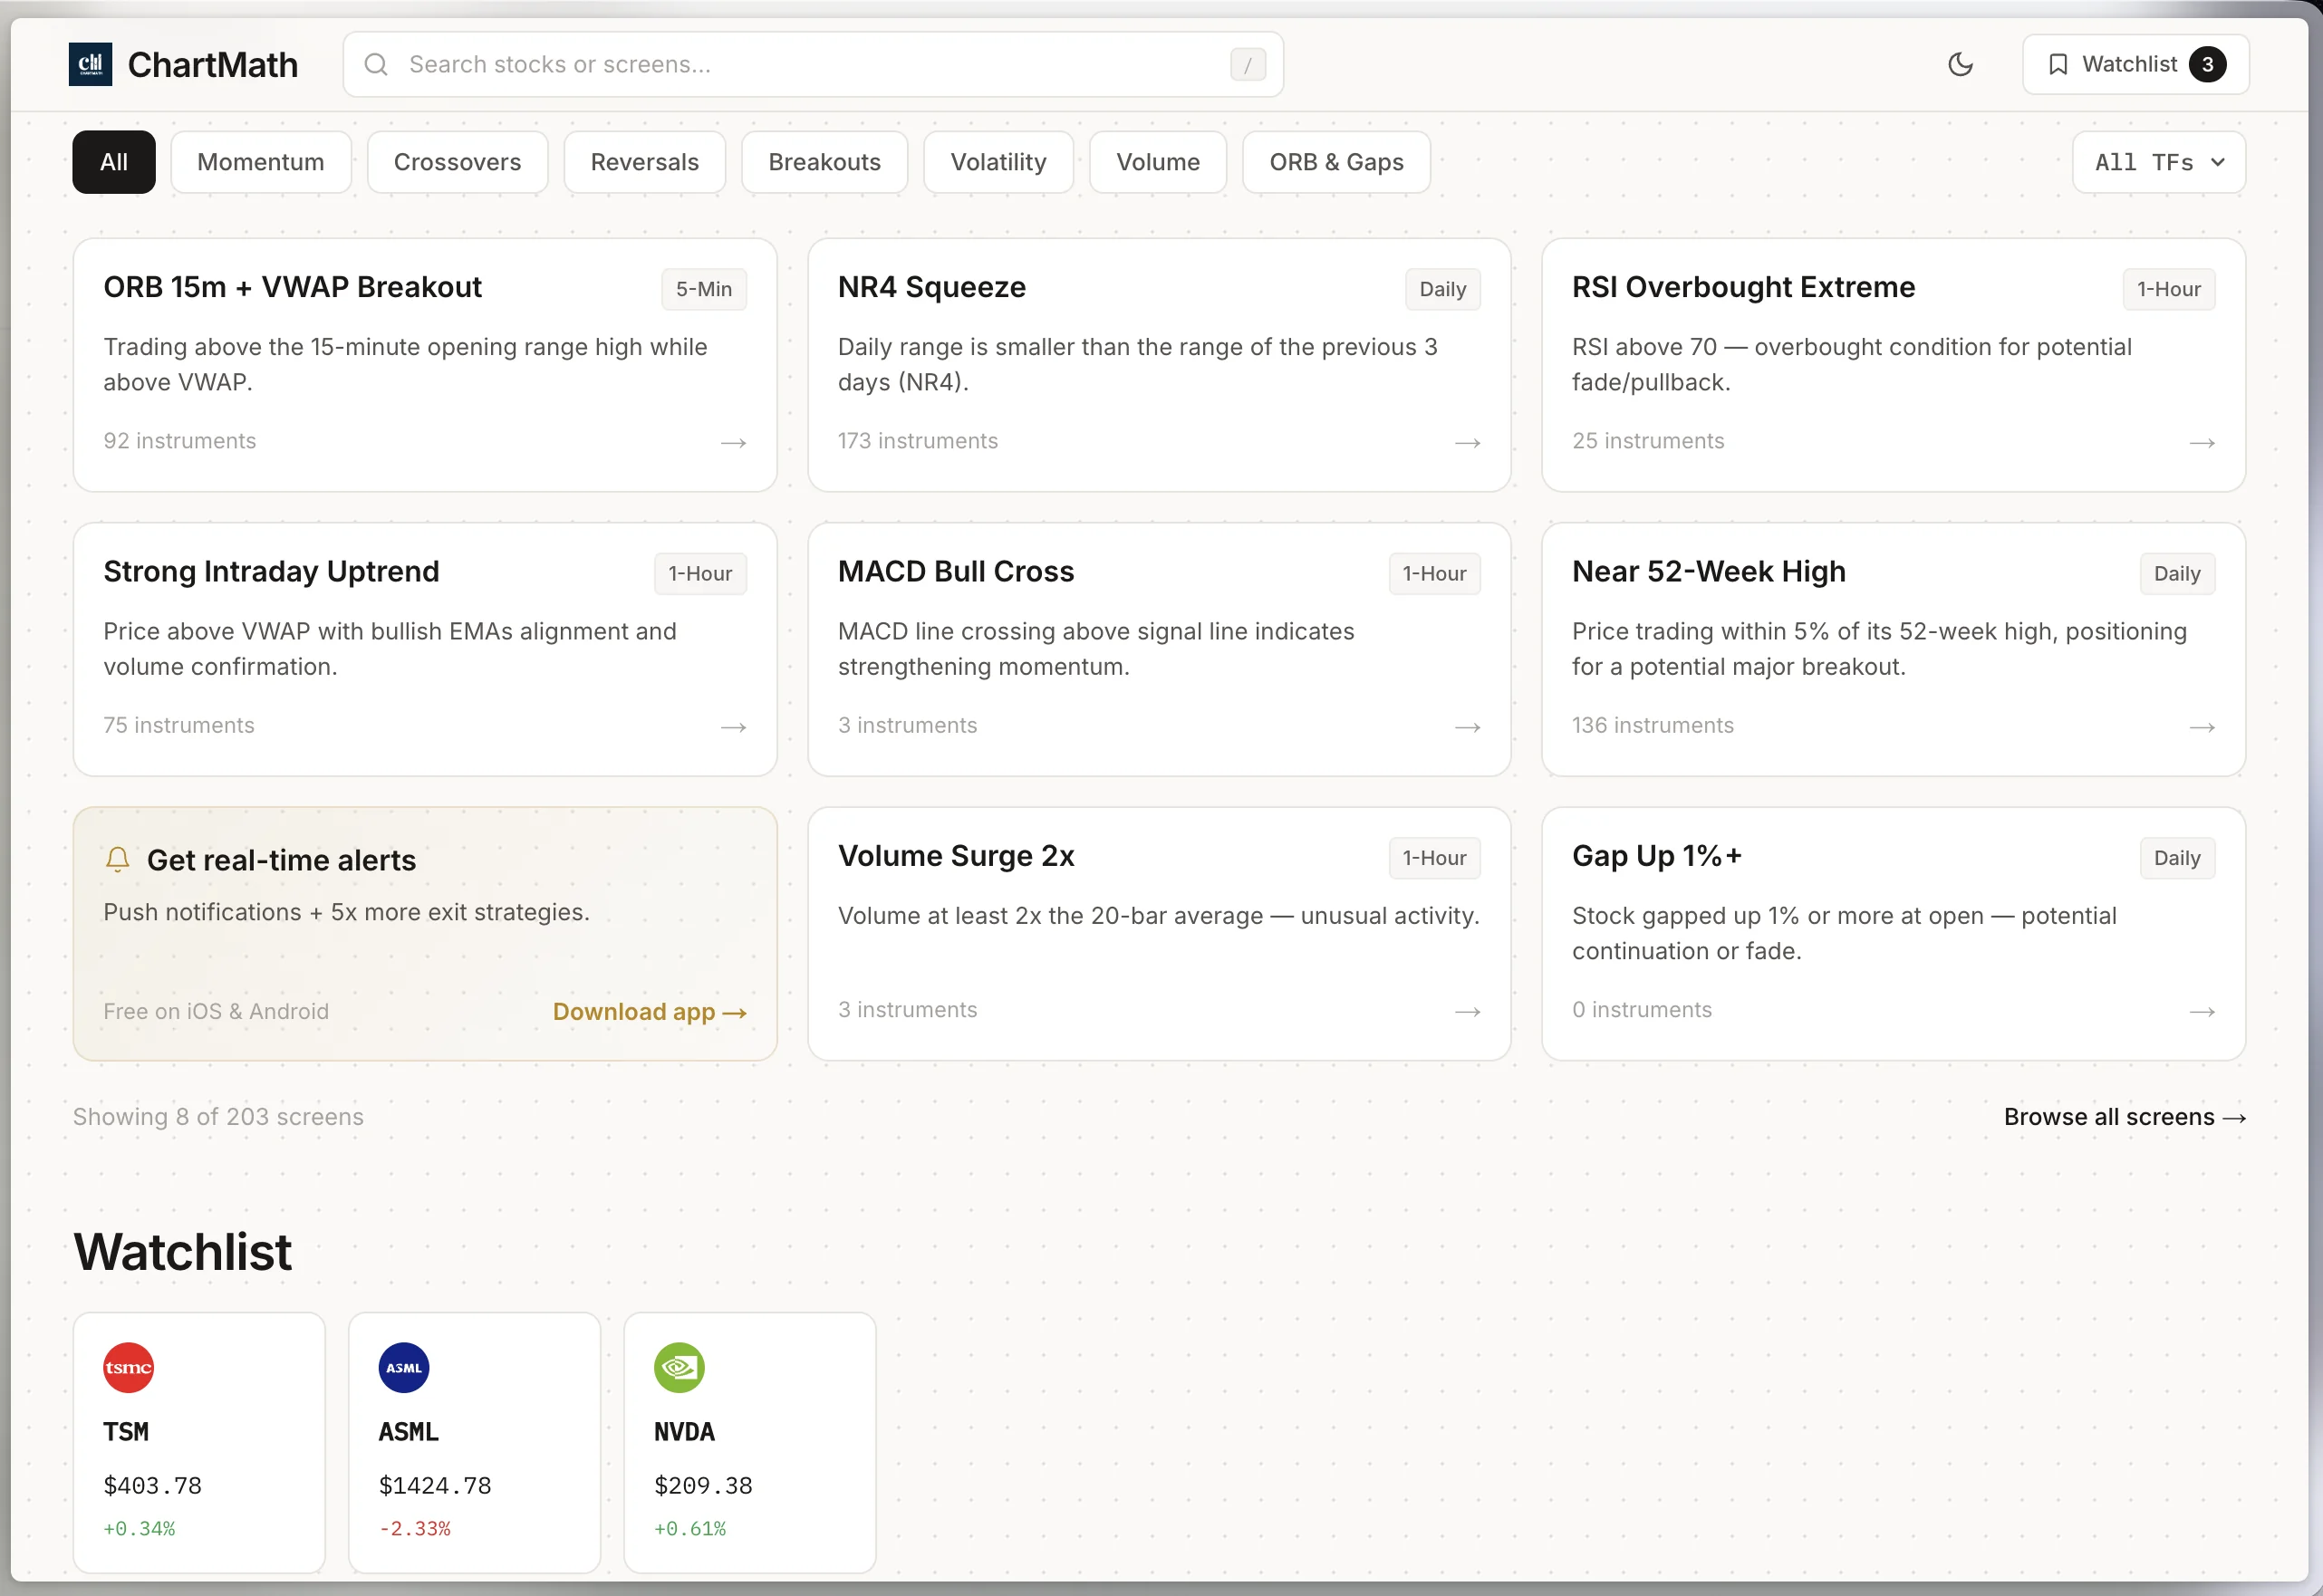
This is where a tool like ChartMath changes the beginner's starting point. Rather than building your own screen from scratch, which usually means learning Pine Script or wrestling with a scripting language before you've even placed a trade, ChartMath gives you 200+ curated, read-only technical screens across momentum, reversal, breakout, and volume categories. Every screen already has a documented Win Rate and Avg. Return attached, computed from actual historical matches. There's no builder to learn and no code to write. You just open a screen and see what currently matches.
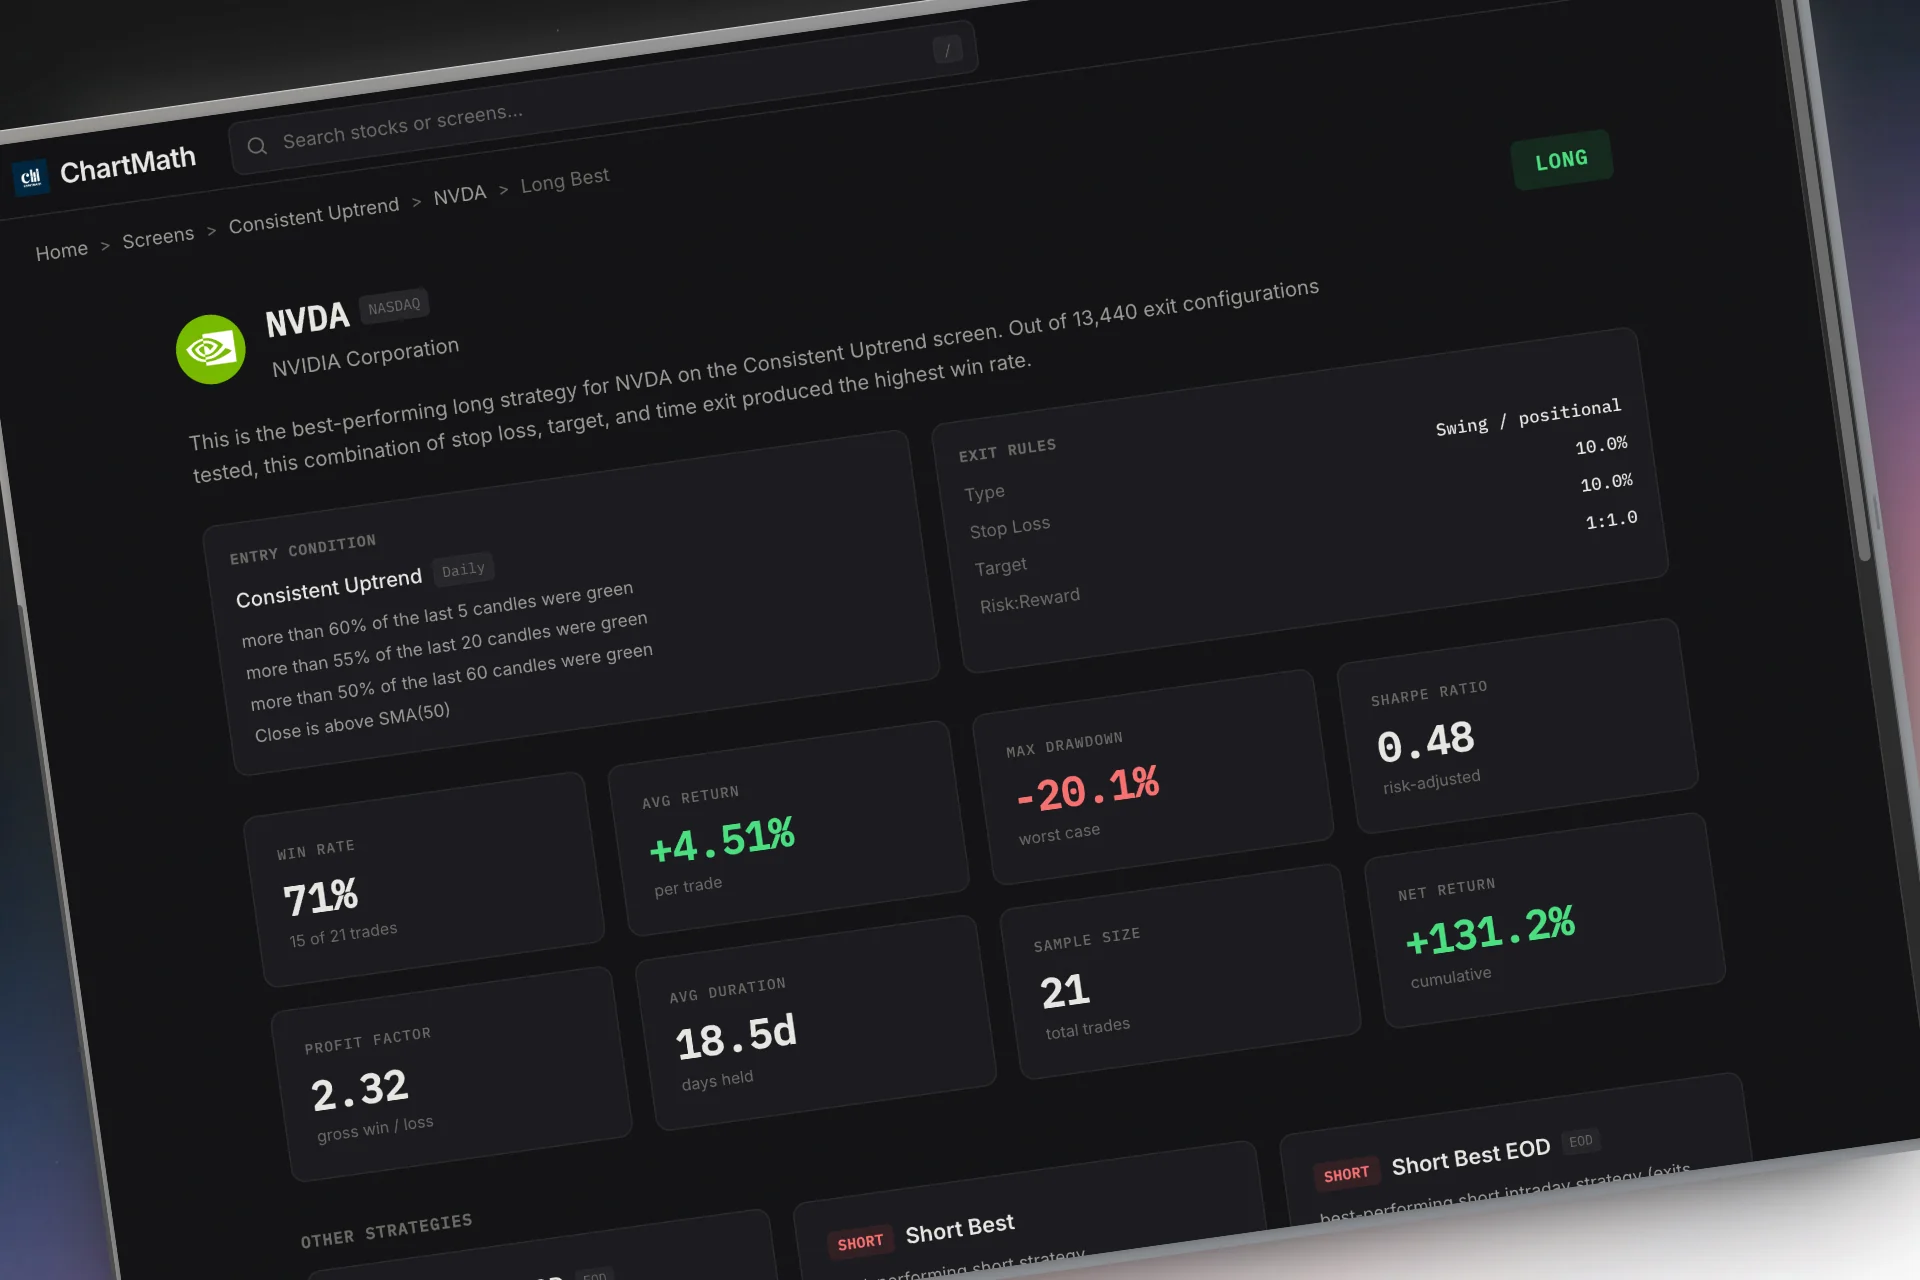
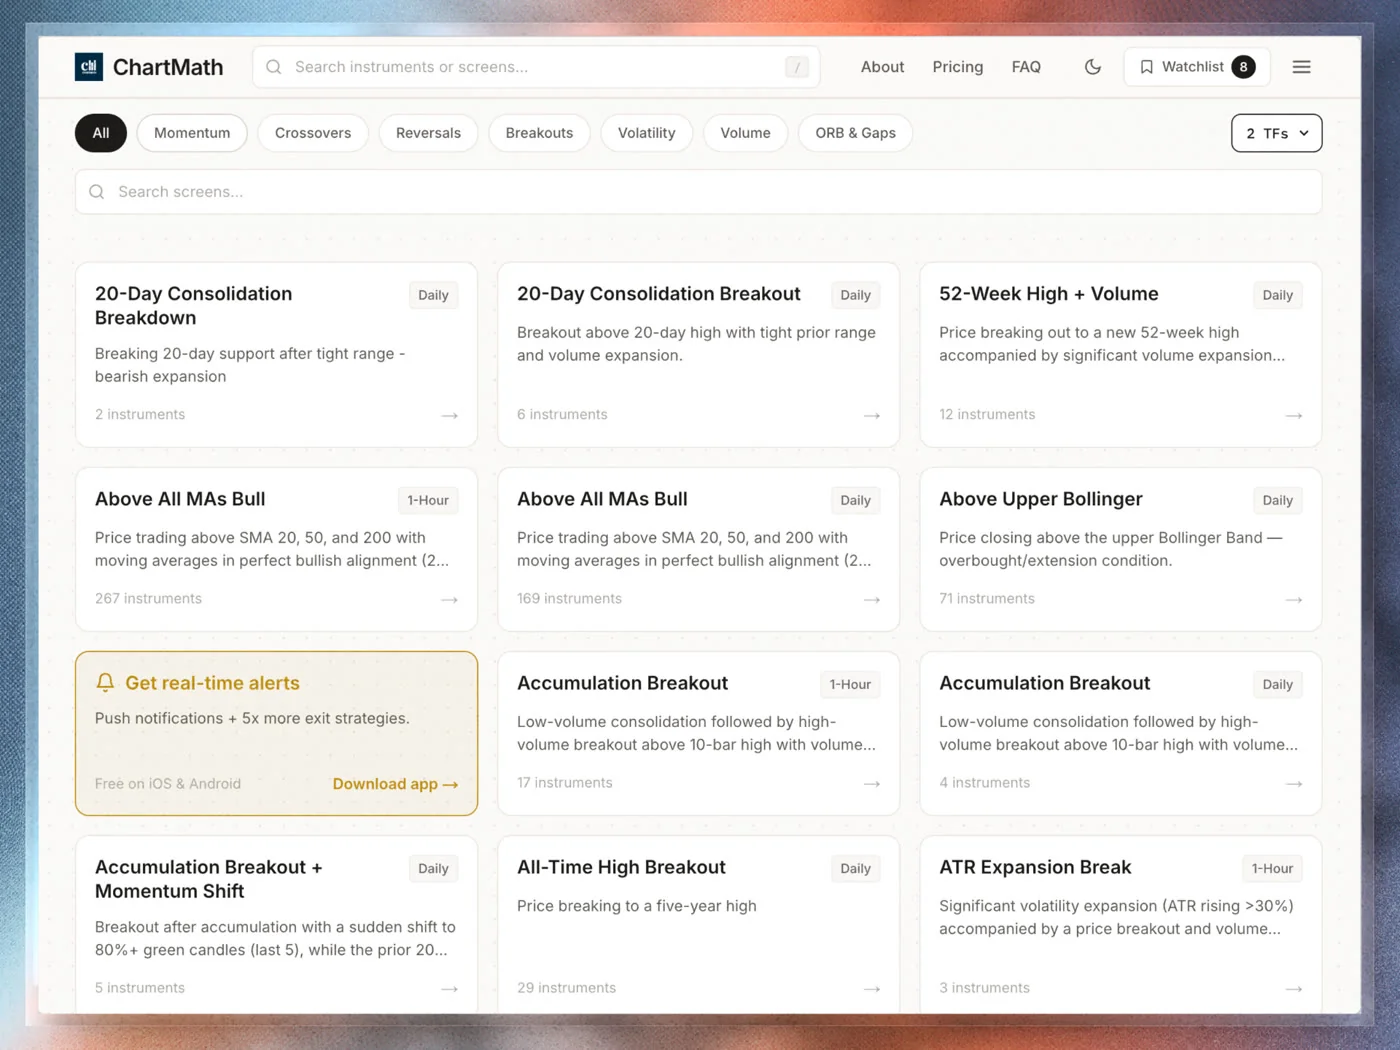
The screens run continuously across a curated universe of 500+ US equities, across 7 timeframes from 1-minute up to monthly. That's a meaningfully different starting point than a static screener you refresh by hand. Instead of scanning the "entire market" (which no retail tool actually does well), you're working from a defined, backtested universe where every match already comes with historical context.
If you've used stock screeners for day trading before and found the results confusing because there's no record of past performance, this is the gap a backtested screen closes. You can browse the full catalog through the screen catalog on the web before you ever open the mobile app, just to see how a screen's history is presented.
2. Understand the Signal Before You Trade It
Knowing that a setup fired is only half the job. A beginner who blindly follows an alert without understanding why it fired hasn't actually learned to trade, they've just automated their confusion. This is where plain-English explanations matter more for new traders than for anyone else on the platform.
Take two related searches beginners run constantly: what is relative volume in day trading, and what is a death cross in stocks. Relative volume, often shortened to RVOL, compares a stock's current trading volume to its typical volume at the same point in the day. A stock trading at 3x RVOL by 10 AM is seeing three times its normal interest, which is often the fuel behind a breakout or a reversal actually holding instead of fading; that spike is exactly what the 3x Volume Shock screen (1H) isolates. A death cross is a technical pattern where a shorter-term moving average, commonly the 50-day, crosses below a longer-term moving average, commonly the 200-day, and it's typically read as a signal that shorter-term momentum has turned bearish relative to the longer trend.
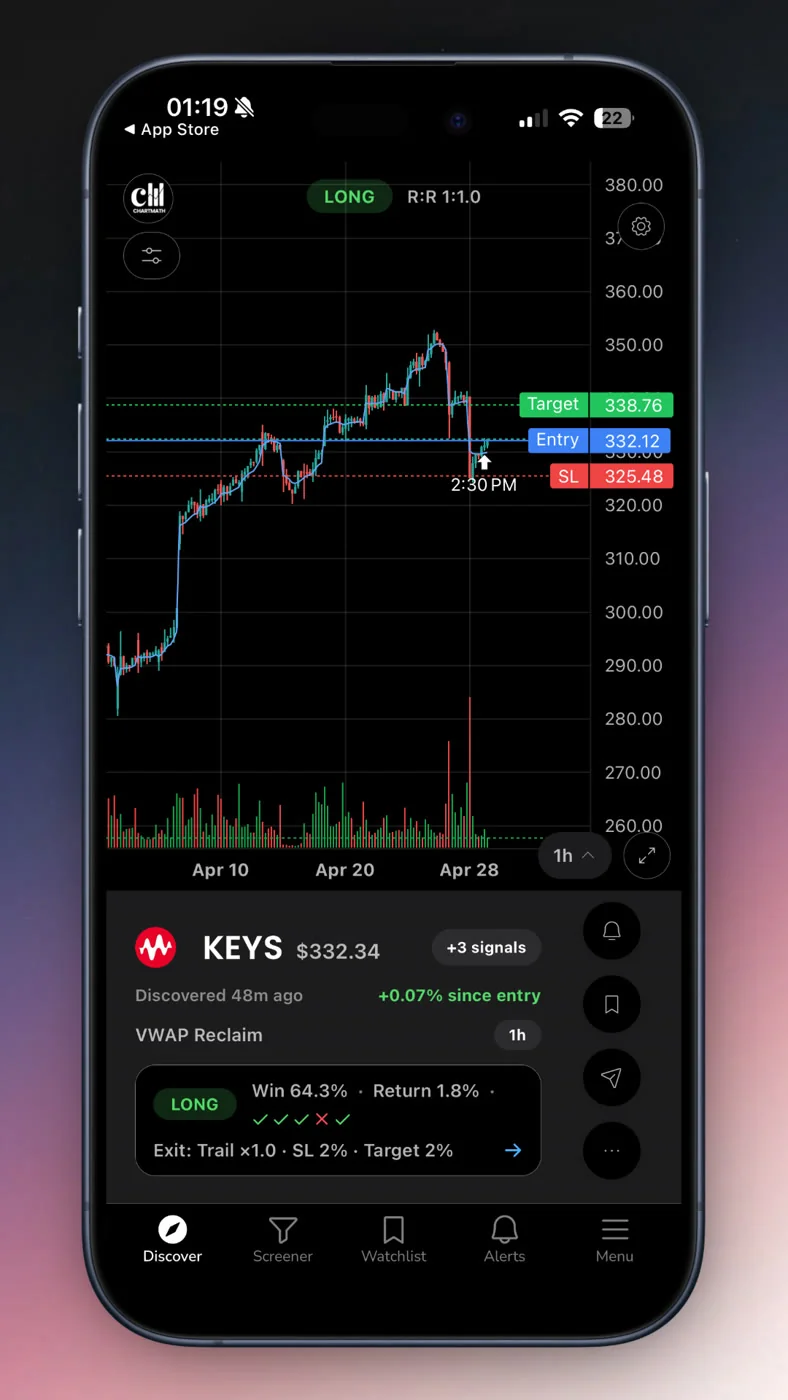
Neither of those terms means much in isolation. What matters for a systematic beginner is seeing the explanation attached directly to the alert: "TSM matched the ORB 60m Breakout screen because price cleared the opening range high on 2.4x average volume." That single sentence teaches you the mechanics of the setup every time it appears, which is exactly how you build real pattern recognition instead of just following instructions. This is also why reading a trading signal before you risk money is a skill worth developing deliberately, not something you skip past to get to the buy button.
3. Build a Watchlist That Works While You Do
Most beginners build a watchlist once and then forget it exists, or they check it manually a few times a day and hope they catch something. Neither approach is systematic. A working watchlist should be scanned continuously against your chosen screens, not glanced at when you remember.
Set up a focused list of tickers you actually care about, then let each one get checked against your screens automatically. When a match happens, that's when you find out, not on your next lunch break. This is the difference between passively watching a list and actively running a system: the system does the watching, you do the deciding.
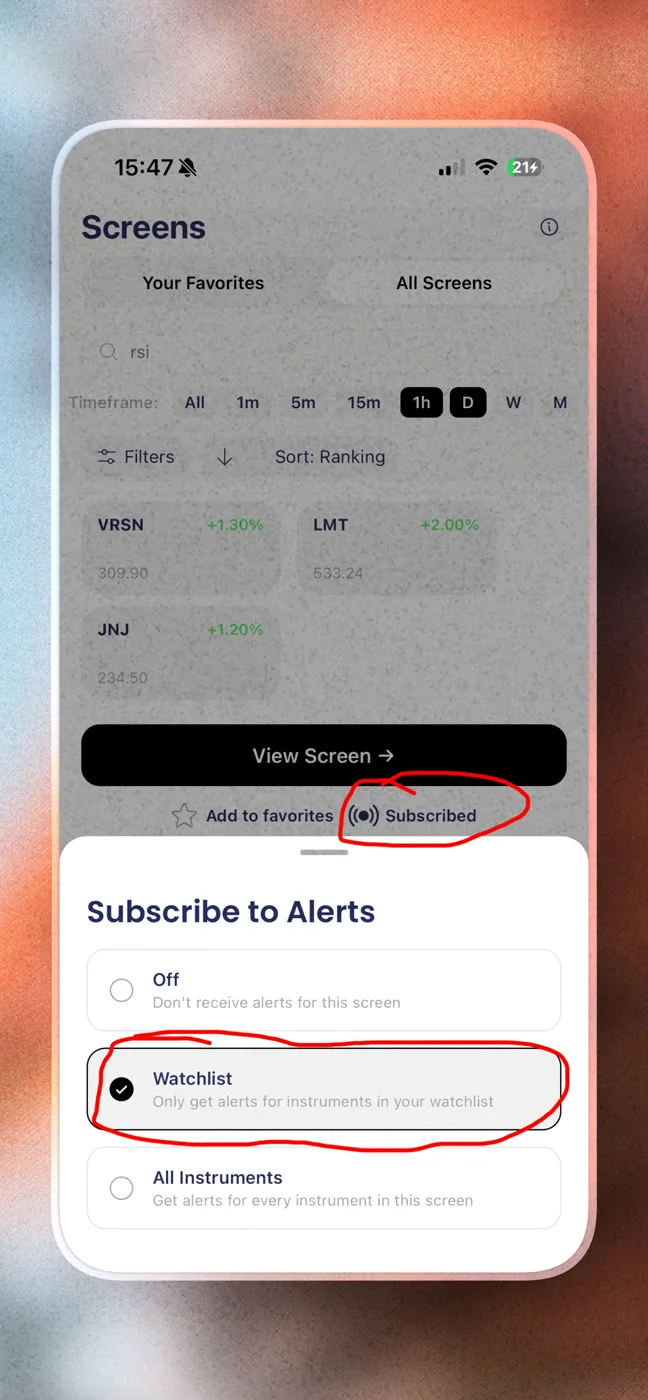
For traders juggling a day job, this matters even more. You don't need to watch a chart from 9:30 to 4:00 to trade systematically. You need a defined watchlist, a defined set of screens, and a delivery mechanism that reaches you wherever you are. ChartMath delivers alerts via push notification and email, so a match on your watchlist reaches your phone whether you're in a meeting or between errands. If you're trying to build this habit around a full-time schedule, swing trading with a full-time job covers the routine side of that in more depth.
4. Let Alerts Replace the Refresh Habit (Without Causing Alert Fatigue)
The temptation once you've set up alerts is to add every screen to every ticker, which leads straight into alert fatigue. If your phone buzzes forty times a day with low-quality matches, you'll start ignoring alerts entirely, which defeats the entire point of building a systematic process in the first place.
Good alert design includes hygiene, not just delivery. That means de-duplication so you don't get pinged five times for the same match, throttling so a volatile ticker doesn't flood your notifications, a cap on alerts per bar, and quiet hours so you're not getting pushed a 2 AM crypto alert when you're asleep. These aren't cosmetic features, they're what keeps a systematic approach usable instead of exhausting.
It's worth repeating the core boundary here: this is copilot, not autopilot. The alert tells you a ticker matched a screen and explains why. Nothing fires on its own. When you decide a match is worth taking, you tap to place the order yourself, with the stop and target already filled in from the screen’s rule and the share count derived from the risk you set. The system's job ends at "here's the evidence," your job is the decision. If you want a deeper look at fitting alerts into an existing routine, integrating trading alerts with your charting platform walks through pairing alerts with a tool like TradingView for the actual chart work.
5. Size Every Position Before You Enter
A systematic entry means nothing if your position sizing is still emotional. Beginners often size trades based on conviction, "I really like this one" gets a bigger position than "this is just okay," which is exactly the kind of inconsistency systematic trading is supposed to eliminate.
The common guideline traders use is risking a small, fixed percentage of the account, often cited around 1-2% per trade, and calculating share size from that number rather than from a gut feeling. If your stop is $2 away from your entry and you're risking 1% of a $10,000 account, that's $100 of risk, which caps your position at 50 shares. That math takes ten seconds and removes the guesswork entirely.
The benefit compounds once it's paired with a backtested screen. If a setup has a documented Win Rate and Avg. Return over a real sample, and you're sizing every trade the same way, your results start to reflect the actual edge of the strategy instead of the noise of inconsistent bet sizing. For a full walkthrough of the math, how to build an efficient trading workflow covers sizing alongside the rest of the process.
6. Track Results by Sample Size, Not by Feelings
This is the step beginners skip most often, and it's the one that actually makes a system a system. Every trade you take against a given screen should get logged: entry, exit, result, and which screen triggered it. Not so you can feel good or bad about individual trades, but so you can eventually compare your real results against the screen's documented historical Win Rate and Avg. Return.
Four or five trades won't tell you anything. You need dozens of occurrences before you can honestly say whether you're executing a setup well or whether the setup itself needs to be dropped from your rotation. This is uncomfortable for beginners who want quick validation, but it's the only honest way to know if you're actually trading a system or just narrating a string of coincidences after the fact.
Build in a fixed weekly checkpoint to do this review instead of trying to judge yourself trade by trade in real time. A short, structured weekly review is enough to catch drift, situations where you've quietly started deviating from the screen's rule without realizing it. Running a weekly trading review in 20 minutes is a practical template for exactly this habit.
How to Scan for Pre-Market Movers Without Guessing
One of the most common beginner questions is how to find pre-market movers, stocks gapping before the open, without just refreshing a list and guessing which gaps will hold. The systematic answer is the same as everywhere else in this guide: treat gap scanning as one category among many defined screens, not a separate manual ritual you run from scratch every morning.
A Gap Up 1%+ screen (daily) works the same way as any other backtested setup. It has a defined rule (price gaps beyond a certain percentage from the prior close, often paired with elevated pre-market volume), and it has a historical Win Rate and Avg. Return attached to that exact rule. Instead of eyeballing a list of forty gapping tickers and guessing which ones are worth watching, you check which ones matched a specific, pre-validated gap screen, and you already know how that pattern has behaved historically before the bell even rings.
This is a good example of why a curated, backtested screen beats a raw scanner. Anyone can build a filter for "stocks up more than 5% pre-market." Knowing whether that filter has actually produced tradeable follow-through historically is a different problem entirely, and it's the one systematic trading is built to solve.
Common Beginner Questions
What is a death cross in stocks?
A death cross happens when a shorter-term moving average, most commonly the 50-day, crosses below a longer-term moving average, most commonly the 200-day, the rule behind the Death Cross screen (daily). It's a widely watched technical signal that shorter-term momentum has weakened relative to the longer trend, though like any single indicator, it works best as part of a broader, backtested rule rather than as a standalone trigger.
How is a backtested screener different from a general market scanner?
A general scanner, the kind you'd build in a tool like Finviz or compare against something like Edge to Trade, filters stocks by criteria you set: price, volume, sector, and so on. It tells you what currently matches a filter. A backtested screener goes a step further and tells you how that exact pattern has performed historically, with a Win Rate, Avg. Return, and sample size attached. The filter tells you what. The backtest tells you whether it's ever mattered.
How long before a beginner can actually trust a systematic approach?
It depends on how often the setup occurs, not on the calendar. A setup that fires daily might give you a meaningful sample within a month or two of tracking. A setup that only fires a few times a month could take longer. The rule of thumb is to judge by number of resolved occurrences, ideally dozens, not by how many weeks have passed since you started.
Putting It Together: Your First Systematic Trading Week
Here's how the pieces fit into an actual week, start to finish. Monday morning, open ChartMath and pick two or three screens that match your style, momentum, breakout, or reversal, rather than trying to trade all 200+ at once. Add a handful of tickers you actually follow to a focused watchlist and let the screens run against them continuously.
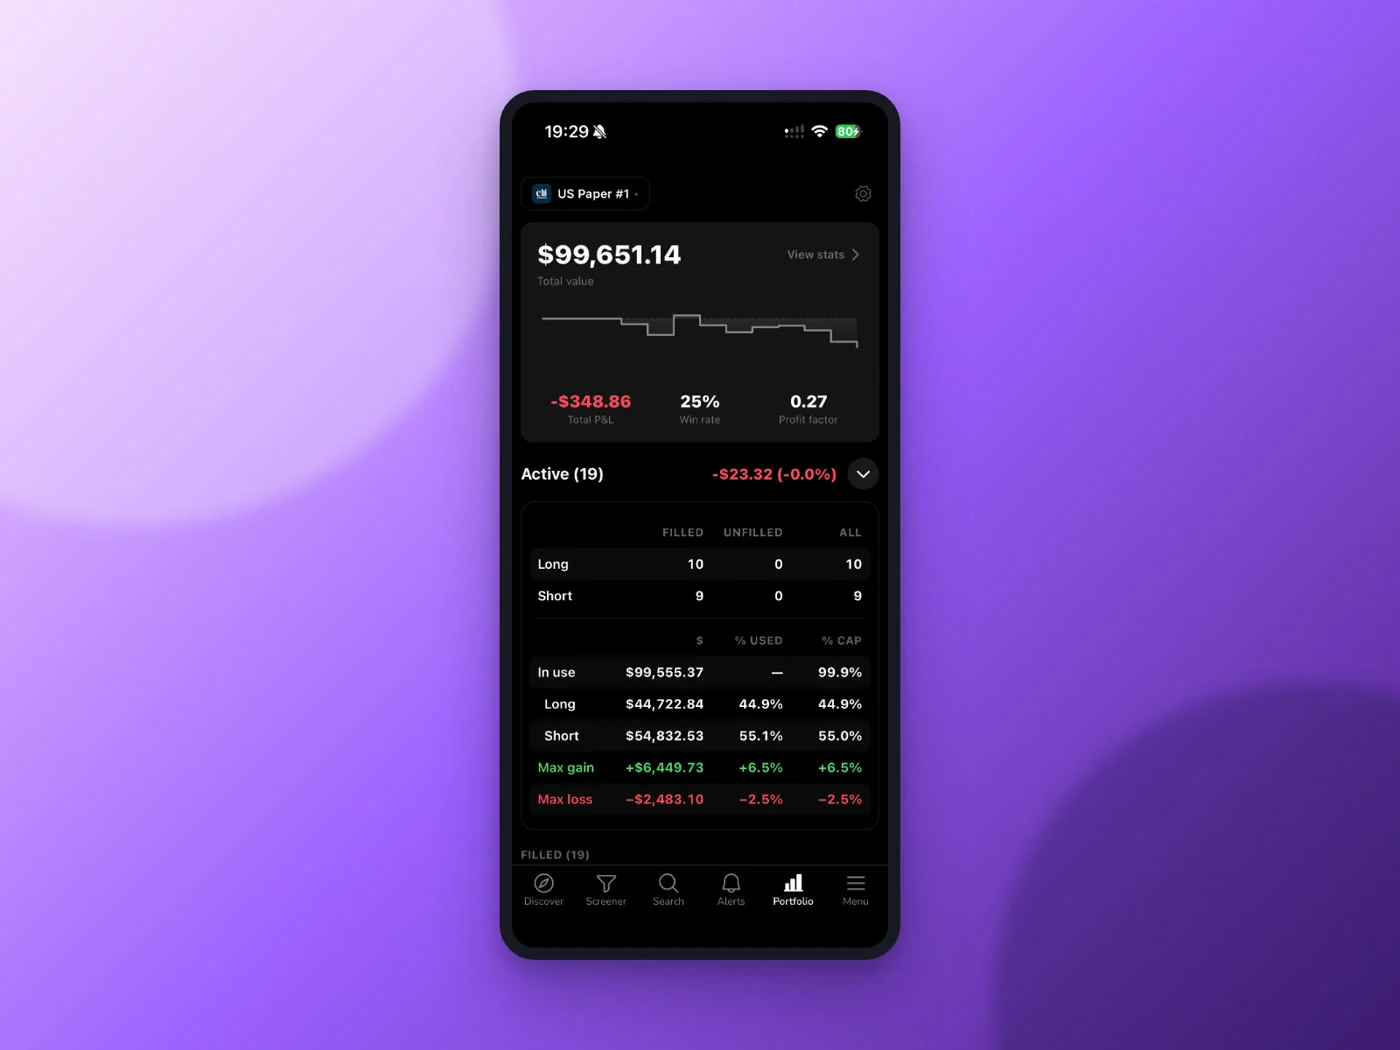
When an alert lands, push or email, read the plain-English reason before you do anything else. Confirm it matches the screen's documented rule, not just a vibe. Size the position using your fixed risk percentage, not your excitement level. Place the order yourself, with the stop and target pre-filled from the rule rather than typed in the moment. Log the result. Repeat for every match, every day, without changing the rule mid-week because one trade didn't go your way.
On Sunday, review the week: how many trades matched each screen, how your results compare to the screen's historical Win Rate and Avg. Return, and whether you actually followed the rule or drifted from it under pressure. That review is what turns a week of trades into an actual system instead of a diary of guesses.
If you want to see this whole loop before committing to it, you can open the VWAP Reclaim screen (1H) and read its rule and its backtested record before you commit to anything. When you're ready to run it yourself, download the ChartMath app and start scanning a curated, backtested universe instead of refreshing a static list. And if you'd rather browse the setups first on a bigger screen, the screen catalog lets you explore all 200+ screens before you ever open your phone. Systematic trading isn't about predicting the market perfectly. It's about making sure every decision you make has a rule and a record behind it, so next month's results actually tell you something the last five trades never could.
Recommended Resources
- Watch Demo
- Web Based Screener

See these setups live in ChartMath
200+ curated screens with backtest data. Free. No credit card required.