How to Integrate a Stock Screener Into Your Daily Routine
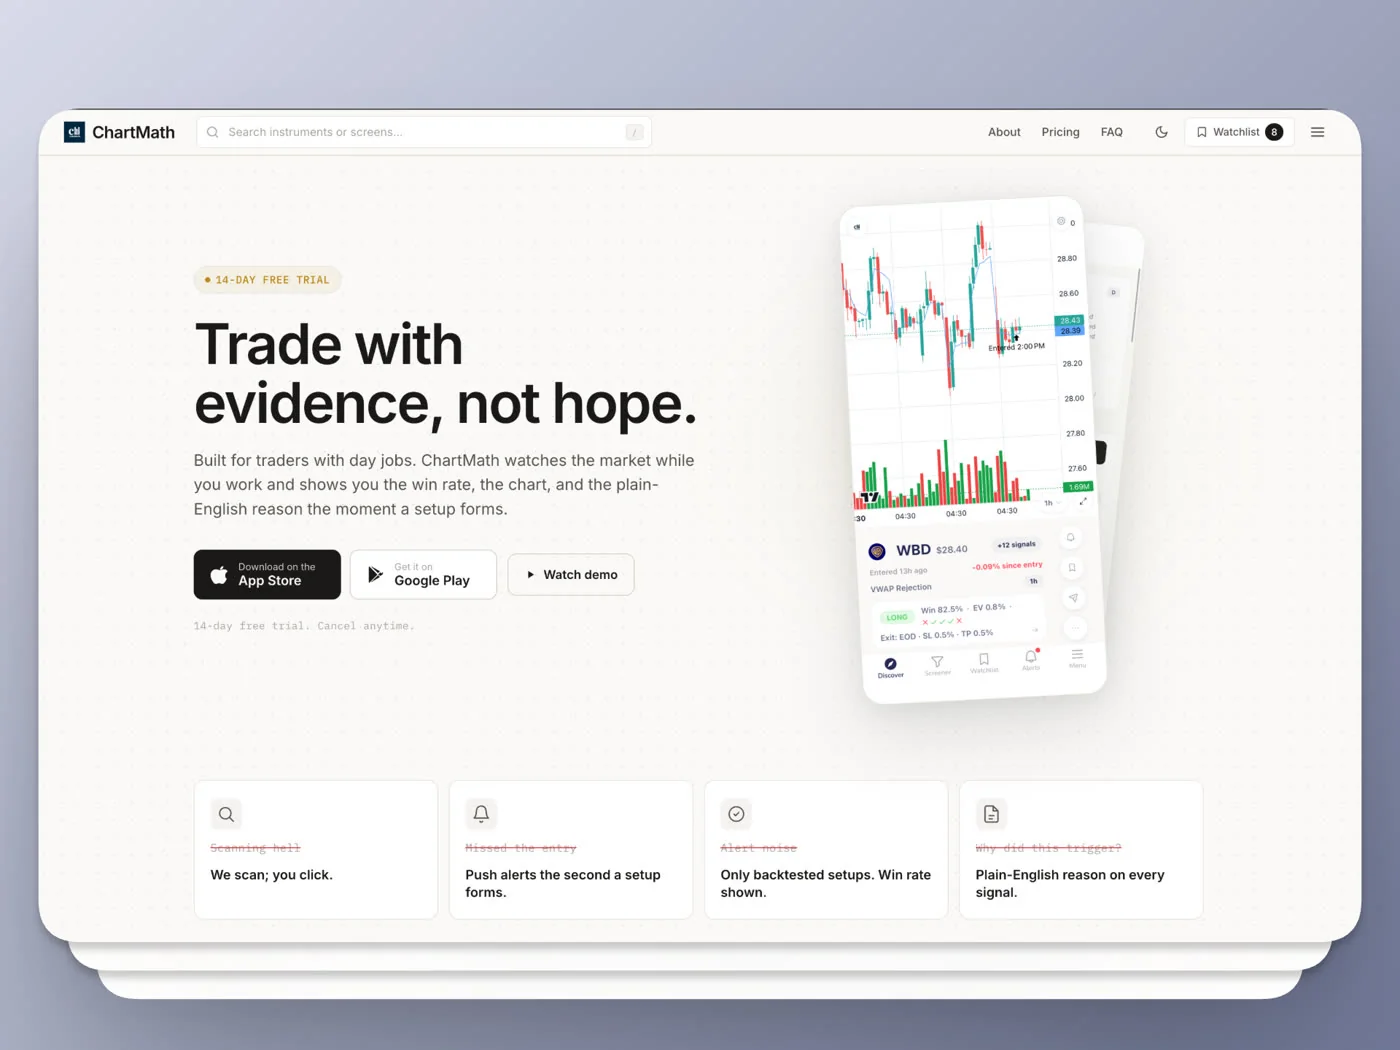
The fastest way to integrate a stock screener into your daily trading routine is to stop treating it like a browser tab you refresh and start treating it like a filter that runs continuously in the background, one that pings you at three fixed checkpoints: premarket, intraday, and end-of-day. Instead of watching charts, you watch three short windows a day and let backtested screens and push alerts do the scanning between them.
Key Takeaways
- Three checkpoints, not eight hours: A premarket shortlist (10-15 minutes), intraday alert checks (2-3 minutes each time your phone buzzes), and an end-of-day review (10-15 minutes) replace all-day chart watching.
- Alerts do the watching, you do the deciding: Screen-enter alerts on favorited setups mean the screener monitors 500+ US equities across 7 timeframes so you don't have to stare at a monitor.
- The watchlist is a filter, not a dumping ground: A focused list of 10-20 tickers, screened against 200+ backtested setups, beats a sprawling list you never actually check.
- Push and email only, no SMS: Keep alert channels lean to avoid the noise that leads to alert fatigue and missed real signals.
- Backtested Win Rate and Avg. Return replace gut feel: Every screen carries historical context, so the "why" behind an alert is visible before you risk capital.
Daily Screener Routine at a Glance
| Time Block | Task | Tool / Surface | Time Needed |
|---|---|---|---|
| Premarket (7:00-9:30 AM ET) | Run 2-3 curated screens, build shortlist | Screener + Watchlist | 10-15 min |
| Market open (9:30-10:00 AM ET) | Confirm shortlist names against live price action | Mobile app / chart | 5-10 min |
| Midday (10 AM-3 PM ET) | Respond to push/email alerts as they fire | Push notification, email | 2-3 min per alert |
| Close (3:30-4:00 PM ET) | Check for late-day setups (ORB, VWAP reclaim) | Screener | 5 min |
| End-of-day (after 4:00 PM ET) | Review triggered alerts vs. outcomes, log lessons | Alerts history, watchlist | 10-15 min |
| Weekly (weekend) | Prune watchlist, re-check screen performance | Screener catalog | 15-20 min |
Most people never get past step one of this. They download a screener, run it once, get excited about a match, and then forget to open the app again until the following weekend. That's not integration, that's a one-time query. A real routine means the screener touches your day at predictable moments, not randomly whenever you remember it exists.
Why Most Traders Never Actually Integrate Their Screener
Here's the pattern: you sign up for a scanner, bookmark it, and treat it like a search engine you visit when you feel like trading. Then a job, a meeting, or a Tuesday afternoon slide deck gets in the way, and the screener sits untouched for three days. When you finally open it again, you're staring at forty tickers with no idea which ones still matter.
The deeper issue isn't laziness. It's that most screeners were built as static research tools, not as something that plugs into a workday. Finviz gives you a filtered list, but you have to keep coming back to check it. TradingView's screener is powerful, but pairing it with real-time alerts often means stitching together a separate alerting service or writing your own Pine Script conditions. Every extra step is a place where the routine breaks.
There's also a noise problem. Traders who join unvalidated signal groups on Discord or Telegram end up drowning in calls with no track record attached, which is a fast route to alert fatigue: so many pings that you start ignoring all of them, including the ones that matter. A screener only earns a permanent seat in your routine if it filters aggressively and explains itself, so every alert is worth opening.
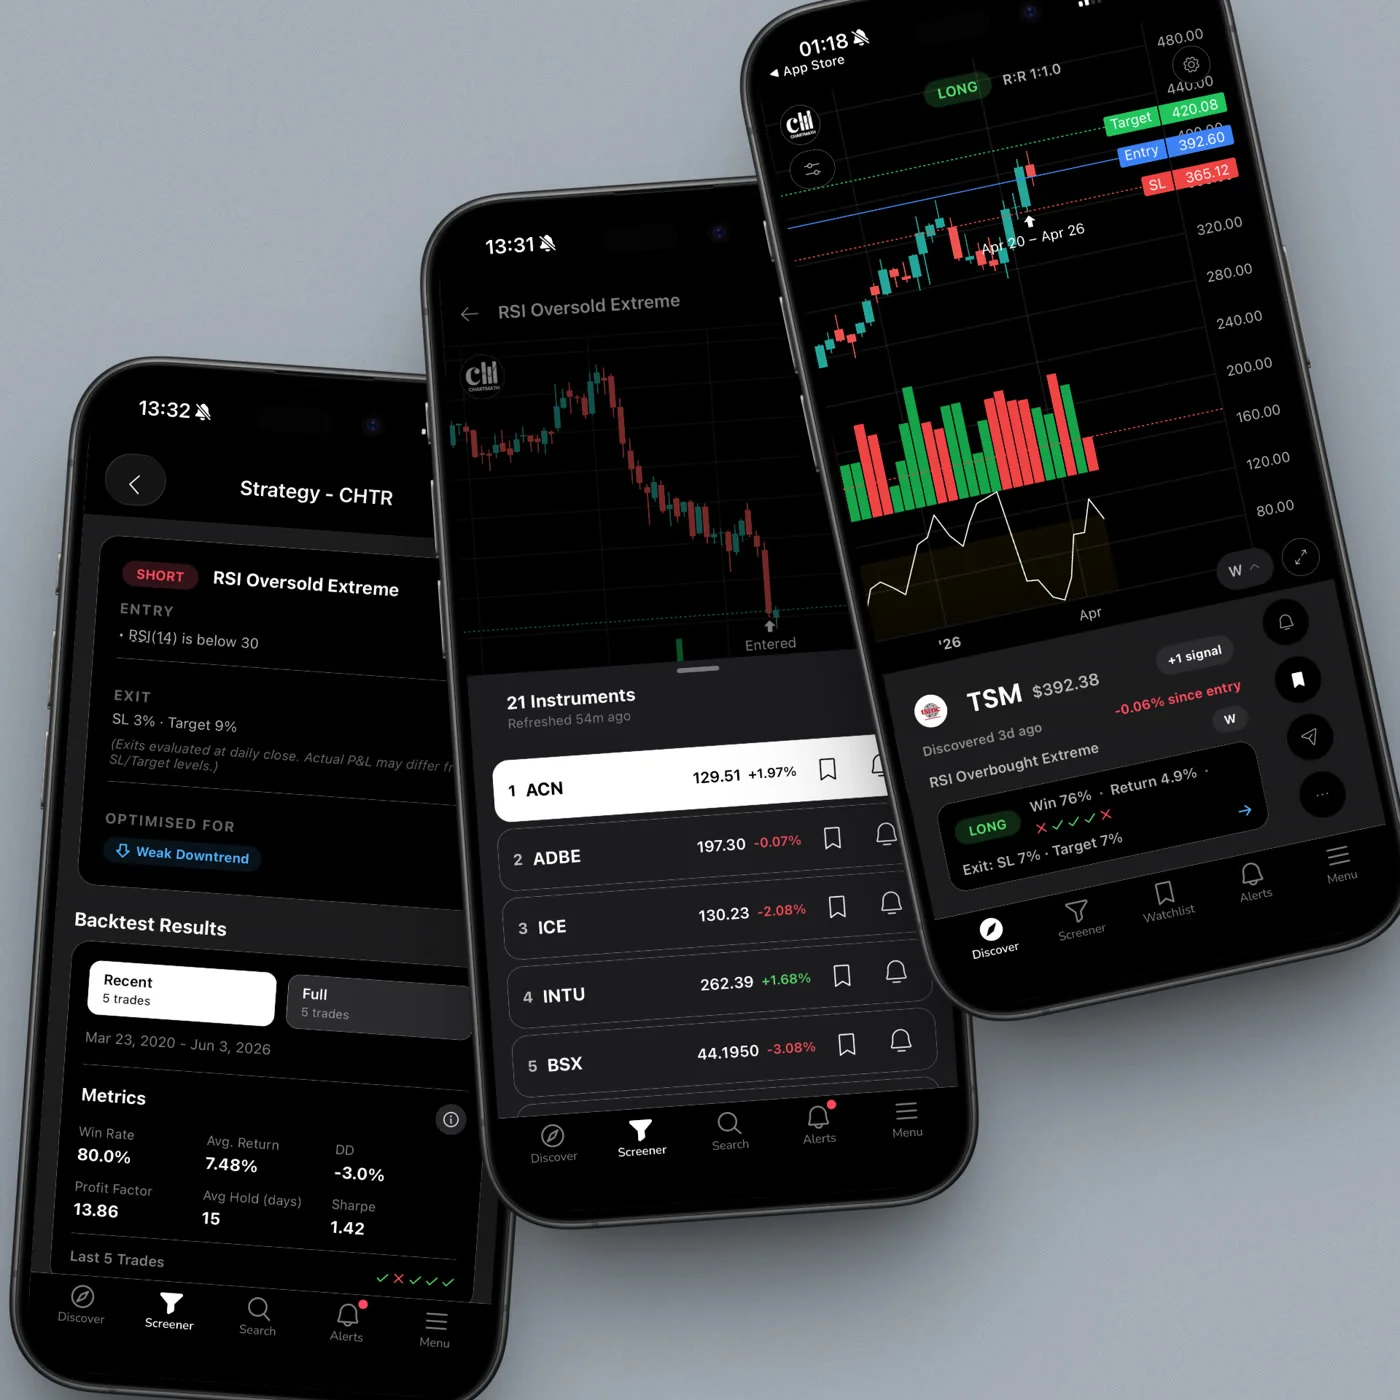
ChartMath's approach to trading without watching the screen all day is built around exactly this gap: 200+ curated, backtested screens run continuously across your chosen universe, and instead of you checking on them, they check on you.
1. Build Your Premarket Shortlist in Under 15 Minutes
Before the opening bell, your only job is to build a short, ranked list of names worth watching that day. This is not the time to scroll fifty charts. Pick two or three screens that match your style, run them, and pull the matches straight into your watchlist.
A gap screen and a relative volume screen, such as the gap up 1% screen (daily), are a strong starting pair for most swing traders. Relative volume (RVOL) compares a stock's current volume to its typical volume at the same point in the session; a stock trading at 3x RVOL by 9:35 AM is telling you something real is happening, not just noise. Add a breakout or VWAP reclaim screen and you have a shortlist built from evidence instead of a stock-twits scroll.
- Open the screener and run your 2-3 chosen setups (for example, Gap Up 1%+, RVOL spike, or Above 20/50 EMA).
- Add anything that matches to your single watchlist, not a separate spreadsheet or ten open tabs.
- Favorite the screens you trust so the app keeps watching them after you close it.
- Turn on screen-enter alerts for those favorited screens, so a ticker entering the setup later in the day pushes a notification instead of requiring a manual re-check.
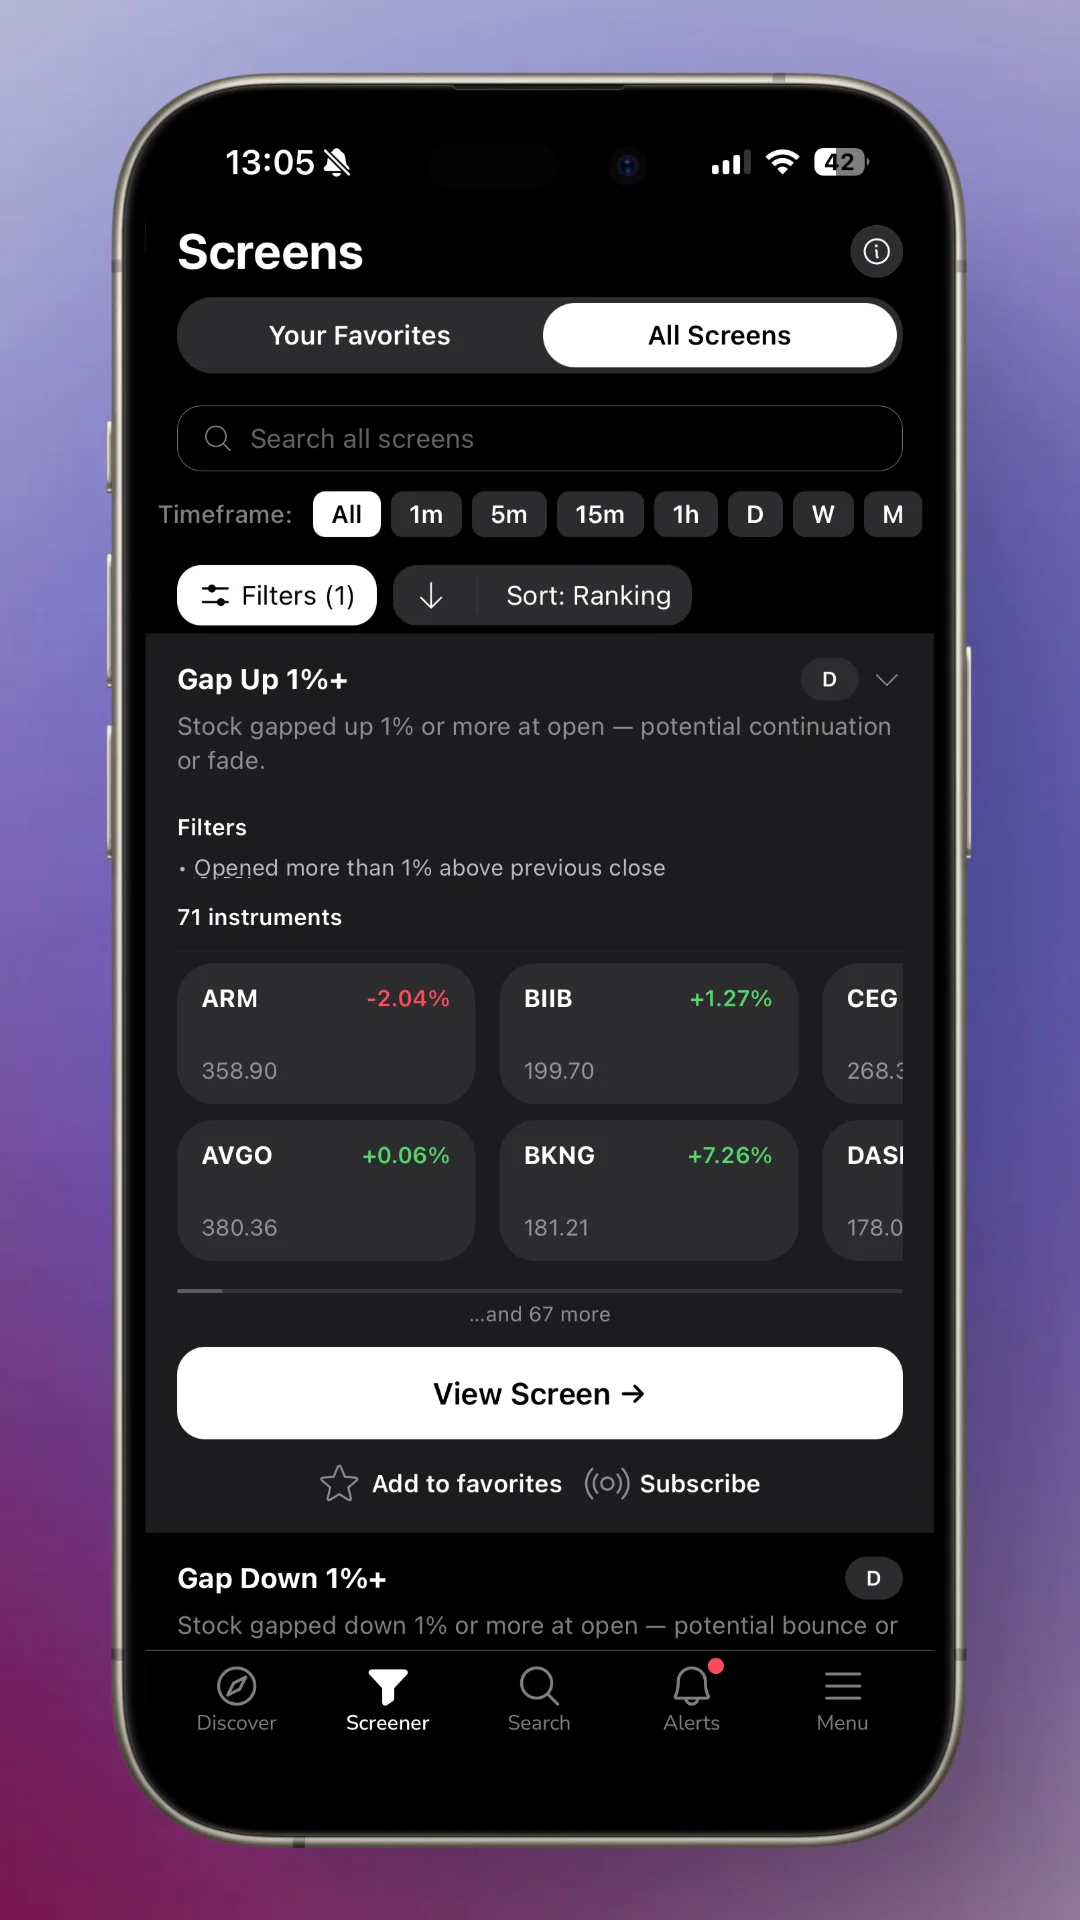
This step takes 10 to 15 minutes if you keep it disciplined. If you want a deeper look at how relative volume and other premarket filters work together, our guide to using RVOL and volume spikes breaks down which readings are worth acting on before the open.
2. Let Push and Email Alerts Run the Intraday Session
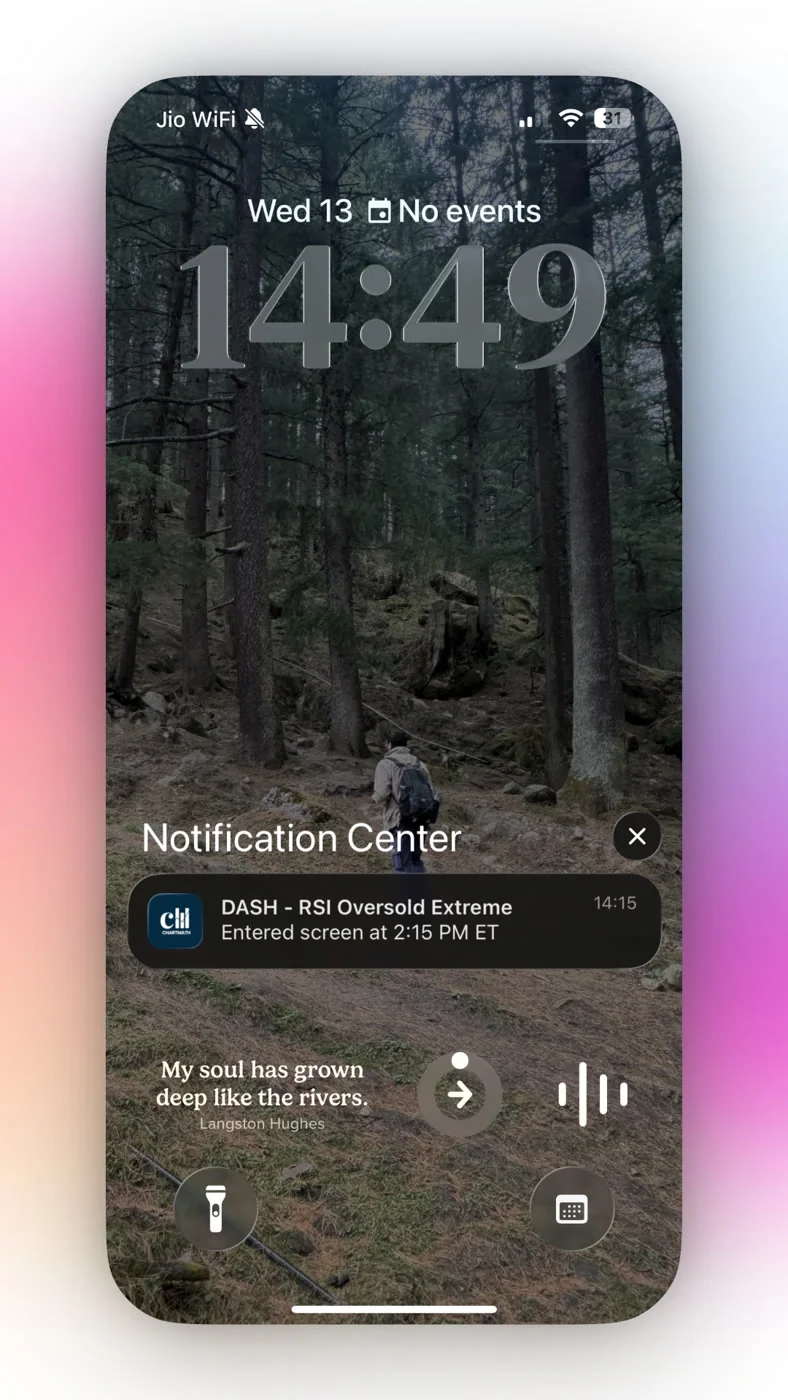
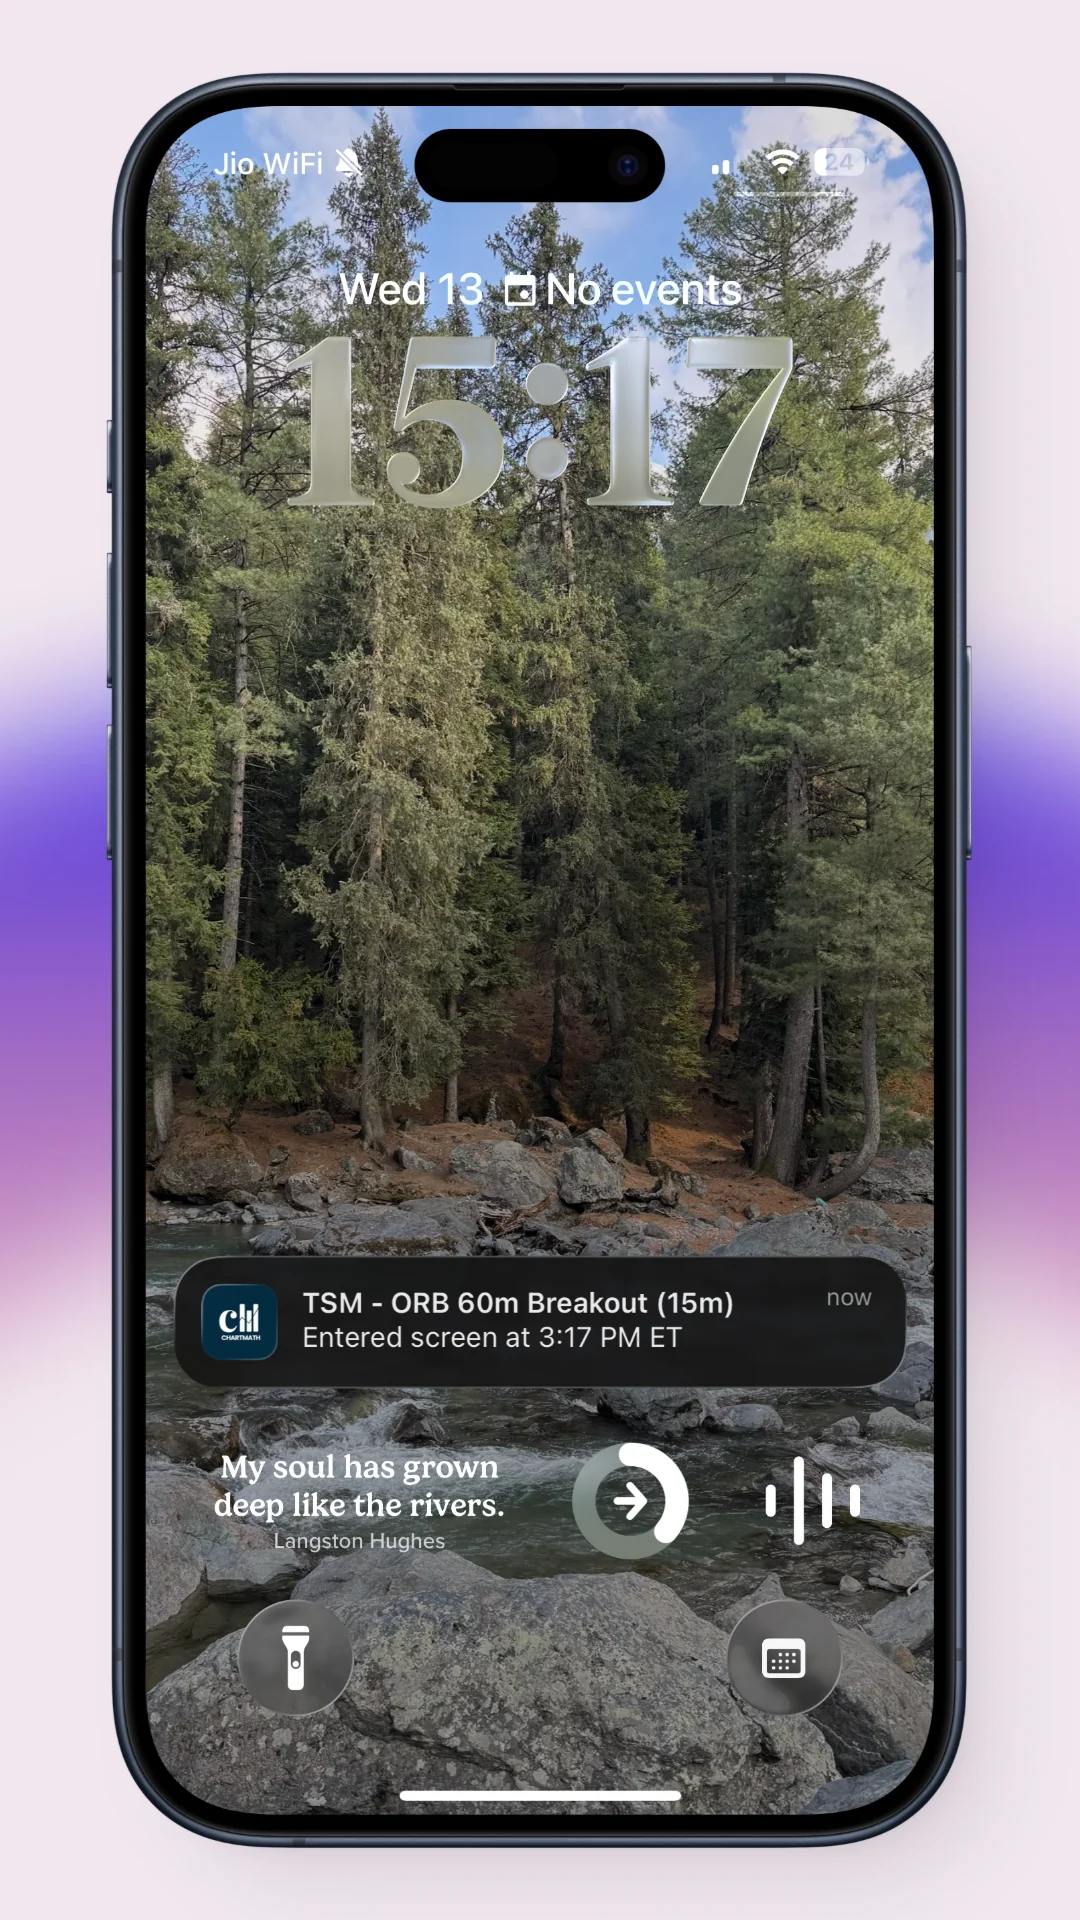
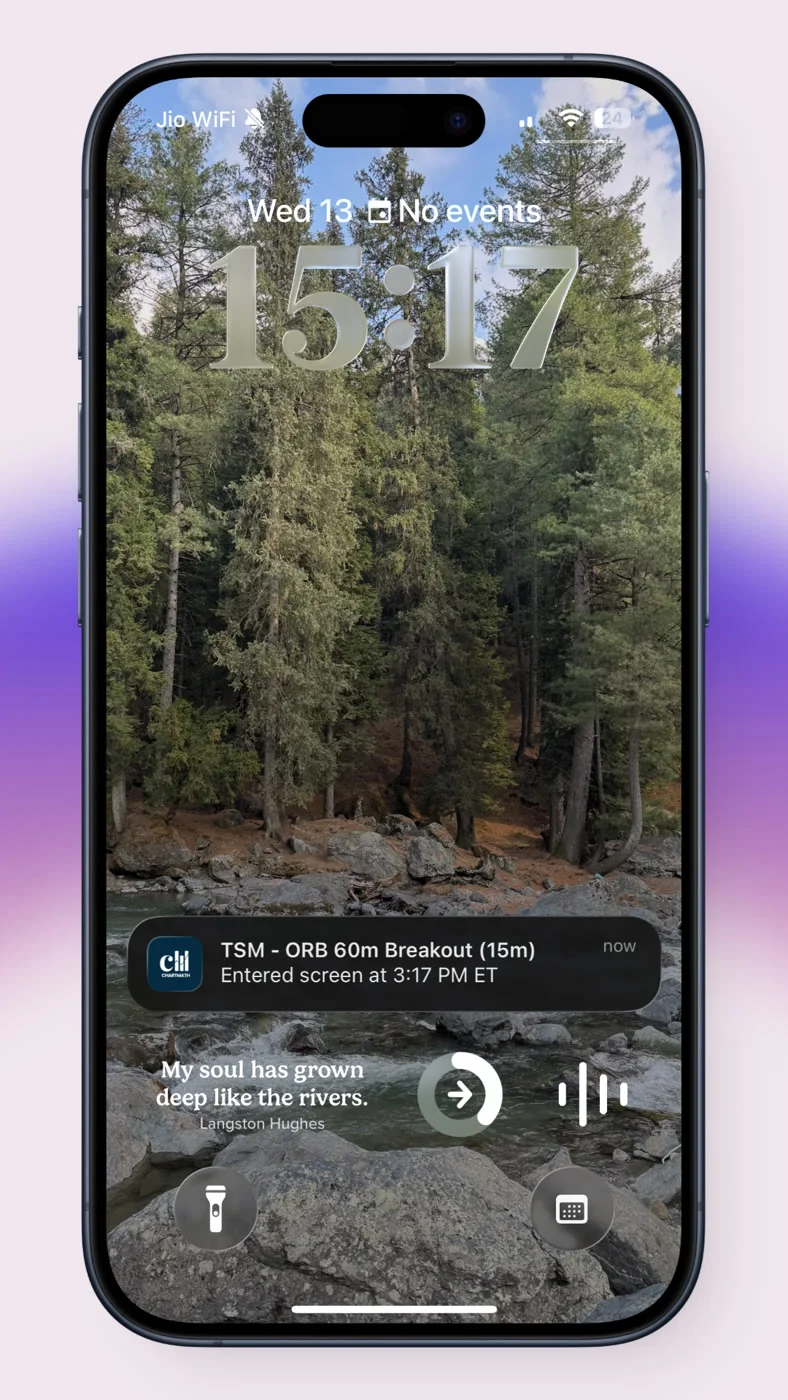
Once the market opens, your screener's job changes. It's no longer building a list, it's watching your favorited screens and your watchlist tickers minute by minute across whichever of the 7 timeframes you've set, from 1-minute charts up to daily. When a match occurs, an alert goes out by push notification and email, never SMS, carrying the ticker, timeframe, screen name, a plain-English reason it fired, a timestamp, and a deep link back into the app.
This is the copilot model at work: ChartMath tells you what happened and why, and you decide whether to act on it. Nothing enters a position on its own; you tap to place every order. You place it on your own terms. That separation matters, because a tool that never acts without you also can't talk you into a trade you didn't choose.
The goal isn't to catch every move. It's to catch the moves that match a rule you already trust, without needing to watch for them yourself.
To keep this manageable, be deliberate about which screens you favorite. Following all 200+ screens at once guarantees alert fatigue: your phone buzzes constantly and you stop reading the reasons. Instead:
- Favorite 3-6 screens that match your actual trading style (momentum, reversal, breakout, or volume-based).
- Use the symbol-level alert builder for the handful of tickers you're actively tracking, rather than subscribing to every screen for every symbol.
- Lean on notification hygiene features like de-duplication, per-bar caps, and quiet hours so alerts don't pile up during meetings or overnight.
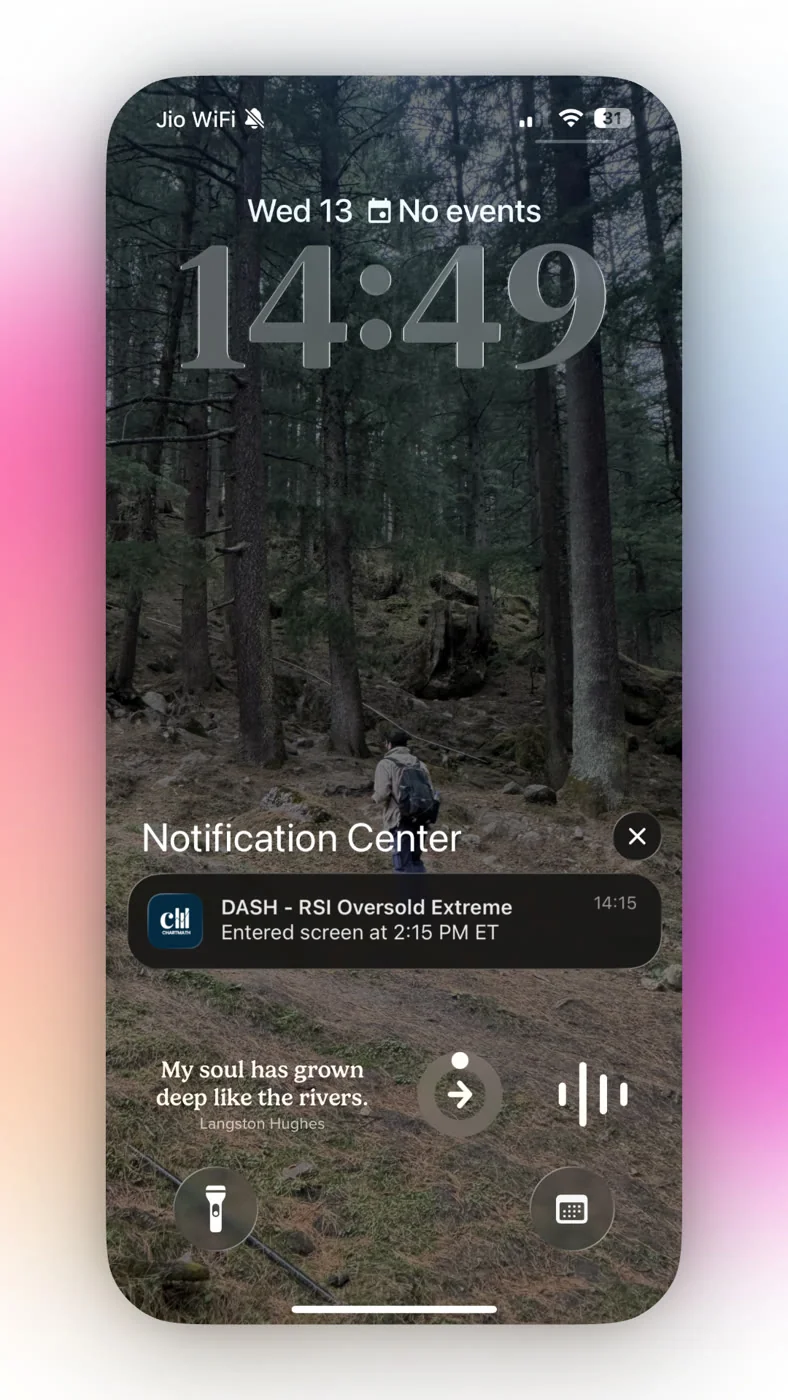
That's the entire intraday workflow: check the alert, read the plain-English reason, glance at the chart if it's worth a second look, then decide. Most alerts take two or three minutes to evaluate. For a deeper breakdown of how to read a signal before committing capital, see how to read a trading signal before you risk money.
3. Run an End-of-Day Review Instead of Chasing the Close
The final piece most people skip is the review. After the close, spend 10 to 15 minutes looking at which alerts fired, which ones you acted on, and what actually happened to price afterward. This is where the backtested Win Rate and Avg. Return shown on each screen become useful in context: you're not just asking "did this trade work," you're asking "did this screen behave the way its historical sample suggested it would."
Keep the review simple:
- Pull up your alert history for the day and note which screens triggered.
- For each alert you acted on, jot down entry, outcome, and whether you followed your own rule or improvised.
- For alerts you skipped, note why, and whether skipping was justified in hindsight.
- Carry any recurring pattern into tomorrow's premarket screen selection.
Doing this daily, even briefly, is what turns a stock screener from a novelty into a system. For a more structured version of this habit, running a weekly trading review in 20 minutes rolls up five days of these mini-reviews into a single weekly checkpoint.
What's the Difference Between a Real-Time Scanner and an End-of-Day Screener?
A real-time scanner keeps evaluating price and volume data continuously throughout the trading session, matching setups on intraday timeframes like 1-minute, 5-minute, or 15-minute bars the moment conditions are met. An end-of-day screener, by contrast, runs its scan once, after the close, using daily or weekly bars, which is useful for swing setups that don't need minute-by-minute confirmation.
Most swing traders with a day job actually need both, just applied to different parts of their process. A daily-timeframe screen run after the close, like the consistent uptrend screen (daily), is perfect for building tomorrow's shortlist without needing to watch anything live. A real-time scan on a 5-minute or 15-minute timeframe is what catches an intraday VWAP reclaim or opening range breakout while you're at work. Because ChartMath spans all 7 timeframes, from 1-minute up through monthly, the same watchlist can carry both kinds of screens: a daily Golden Cross screen for the swing shortlist, and an intraday ORB screen for anything you want to catch live.
If you're deciding which timeframe fits your schedule, swing trading with a full-time job walks through how to weight daily versus intraday screens around a 9-to-5.
Do Trading Platforms Have a Built-In Scanner, or Do You Need a Separate Tool?
Some brokerage platforms include a basic scanner, but most gate the useful filters behind a paid tier, and almost none attach a backtested win rate to what they find. TradingView's screener is capable but works best when paired with an alerting layer, since building conditional alerts inside TradingView for dozens of setups usually means writing Pine Script. Finviz is a solid static screener for research, but it has no push alerts and no explanation of why a ticker matched.
This is exactly the gap a companion app fills. ChartMath isn't a broker and doesn't compete with your charting platform, it sits alongside whatever you already use. You keep your existing brokerage for execution and your existing charts for deeper analysis; ChartMath handles the scanning, the backtested context, and the alert delivery. If you're currently piecing together TradingView, a separate alert service, and a spreadsheet, building an efficient trading workflow in 2026 covers how to consolidate that stack without giving up the charting tool you're used to.
Setting Up Your Watchlist So the Screener Does the Watching
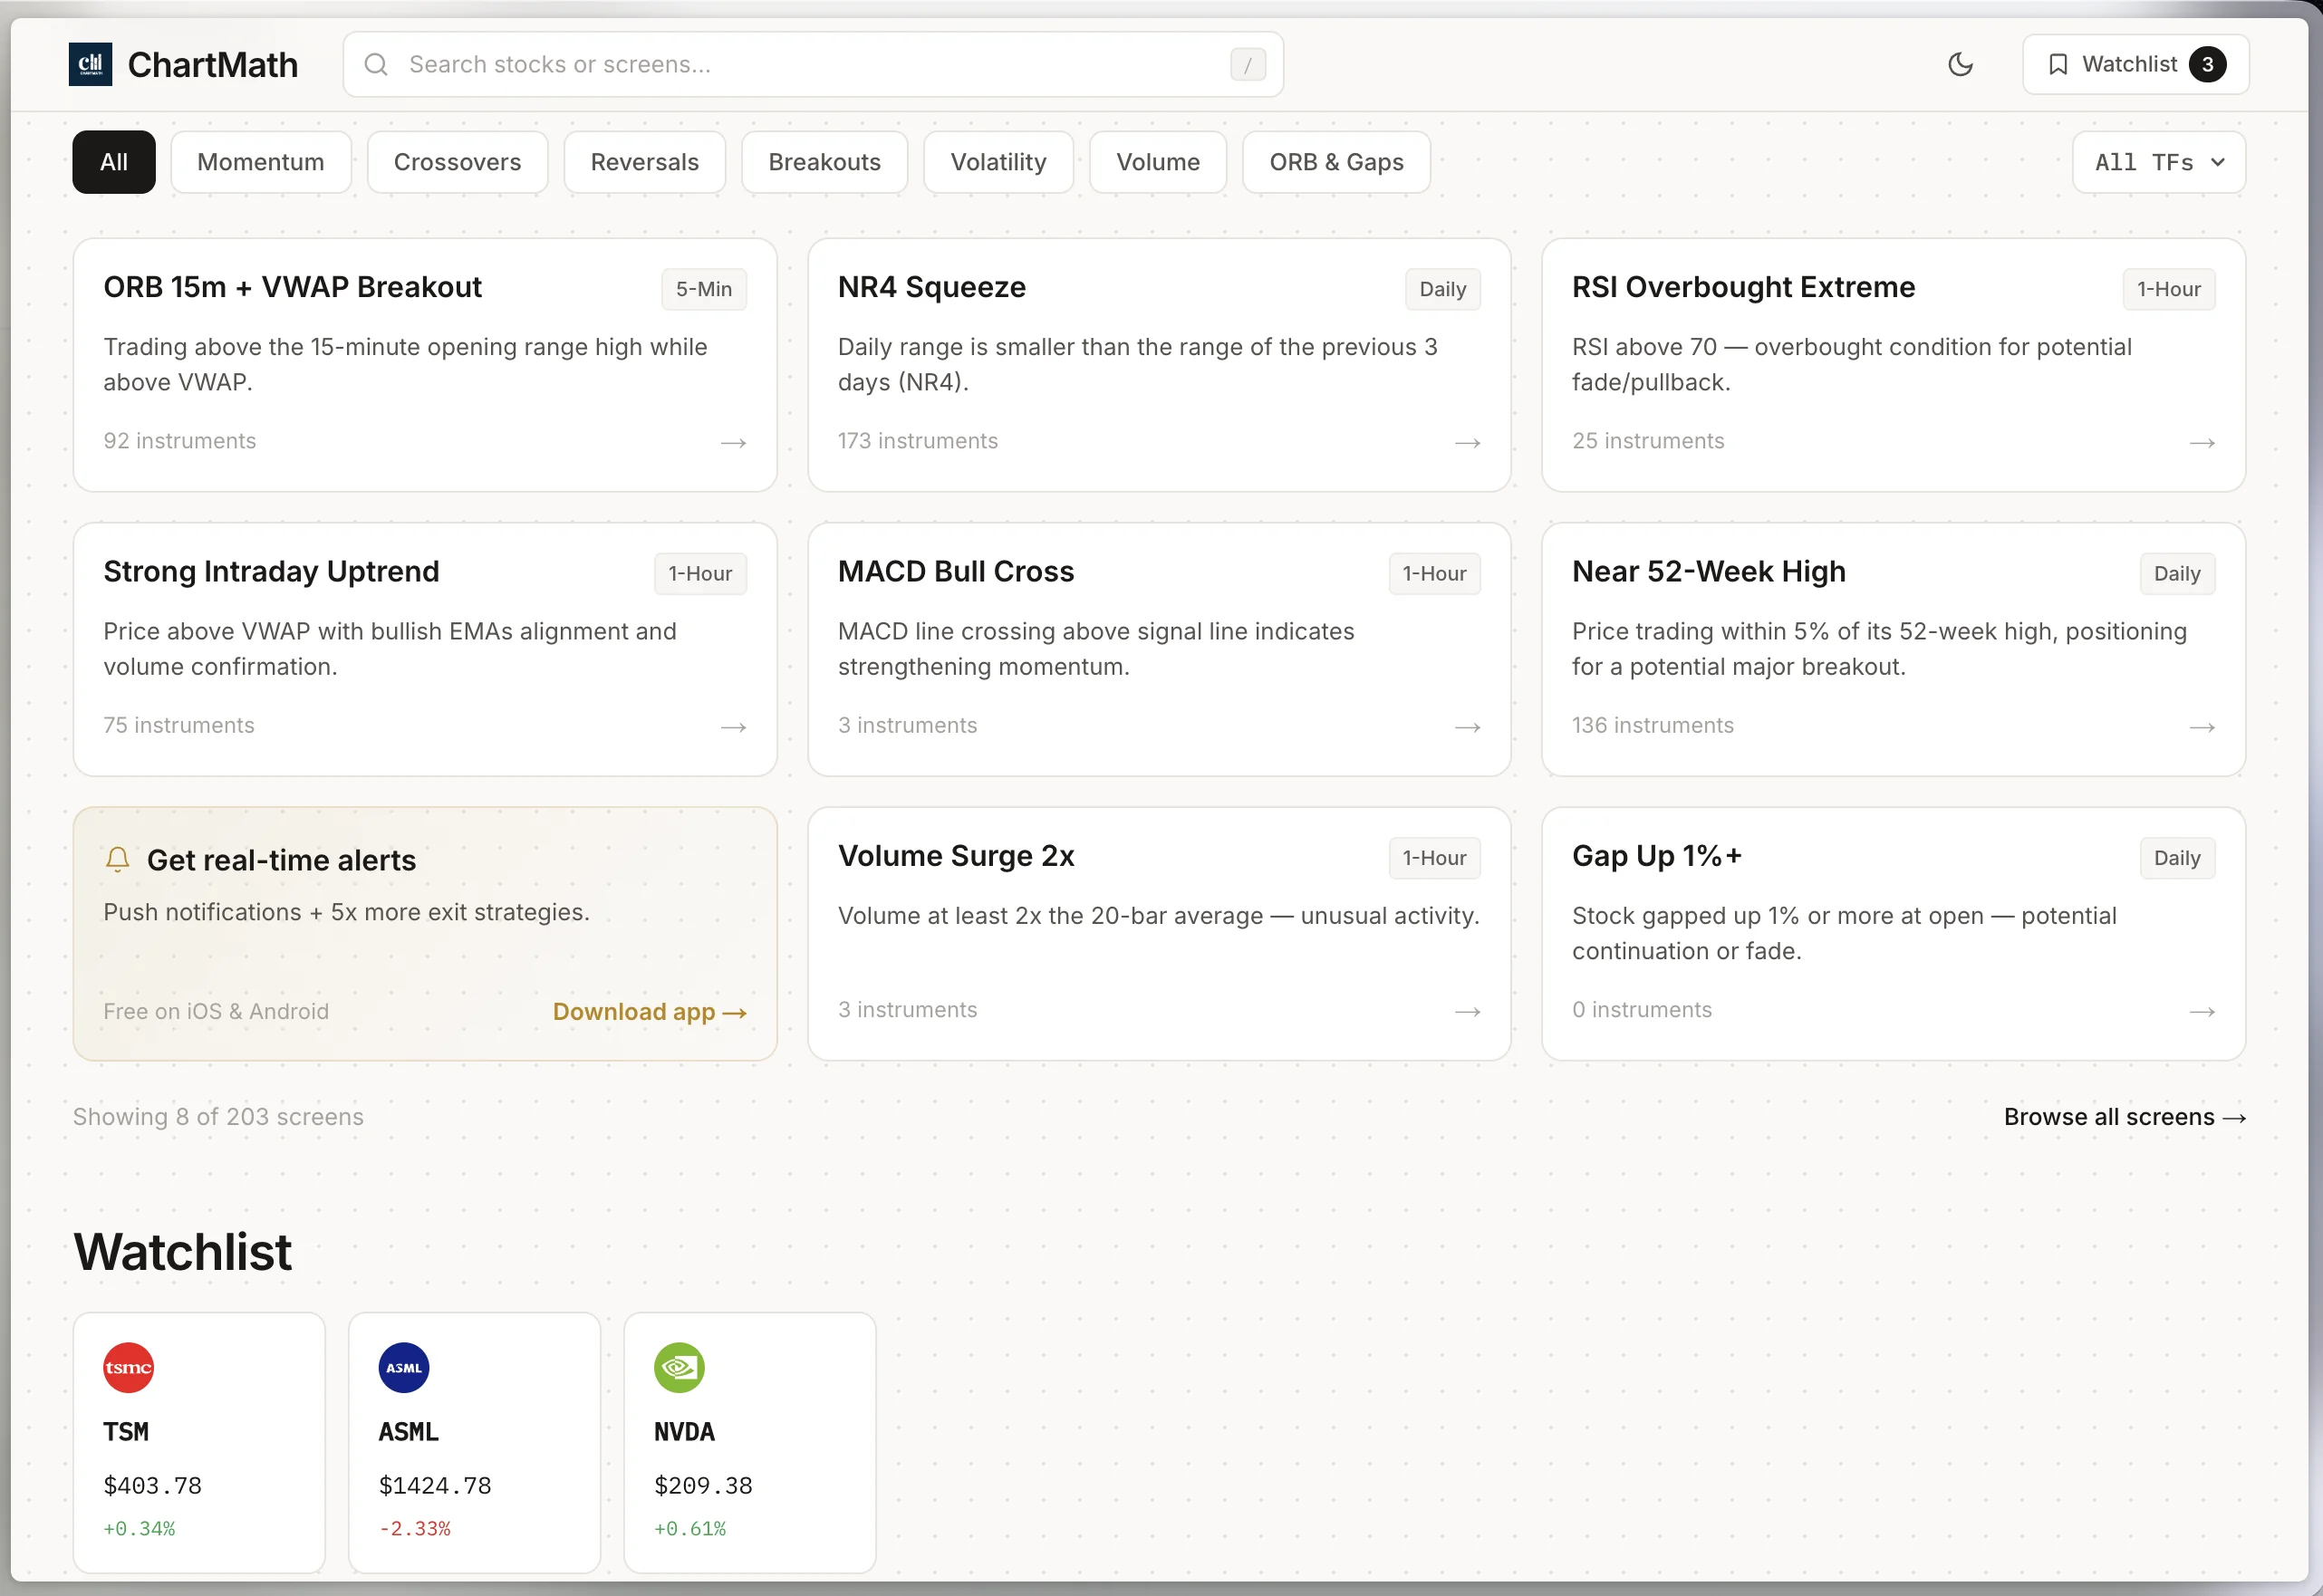
Your watchlist is the connective tissue between the screener and your alerts. Keep it small and intentional, 10 to 20 tickers you actually care about, not every stock that has ever looked interesting. A bloated watchlist produces the same fatigue as following too many screens: too many alerts, not enough attention for any of them.
- Add tickers deliberately. Every symbol should have a reason it's on the list, tied to a screen or a thesis, not a passing headline.
- Use screen-enter alerts for your favorited setups. These fire when any ticker, including ones on your watchlist, enters a screen you've favorited.
- Use the symbol-level alert builder for specific names. If you're tracking one ticker closely, set an alert tied to that symbol across the setups you care about.
- Size positions before the alert fires, not after. Decide your risk per trade in advance so an alert doesn't turn into an emotional, oversized entry.
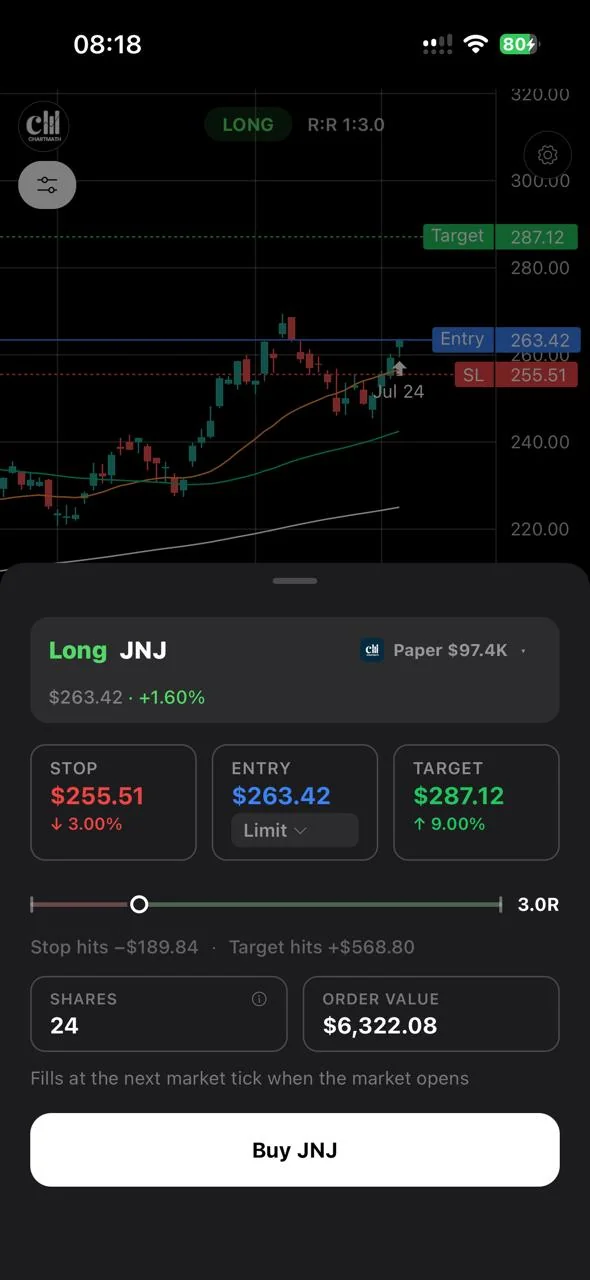
Position sizing matters more than it sounds like it should. An alert that fires at 2 AM your risk tolerance and 2 PM your actual account size are two different trades if you haven't set rules ahead of time. If you haven't nailed this down yet, review the mechanics of validating a swing trade setup before you risk capital, which covers sizing alongside signal confirmation.
Weekly Maintenance: Keeping the Routine From Decaying
Daily habits erode without a weekly checkpoint. Once a week, usually on a weekend, spend 15 to 20 minutes on maintenance:
- Remove watchlist tickers that haven't triggered a relevant alert in two weeks or no longer fit your thesis.
- Revisit the screens you've favorited. If a screen's backtested Win Rate or Avg. Return has looked weak across your recent sample, swap it for one of the other 200+ screens in the catalog.
- Check whether your alert volume feels manageable. If you're dismissing alerts without reading them, you've favorited too many screens.
This weekly pass is what separates a routine that lasts from one that quietly falls apart after the first busy week at work. It's a small habit, but it compounds. Traders who treat their backtested strategies as living things they revisit tend to stick with a system far longer than traders who set it up once and never touch it again.
Frequently Asked Questions
Does a stock screener replace a trading strategy?
No. A screener finds candidates that match a rule; it doesn't decide position size, risk, or when to exit. Screens like the ones in ChartMath's catalog come with backtested Win Rate and Avg. Return so you know the historical context of the setup, but you still need your own rules for sizing and exits. Think of the screener as the research layer, not the whole strategy.
How many screens should I follow at once?
Start small, three to six favorited screens is usually enough to generate a manageable number of daily alerts without drowning you in notifications. You can always browse the full catalog of 200+ ready-made screens and add more once you've calibrated how much alert volume you can actually act on.
Can I use a screener alongside TradingView or Finviz?
Yes. A screener like ChartMath is designed as a companion, not a replacement. Keep your charting platform for deep technical analysis and your broker for execution; let the screener handle continuous scanning and alerting so you're not the one refreshing tabs all day.
Will this work if I have a full-time job?
That's the entire point of building the routine around alerts instead of screen time. Premarket prep takes 10-15 minutes, intraday alerts take a couple of minutes each time your phone buzzes, and the end-of-day review takes another 10-15 minutes. None of it requires watching a chart during work hours.
If you've been trying to force a static screener into a job that doesn't have room for constant chart-watching, the fix isn't more discipline, it's a different tool. ChartMath scans 500+ US equities across 200+ backtested screens and 7 timeframes, then sends you a push or email alert the moment a setup matches, with a plain-English reason attached. You can browse the full web-based screener right now with no sign-in, or download the app to start building your watchlist and setting up alerts today. Want to see what one of these rules actually states first? Read the ORB 15m breakout screen (5m) before you commit to a new routine. ChartMath is free, no credit card required, so there's nothing stopping you from testing this workflow against whatever you're using now.
Recommended Resources
- Watch Demo
- Web Based Screener

See these setups live in ChartMath
200+ curated screens with backtest data. Free. No credit card required.