How to Use Push Alerts to Catch Intraday Setups
You're in a 10 AM standup, phone face-down on the table because that's the professional thing to do. Somewhere in the market, a ticker you've been tracking just reclaimed VWAP on the 5-minute chart with volume running 3x its average. By the time your meeting ends at 10:35, the move is half over. You never saw it happen. This is the actual problem with intraday trading and a day job: it was never about discipline or chart-reading skill. It's about being in two places at once, and losing.
Push alerts exist to fix exactly this gap. Instead of you watching the market, the market taps you on the shoulder the moment something worth looking at happens. But "get alerts" isn't a strategy by itself. Set them up wrong and you'll drown in noise, or worse, you'll act on alerts you don't actually understand. This guide walks through how to configure and use push alerts to catch intraday setups on the 1-minute, 5-minute, and 15-minute timeframes, using ChartMath's alert system as the working example, so you build a repeatable process instead of another source of anxiety on your phone.
Why Intraday Traders Miss Entries (and Why That's Not a Discipline Problem)
Intraday setups move fast. A VWAP reclaim, an opening range breakout, a relative volume spike, these can develop and resolve within minutes. If your process is "open the app and refresh," you are only ever seeing a snapshot of what already happened. Static screeners like Finviz or a manually refreshed TradingView scan show you the market as it was the moment you last hit refresh, not as it is right now.
Here's the math that makes this brutal. Say you're tracking 15 tickers across three intraday timeframes. That's 45 individual chart states you'd need to check every few minutes to catch a setup as it forms. Nobody does that and also holds down a job. So traders either narrow their watchlist to almost nothing, or they check in occasionally and accept they'll miss most of what happens between checks.
Push alerts flip the model. Instead of you pulling data by refreshing, the system pushes a notification to you the instant a rule-based setup matches. You stop scanning and start reacting to a much smaller, pre-filtered stream of information. That's the difference between running a manual process and running a systematic trading workflow that doesn't depend on your eyes being glued to a screen.
1. Pick the Timeframes That Match Your Trading Style
ChartMath scans across 7 timeframes: 1-minute, 5-minute, 15-minute, 1-hour, Daily, Weekly, and Monthly. For intraday trading specifically, you'll mostly live in the 1m, 5m, and 15m buckets. Each one serves a different purpose, and picking the wrong one is a common reason traders end up either missing moves or getting buried in pings.
- 1-minute: Best for scalping and precise entries once you've already identified a setup on a higher timeframe. Fires constantly, so only use it on a small number of tickers you're actively watching that day.
- 5-minute: The workhorse timeframe for most intraday traders. Enough noise filtering to avoid every tiny wiggle, still fast enough to catch a move while it's developing.
- 15-minute: Good for traders who check their phone every 20 to 30 minutes rather than continuously. Fewer alerts, each one more meaningful.
A practical rule: match the timeframe to how often you can realistically look at your phone. If you're in back-to-back meetings until lunch, subscribing to 1-minute alerts on ten tickers just means ten notifications you can't act on and a phone that won't stop buzzing. Pick 15-minute alerts for your core watchlist, and reserve 1-minute or 5-minute alerts for the one or two names you're actually planning to trade that day.
2. Choose Screens Built for Intraday Setups
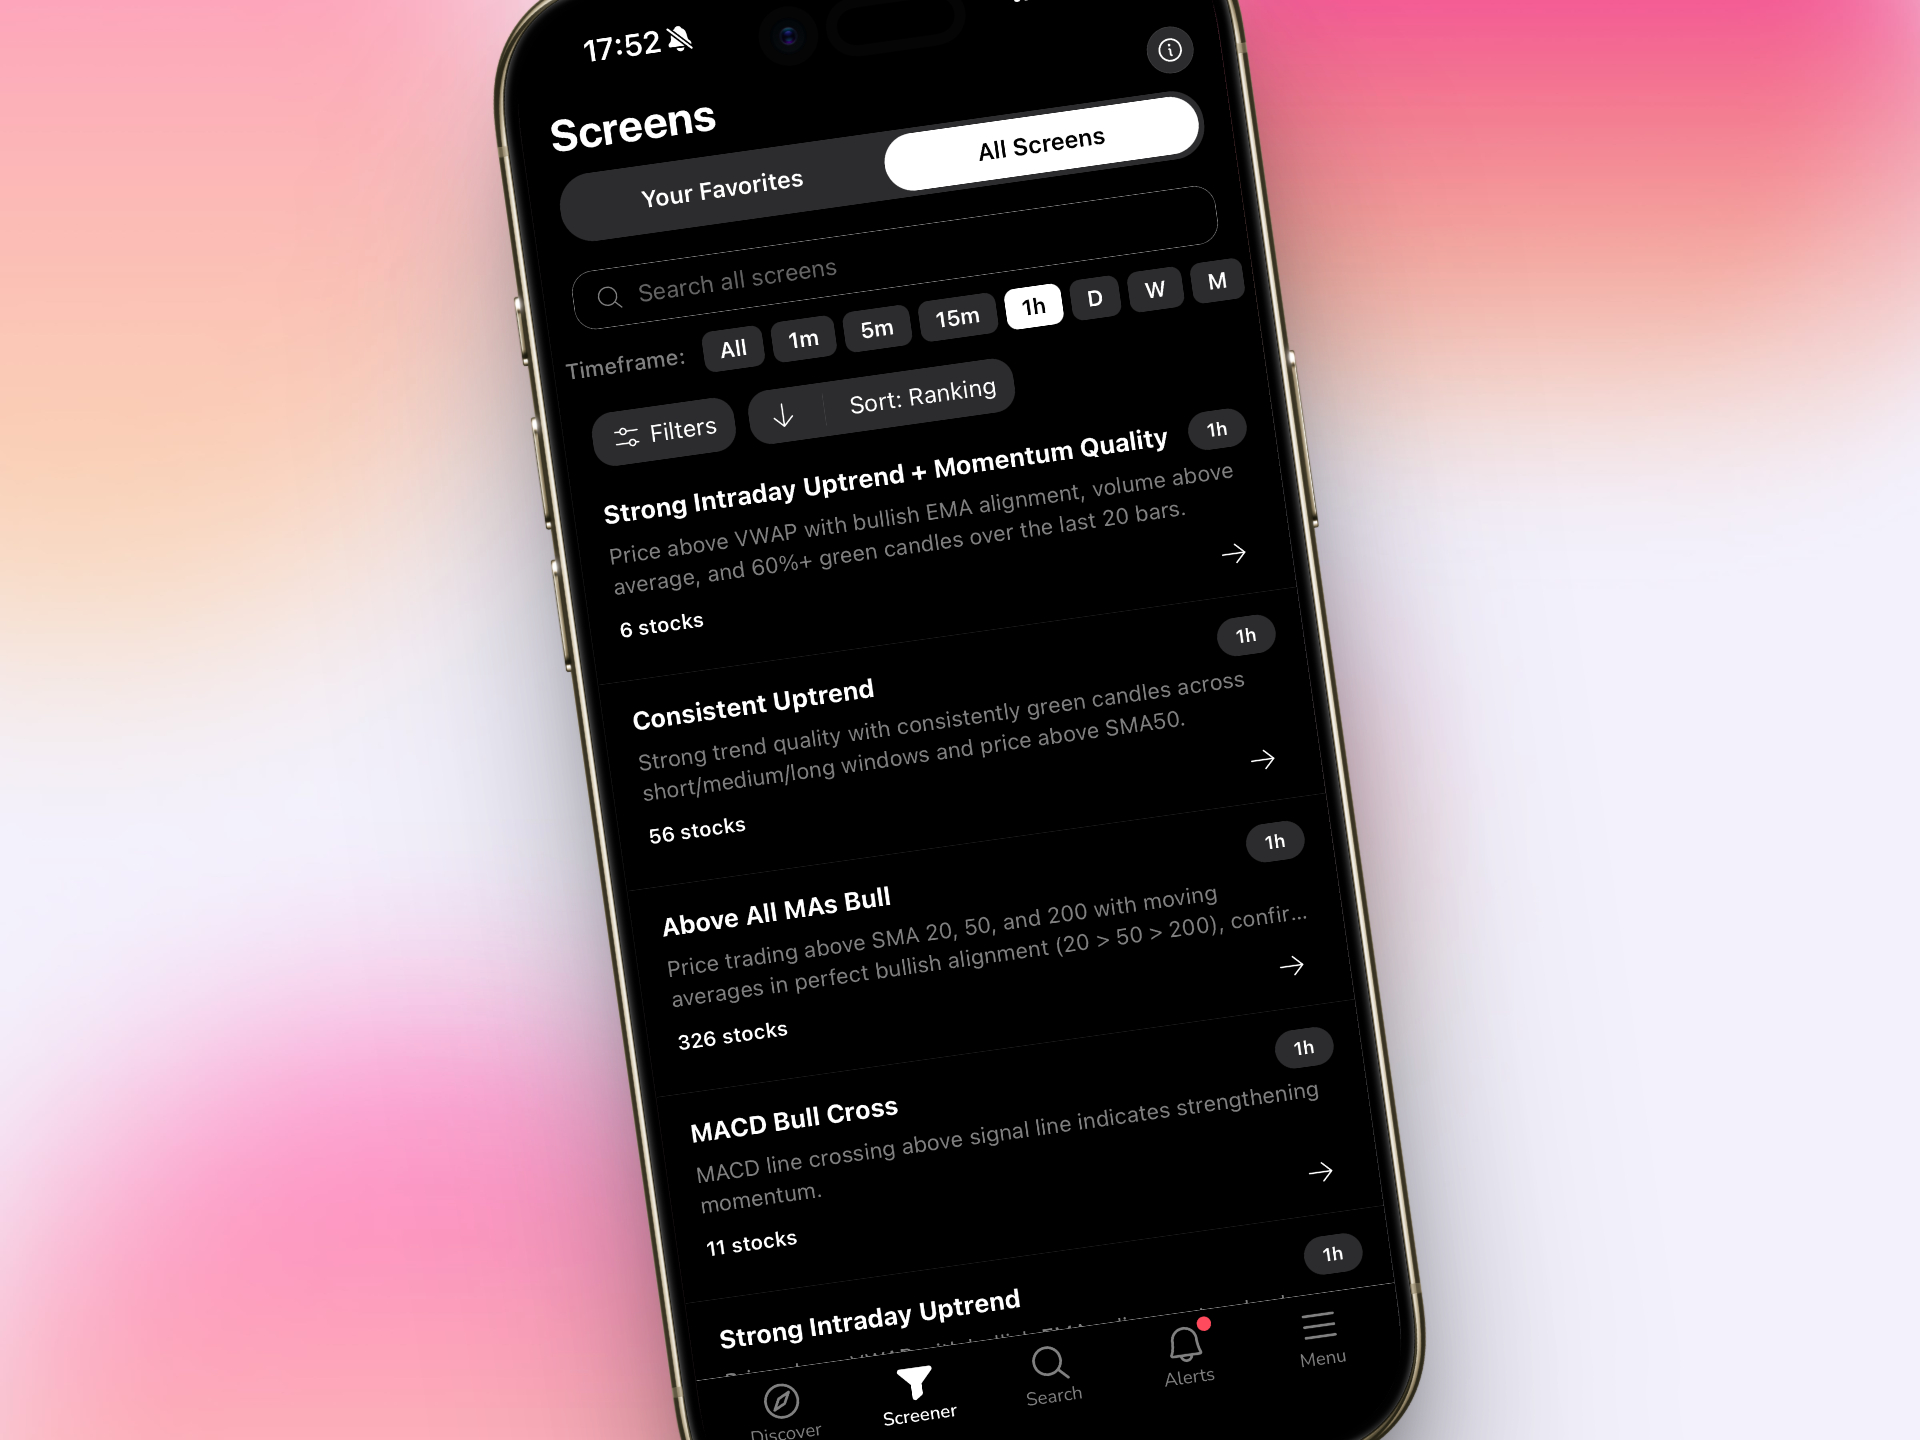
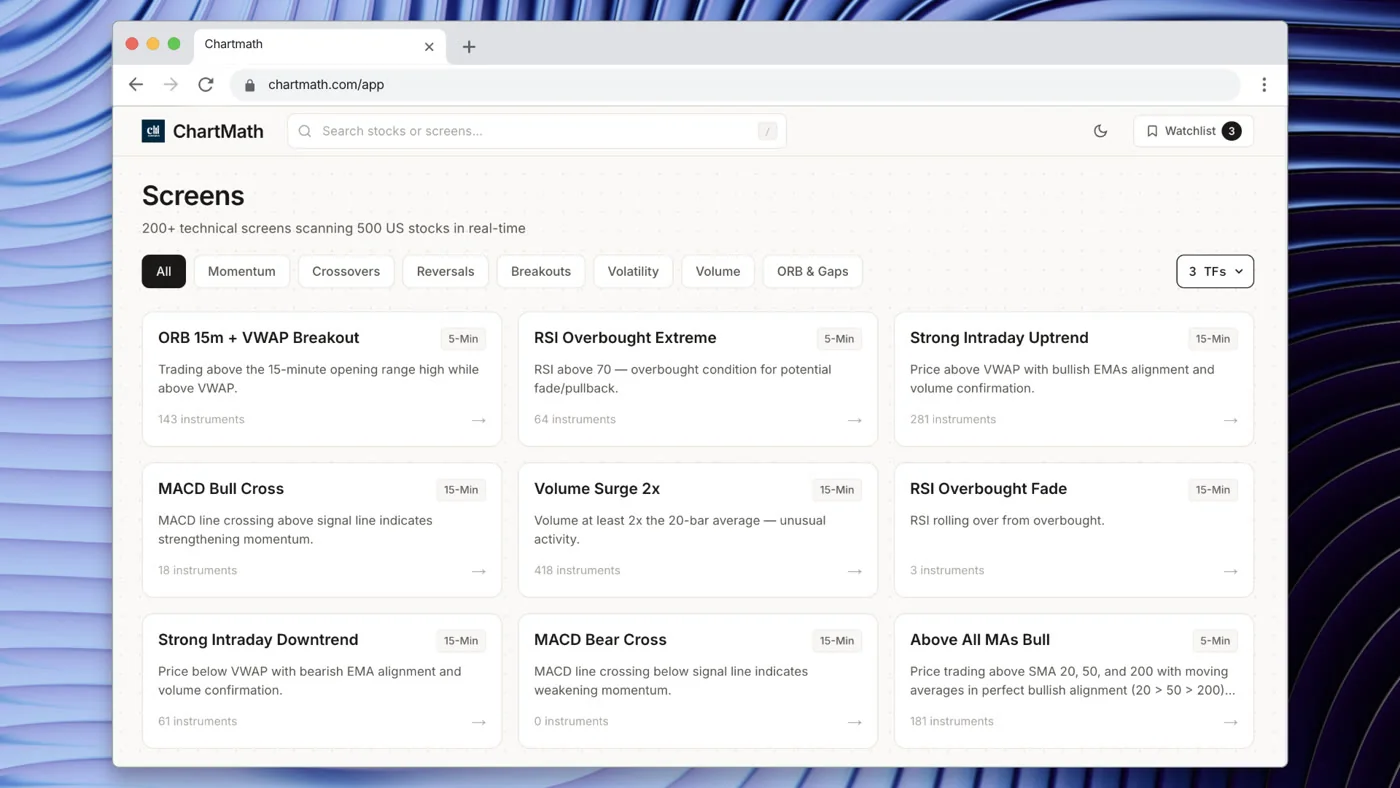
ChartMath runs 200+ curated, read-only technical screens across momentum, reversal, breakout, and volume categories, against a bounded universe of 500+ US equities. Because the rule and the universe are both fixed, every screen carries a track record you can recompute instead of take on trust. For intraday work, a handful of screen types come up again and again:
- VWAP Reclaim: Price dips below the volume-weighted average price and then reclaims it, often signaling a resumption of the intraday trend. The VWAP Reclaim screen (5m) states the rule and its backtested record in full.
- Opening Range Breakout (ORB): Price breaks above or below the high/low range established in the first 15 to 60 minutes of the session. See the ORB 15m Breakout screen (5m).
- Gap Up / Gap Down: Stocks opening meaningfully away from the prior close, often paired with a relative volume filter.
- RSI Oversold / Overbought: Momentum exhaustion setups that can precede short-term reversals, as in the RSI Oversold Bounce screen (15m).
- Relative volume (RVOL) driven screens: Screens that filter for unusually high volume relative to a stock's typical average, such as the Volume Surge 2x screen (5m).
On that last point, it's worth pausing on what relative volume in day trading actually tells you. RVOL compares current trading volume to the average volume at that same time of day historically. A stock trading at 3x RVOL by 10 AM is seeing far more participation than normal, which tends to matter for whether a breakout or reversal has the fuel to continue. Screens that combine a price pattern with an RVOL filter are generally more reliable than price pattern alone, because volume confirms that real interest is behind the move, not just noise.
There's no screen builder here, and that's deliberate. You're picking from 200+ pre-built, backtested screens rather than writing Pine Script or configuring your own filters from scratch. That matters if you don't have a coding background, or if you simply don't want to spend your evenings maintaining scripts instead of trading.
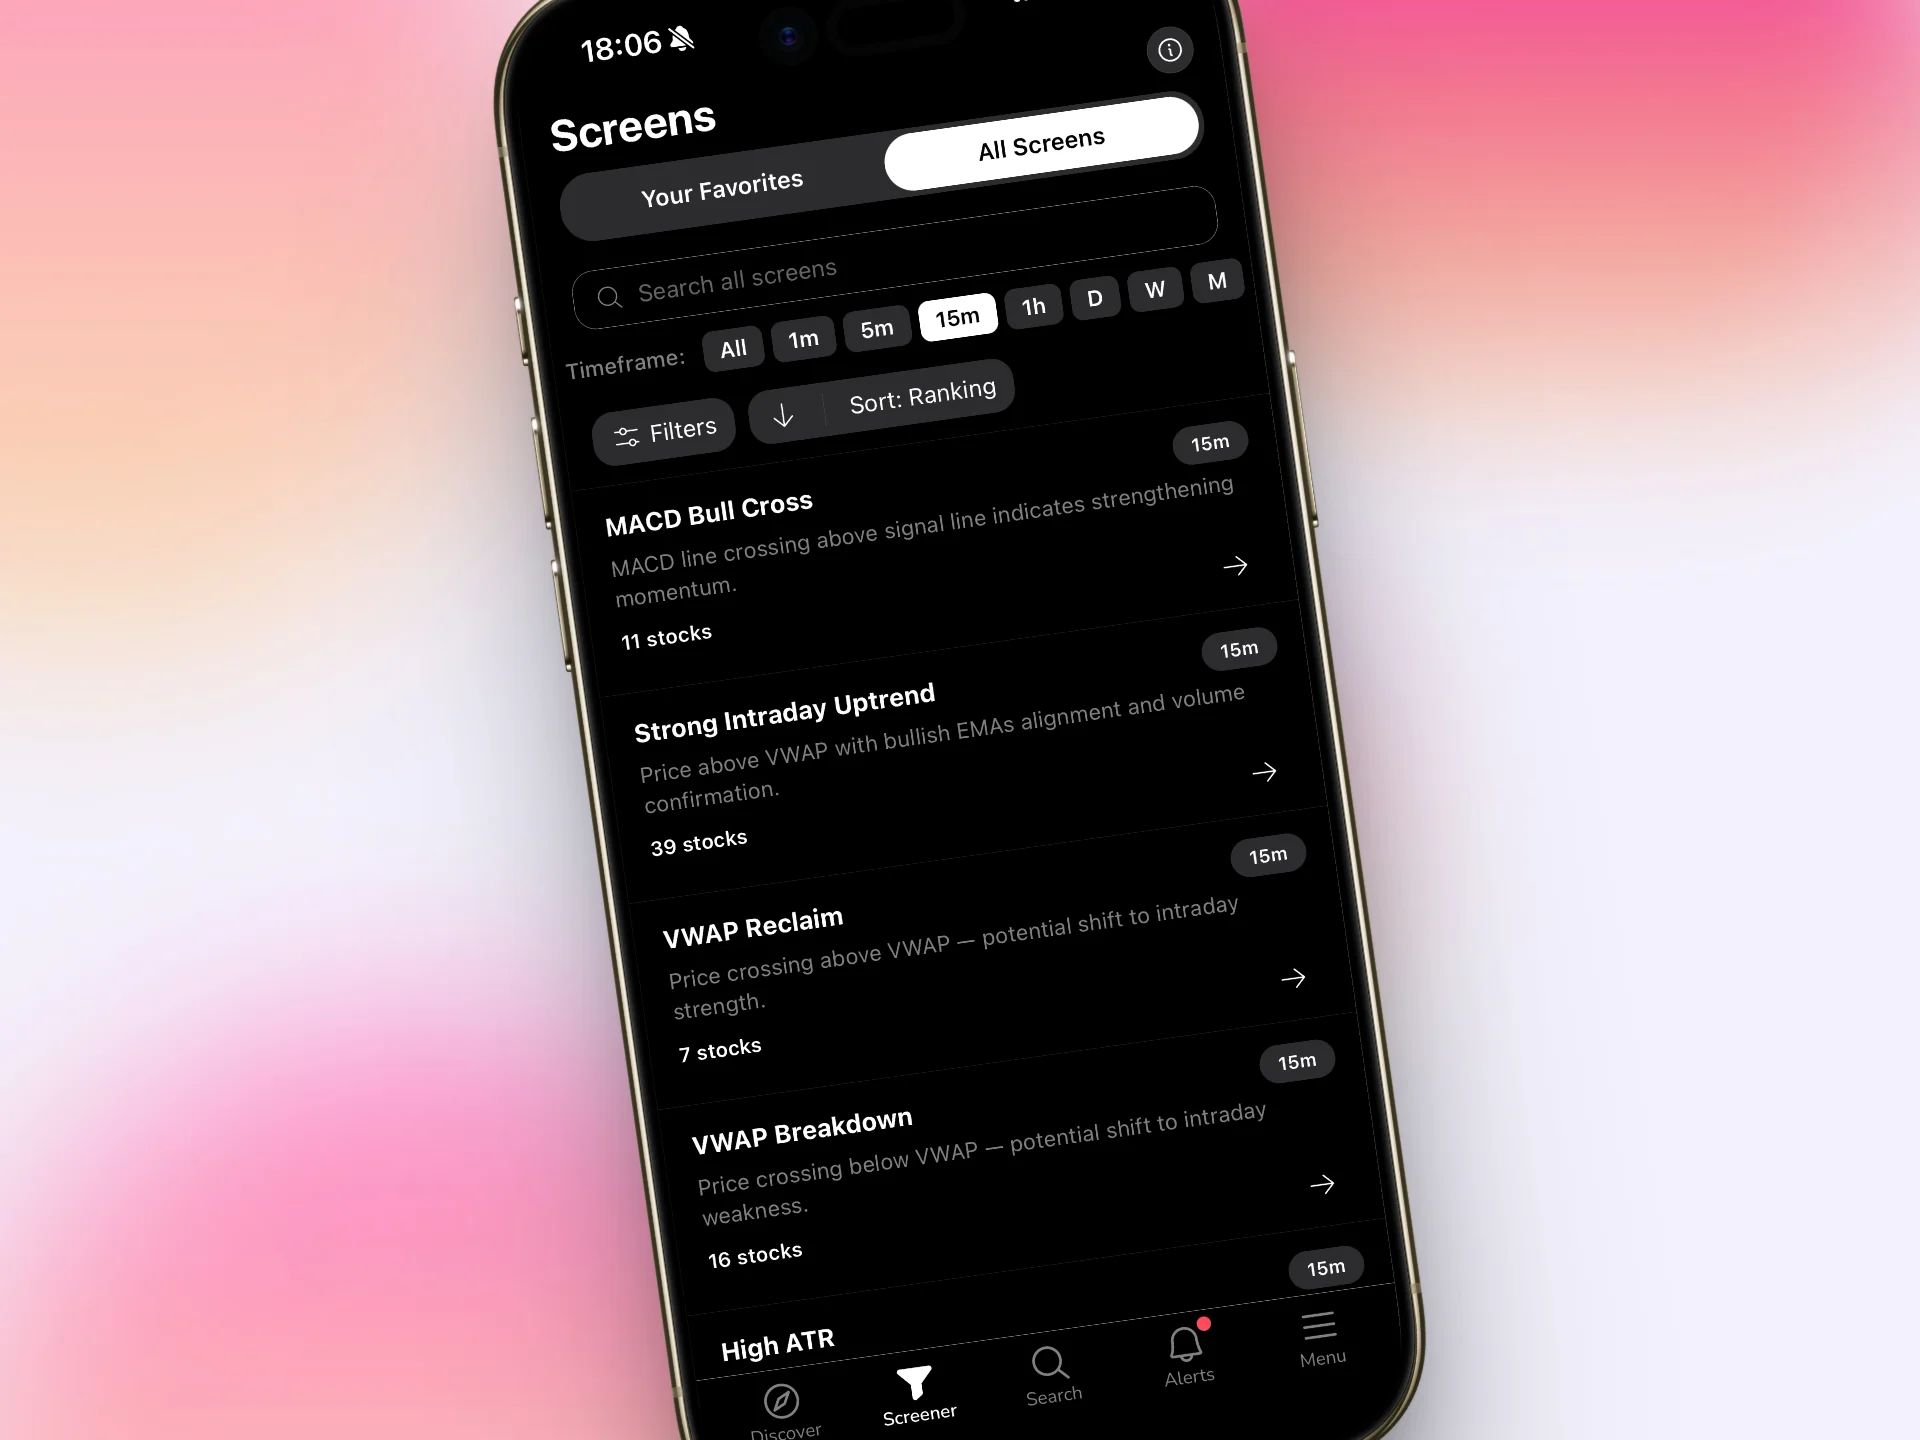
3. Subscribe to Alerts on Your Watchlist or Favorited Screens
Once you know which screens matter to your intraday style, the next step is subscribing to alerts so ChartMath notifies you the moment a match occurs. There are two ways to do this:
- Screen-enter alerts: Favorite a screen (say, VWAP Reclaim on the 5-minute timeframe) and get notified whenever any ticker in the 500+ US equity universe enters that screen.
- Watchlist mode: Build your watchlist of specific tickers you already track, and get pinged only when one of those tickers enters a screen you care about. This is the tighter, lower-noise option if you already have a short list of names you're following.
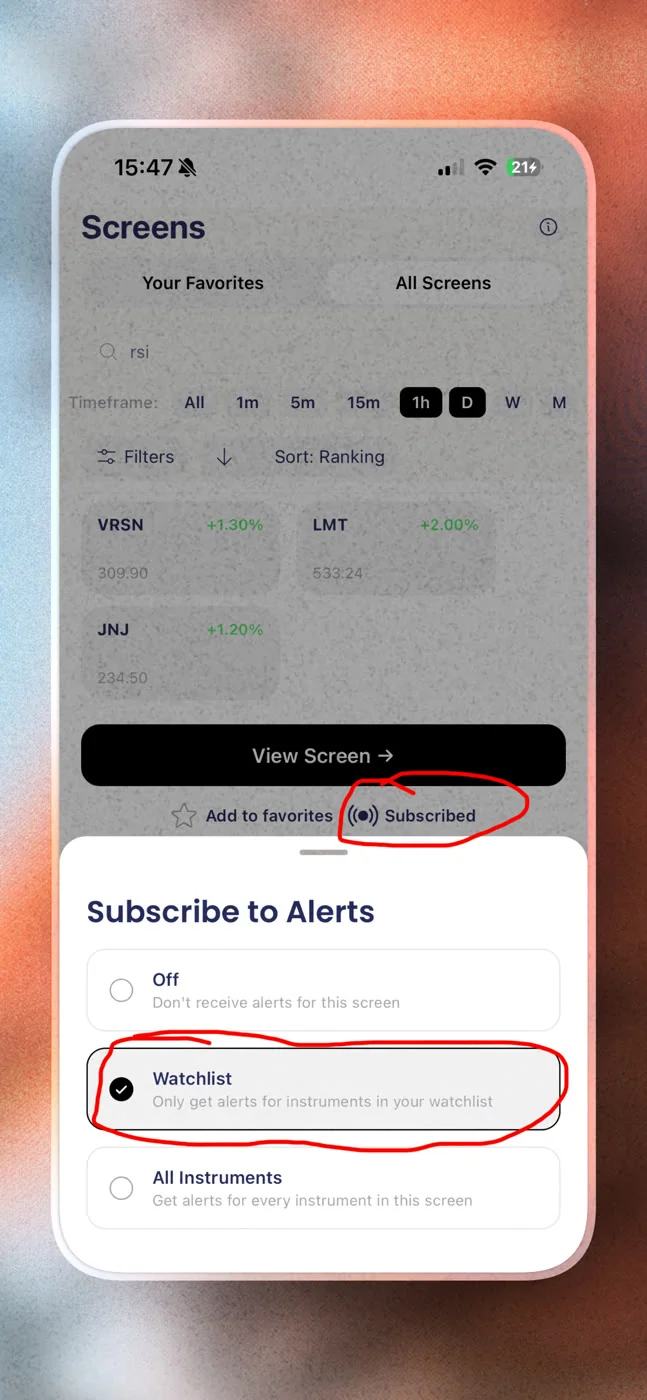
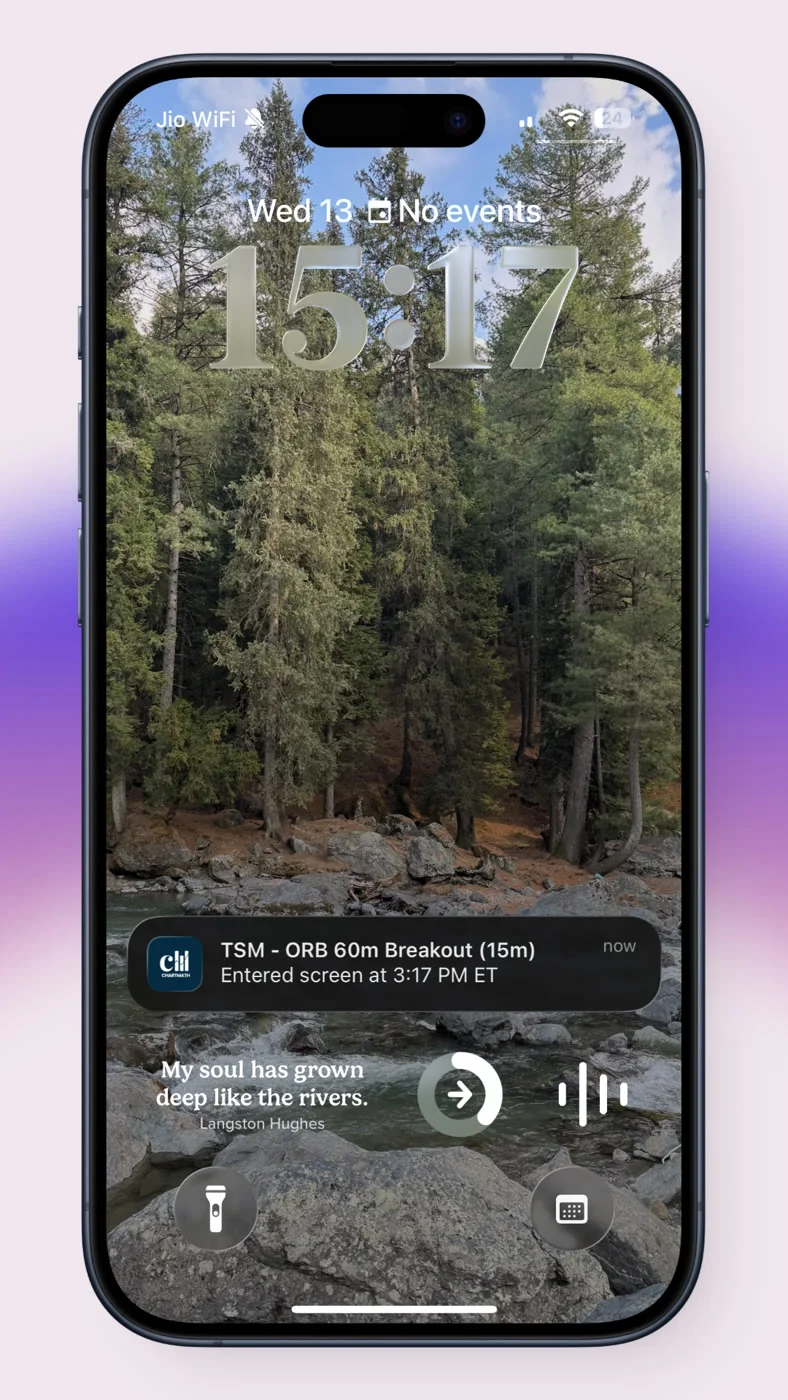
Alerts arrive by push notification and by email. Push is instant, and the email leaves you a searchable record if you want to review what fired later without adding another channel to manage.
Alert fatigue is a real risk with any screener that fires often, so the notification system has some built-in hygiene: de-duplication so you don't get five pings for the same match, throttling and a per-bar cap so a choppy stock doesn't spam you every few seconds, and timezone-aware quiet hours so alerts don't wake you up at 3 AM because a crypto pair moved. Setting quiet hours around your work schedule (say, muted from 9 AM to 11:30 AM if that's when you're always in meetings) is one of the simplest ways to keep alerts useful instead of annoying.
4. Read the Alert Before You Touch the Order Ticket
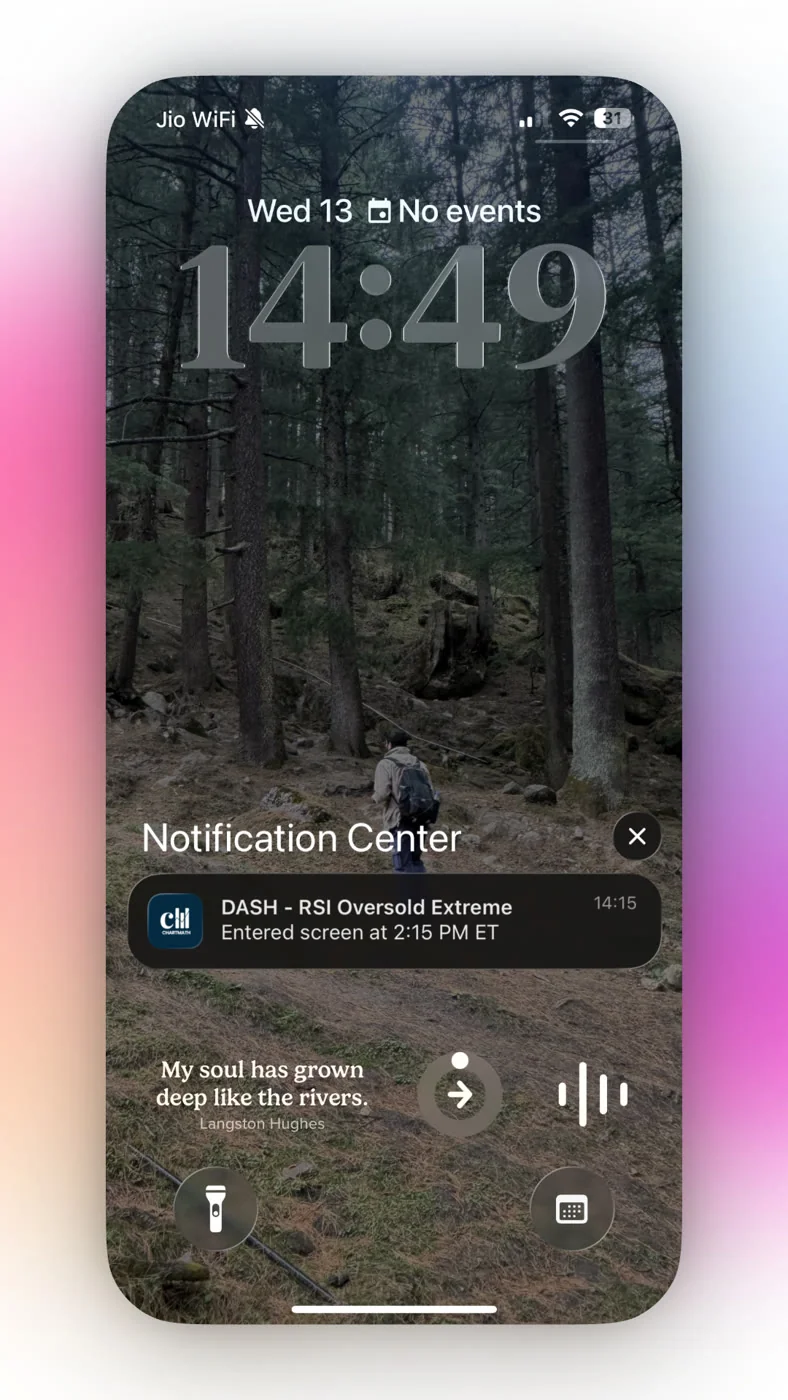
This is the step traders skip when they're excited, and it's the one that actually matters. Every ChartMath alert carries the same structured payload: the ticker, the timeframe it matched on, the screen name, a plain-English explanation of why it fired, a timestamp, and a deep link back into the app. Before you do anything else, read that explanation. If the alert says a stock entered the VWAP Reclaim screen on the 15-minute chart, you should understand what that actually means before you consider a trade.
Tap through the deep link and you'll land on the screen detail, which shows two numbers you should always check: Win Rate and Average Return. These come from the screen's backtest, run against historical bar-close data. ChartMath never labels this "accuracy," because that word implies a certainty the numbers don't claim. Win Rate tells you how often this exact setup has historically resolved favorably; Average Return tells you the typical magnitude when it does. Neither number is a promise. A screen's backtest is historical evidence, not a guarantee of what happens next.
It's also worth knowing what the backtests don't yet do. They use bar-close entries with no look-ahead bias, but they don't currently model commissions, slippage, or spread. On intraday timeframes especially, those costs add up faster than they do on daily setups, so build in your own buffer when sizing a trade off a backtested win rate.
An alert is not an order. ChartMath is a copilot, not an autopilot: it tells you what's happening and why, and you decide what to do about it. Nothing enters a trade on its own. You tap to place every order.
That separation is a feature, not a limitation. It means the system's only job is to surface setups accurately and explain them clearly. The decision, and the risk, stays with you, which is exactly where it should be. If you want a deeper framework for vetting a signal before committing capital, see our piece on how to read a trading signal before you risk money.
5. Build a 60-Second Alert-to-Action Workflow
The value of push alerts collapses if you still spend ten minutes deciding what to do every time one arrives. Here's a simple sequence you can run in under a minute, whether you're at your desk or standing in a hallway between meetings:
- Alert fires. You see the push notification: ticker, screen, timeframe.
- Tap the deep link. Land directly on the screen detail for that match.
- Check Win Rate and Avg. Return. Confirm this is a setup type you actually trade and that the historical numbers meet your own bar.
- Glance at the live chart. Confirm the setup still looks intact, price hasn't already run away from the entry zone described in the alert.
- Size the position. Apply your own risk rule, commonly 1-2% of account equity per trade, before you do anything else.
- Place the order. You can rehearse it first as a simulated paper order, with the stop and target pre-filled and the share count derived from the risk you set, and track it in the Portfolio tab. Either way, you tap to place it.
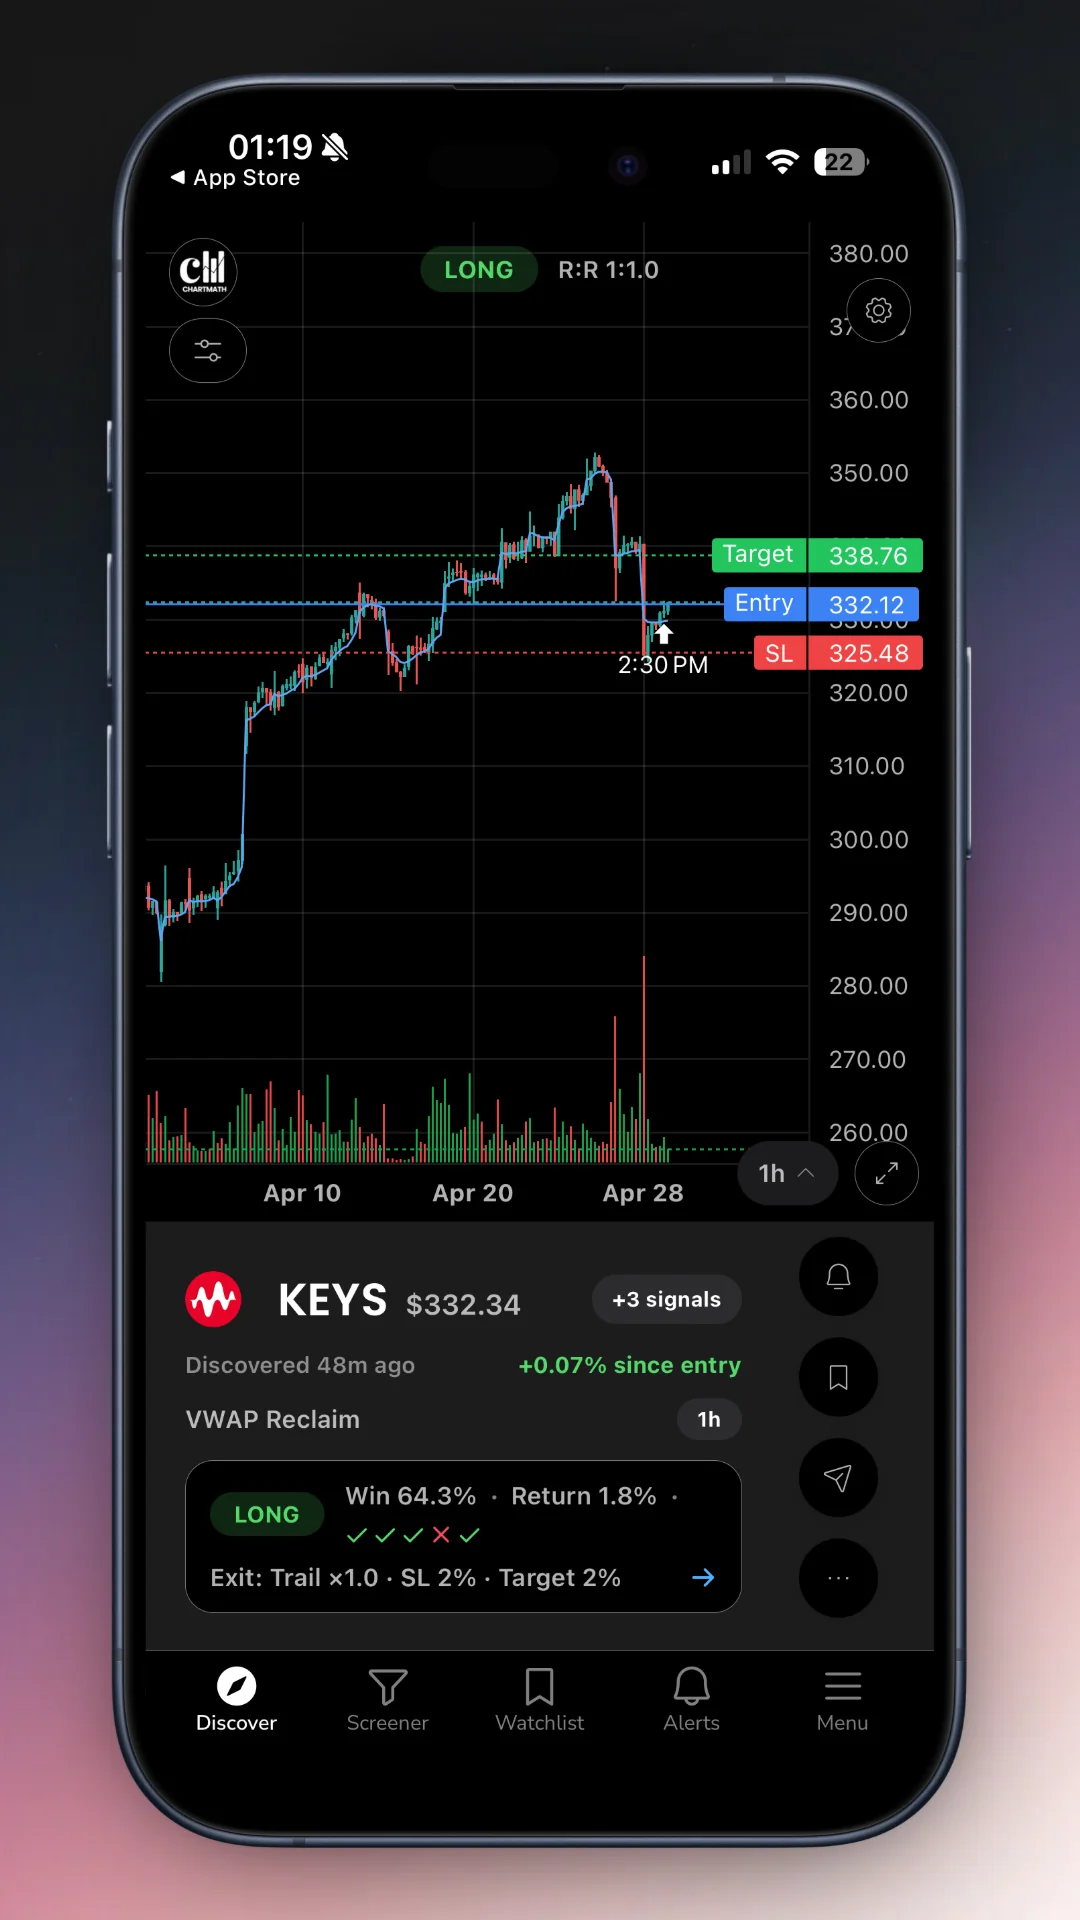
Position sizing deserves its own moment here, because a great alert on an oversized position is still a bad trade. Risking a fixed, small percentage of your account on every entry, regardless of how confident the alert makes you feel, is what keeps one bad intraday setup from turning into a bad week. The alert tells you where to look. Your risk rules decide how much to put behind it.
6. Avoid Alert Fatigue Without Missing High-Probability Setups
The fastest way to make push alerts useless is to subscribe to everything. Ten screens across three timeframes on a 40-ticker watchlist will bury you in notifications within an hour, and you'll start ignoring your phone entirely, which defeats the whole point.
A few practical guardrails:
- Favorite fewer screens, not more. Pick the two or three setup types that actually match how you trade, and mute the rest.
- Lean on watchlist mode for your core names. If you already track 10 to 15 tickers closely, watchlist-mode alerts cut out the noise from the other 490+ equities in the universe.
- Use quiet hours deliberately. Silence alerts during your predictable meeting blocks and let them queue for your next break.
- Prune what doesn't convert. After a couple of weeks, look back at which alerts actually led to trades you took, and which ones you dismissed every time. Unfavorite the screens in that second group.
This is the same discipline covered in our guide on how to run a weekly trading review in 20 minutes: the goal isn't more signals, it's fewer, better ones that you actually act on.
Push Alerts vs. Refreshing a Screener vs. Signal Groups
It helps to see the three common approaches side by side. Here's how push alert systems like ChartMath compare with manually refreshing a static screener or following a Discord/Telegram signal group:
| Attribute | Push Alerts (ChartMath) | Static Screener Refresh (TradingView/Finviz) | Discord/Telegram Signal Groups |
|---|---|---|---|
| Delivery speed | Instant, the moment the setup matches | Only as fast as you manually refresh | Depends on when the poster notices and types it out |
| Historical win rate shown | Yes, Win Rate and Avg. Return per screen | Rarely built in | Almost never, and rarely verifiable |
| Explanation of why it fired | Plain-English reason included in every alert | You interpret the chart yourself | Usually just a ticker and an entry price |
| Noise control | De-duplication, throttling, quiet hours | None, you control it by how often you check | None, depends entirely on group activity |
| Requires constant attention | No, alerts come to you | Yes, you have to keep checking | Yes, and calls can be missed in a busy chat |
| Coding or setup required | None, choose from 200+ curated screens | Often requires custom filters or Pine Script | None, but no control over what you see |
The comparison isn't about which tool is "best" in the abstract, it's about which approach fits how you actually spend your day. If you have a job that doesn't let you stare at charts, an alert-driven system built on backtested screens closes the gap that a manual refresh or an unverified Discord call simply can't. For a broader look at picking the right tool for your trading style, our guide to trading stocks without watching the screen all day goes deeper on the tradeoffs.
Frequently Asked Questions
Can I get push alerts for 1-minute setups?
Yes. ChartMath covers 7 timeframes including 1-minute, so you can subscribe to screens on the 1m chart. Keep in mind that 1-minute alerts fire often, so they work best on a small, focused list of tickers you're actively watching rather than your entire watchlist.
Do push alerts place trades for me automatically?
No. ChartMath is copilot, not autopilot. Every alert is informational: it tells you what happened, on which timeframe, and why. You decide whether it's worth acting on, and you tap to place every order yourself.
How do I stop getting too many alerts?
Favorite fewer screens, use watchlist mode instead of subscribing to every ticker in the universe, and set timezone-aware quiet hours around your work schedule. The built-in de-duplication and per-bar caps also prevent the same match from pinging you repeatedly.
How are alerts delivered?
By push notification and by email. Push keeps delivery instant through the app, and the email leaves you a searchable record if you want to look back at what fired earlier in the day.
What timeframes work best for intraday trading?
Most intraday traders lean on the 5-minute chart as a workhorse, with the 1-minute reserved for precise entries on names they're already watching, and the 15-minute for a lower-noise view when they can only check in every 20 to 30 minutes. There's no universally "best" timeframe, it depends on how often you can realistically look at your phone during market hours.
Turn Alerts Into a Repeatable Intraday Process
Missing an intraday setup because you were in a meeting isn't a personal failing, it's a monitoring problem, and monitoring problems have a mechanical fix. Pick the timeframes that match your schedule, subscribe to a small set of screens that fit your style, read every alert's Win Rate and Average Return before you act, and run the same 60-second workflow every time. That's the whole system. It doesn't require you to watch a single chart between alerts.
You can read the rule and the backtested record behind any of these setups before you install anything. Start with the VWAP reclaim screen (5M) or the opening range breakout screen (5M), then browse the full screen catalog. When you want the alerts themselves firing on your own watchlist, download the app. It's free, and no credit card is required.
Recommended Resources
- Watch Demo
- Web Based Screener

See these setups live in ChartMath
200+ curated screens with backtest data. Free. No credit card required.