How to Backtest Telegram Signals Before You Follow Them
You cannot backtest telegram signals as a stream, because a stream isn't a rule. You can only backtest the rule you reconstruct from it: a fixed entry, a fixed exit, a fixed universe, and enough repetitions to mean something. Do that, and you find out whether the setup behind the alerts actually has an edge, independent of how confident the person sending them sounds.
Key Takeaways
- Survivorship distorts the feed: winners get screenshotted and pinned, losers scroll away, so the visible record in any alert channel is not the real record.
- No fixed rule means no test: if entry criteria shift message to message, "it worked last week" is a sample of one, not evidence of an edge.
- Exits and size carry the outcome: "buying NVDA here" says nothing about stop, target, or how much capital is at risk, and that's where most of a trade's result actually comes from.
- Expectancy beats win rate: a 40% win rate with a 3:1 reward-to-risk ratio can out-earn a 70% win rate with a 1:3 ratio. Win rate alone is close to meaningless.
- Reconstruction makes it testable: write the signal as an if-then rule a stranger could follow, apply it to a fixed universe, and measure it across dozens of instances before trusting it with real money.
At a Glance: Alert Stream vs Reconstructed Rule
| Property | Typical Signal Group Alert | Reconstructed, Testable Rule |
|---|---|---|
| Entry criteria | Changes message to message, often discretionary | Fixed if-then condition, same every time |
| Exit defined before entry | Rarely stated | Stop and target set before looking at outcomes |
| Position size | Almost never specified | Fixed rule (e.g., capital split across max positions) |
| Visible record | Curated by what gets screenshotted | Every instance counted, wins and losses alike |
| Sample size available | Whatever you happened to save | Every historical match across a fixed universe |
| Recomputable by a third party | No | Yes, if the rule and universe are stated |
| Metric that matters | Implied "hit rate," unverifiable | Win Rate and Avg. Return across the full sample |
The Message That Started This
You're two hours into your workday, phone face-down next to your keyboard, when it buzzes. A Telegram group you've followed for four months just posted: "Adding to XYZ here, looks strong." You've held this group's calls before. Some worked. A couple didn't. You genuinely can't tell someone, with a straight face, whether following this channel has made you money over time. That uncertainty isn't a personal failing. It's a structural property of the format.
This isn't an argument that the person running the group is dishonest, or that the callers in it are unskilled. It's narrower than that. A stream of alerts, however well-intentioned, cannot be audited the way a fixed rule can. That's true whether the caller is right 80% of the time or 30% of the time, because nobody, including the caller, is tracking it the same way twice. Three structural problems make this true, and none of them are about character.
Problem One: Survivorship in the Feed
Screenshots get posted when a trade works. That's just how sharing behaves. Nobody screenshots the position they closed at a loss and quietly let scroll past. Over months, this creates a feed that looks like a highlight reel, not a ledger. If you tried to reconstruct a win rate purely from what's visible in the channel, you'd be measuring the group's posting habits, not its trading edge.
This is the same mechanism behind survivorship bias in any performance claim. Mutual funds that close underperforming products get excluded from "average returns" reporting. Signal groups that never post the losers get the same effect, just informally. The fix isn't to distrust the poster. It's to recognize that a curated feed cannot answer the question "does this actually work," because the losses were never entered into the record in the first place.
Problem Two: No Fixed Rule
Watch a channel for a month and you'll usually notice the entry logic isn't consistent. One call is "RSI oversold bounce." The next is "breaking out on volume." The one after that is "I like the chart here." Each of those might be a reasonable trade idea in isolation. None of them, taken together, forms a rule you could test, because a backtest needs a condition that's the same every single time it fires.
If the entry criteria shift from message to message, there's no shared rule to measure. "It worked last week" becomes a sample size of one, and one data point tells you nothing about whether an approach has an edge. You'd need the same rule to fire dozens of times, in different market conditions, before a win or loss count means anything. Without that consistency, every call is really its own experiment with no comparison group.
Problem Three: No Exit and No Size
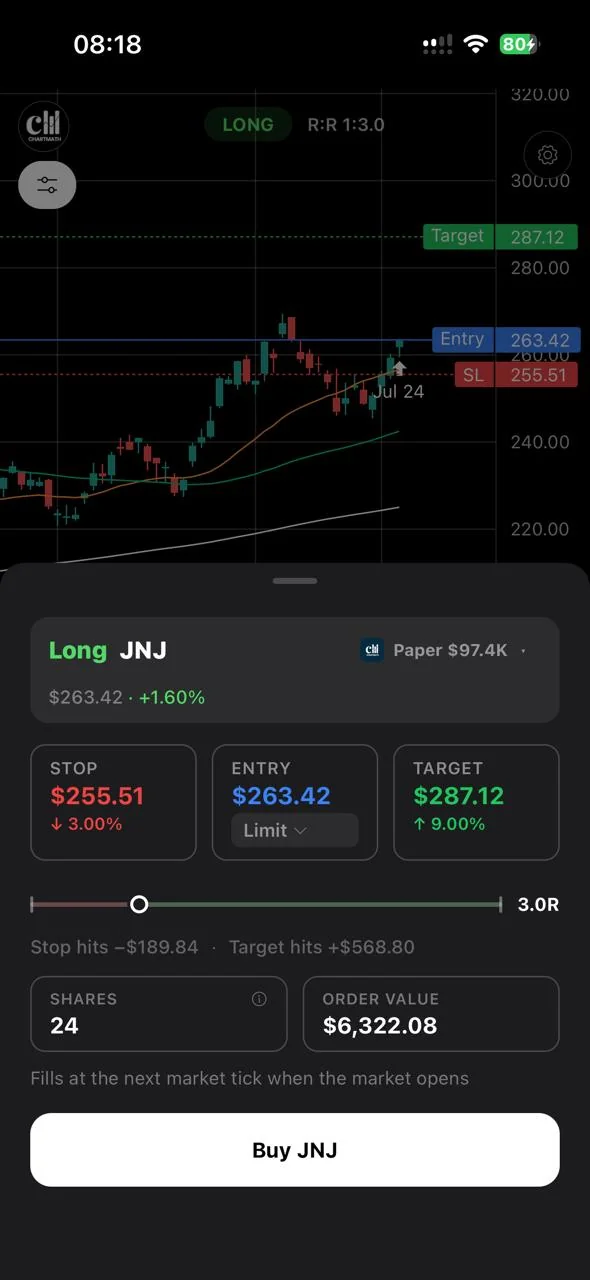
"Buying NVDA here" is an entry, and that's it. It says nothing about where you'd get out if it goes wrong, where you'd take profit if it goes right, or how much of your account you'd put behind it. Those three missing pieces, stop, target, and size, are where most of a trade's real outcome lives. Two people can act on the identical alert and land in completely different places depending on how they answered those questions on their own.
This is why "the call was right" and "the trade made money" are different claims. A caller can be directionally correct and you can still lose money, if your stop was too tight or your size too large. Conversely, a caller can be wrong on direction and you can still come out fine, if your risk was small and you exited early. None of that gets captured by whether the ticker eventually went up.
How to Reconstruct a Testable Rule From the Alerts You Already Get
None of this means the alerts are worthless. It means the alert itself isn't the testable unit. The rule behind it, once you extract one, is. Here's the process for pulling a testable structure out of a channel you already follow, without needing to code anything.
1. Write the signal as an if-then statement a stranger could follow
Not "buying here because it looks good," but something like: "if price closes above the 20-day moving average with RSI(14) crossing above 50, enter." If you can't reduce a caller's reasoning to a sentence like that, there's no rule to test yet, just an opinion.
2. Fix the universe the rule would have scanned
A caller picks one ticker, in hindsight, because it's the one that moved. To test fairly, you need to know what the rule would have flagged across a defined universe, on the same day, not just the single name that got mentioned. Otherwise you're only ever looking at the winner someone chose to talk about.
3. Fix entry, stop, and target before you look at outcomes
Decide your rule for all three in advance, on paper, before you check what happened. If you set your stop after seeing the low of the move, you've stopped testing and started storytelling.
4. Measure across a sample big enough to mean something
Five calls isn't a track record. Dozens of instances of the same rule, across different tickers and different weeks, start to tell you something. Fewer than that, and normal randomness can easily look like skill or lack of it.
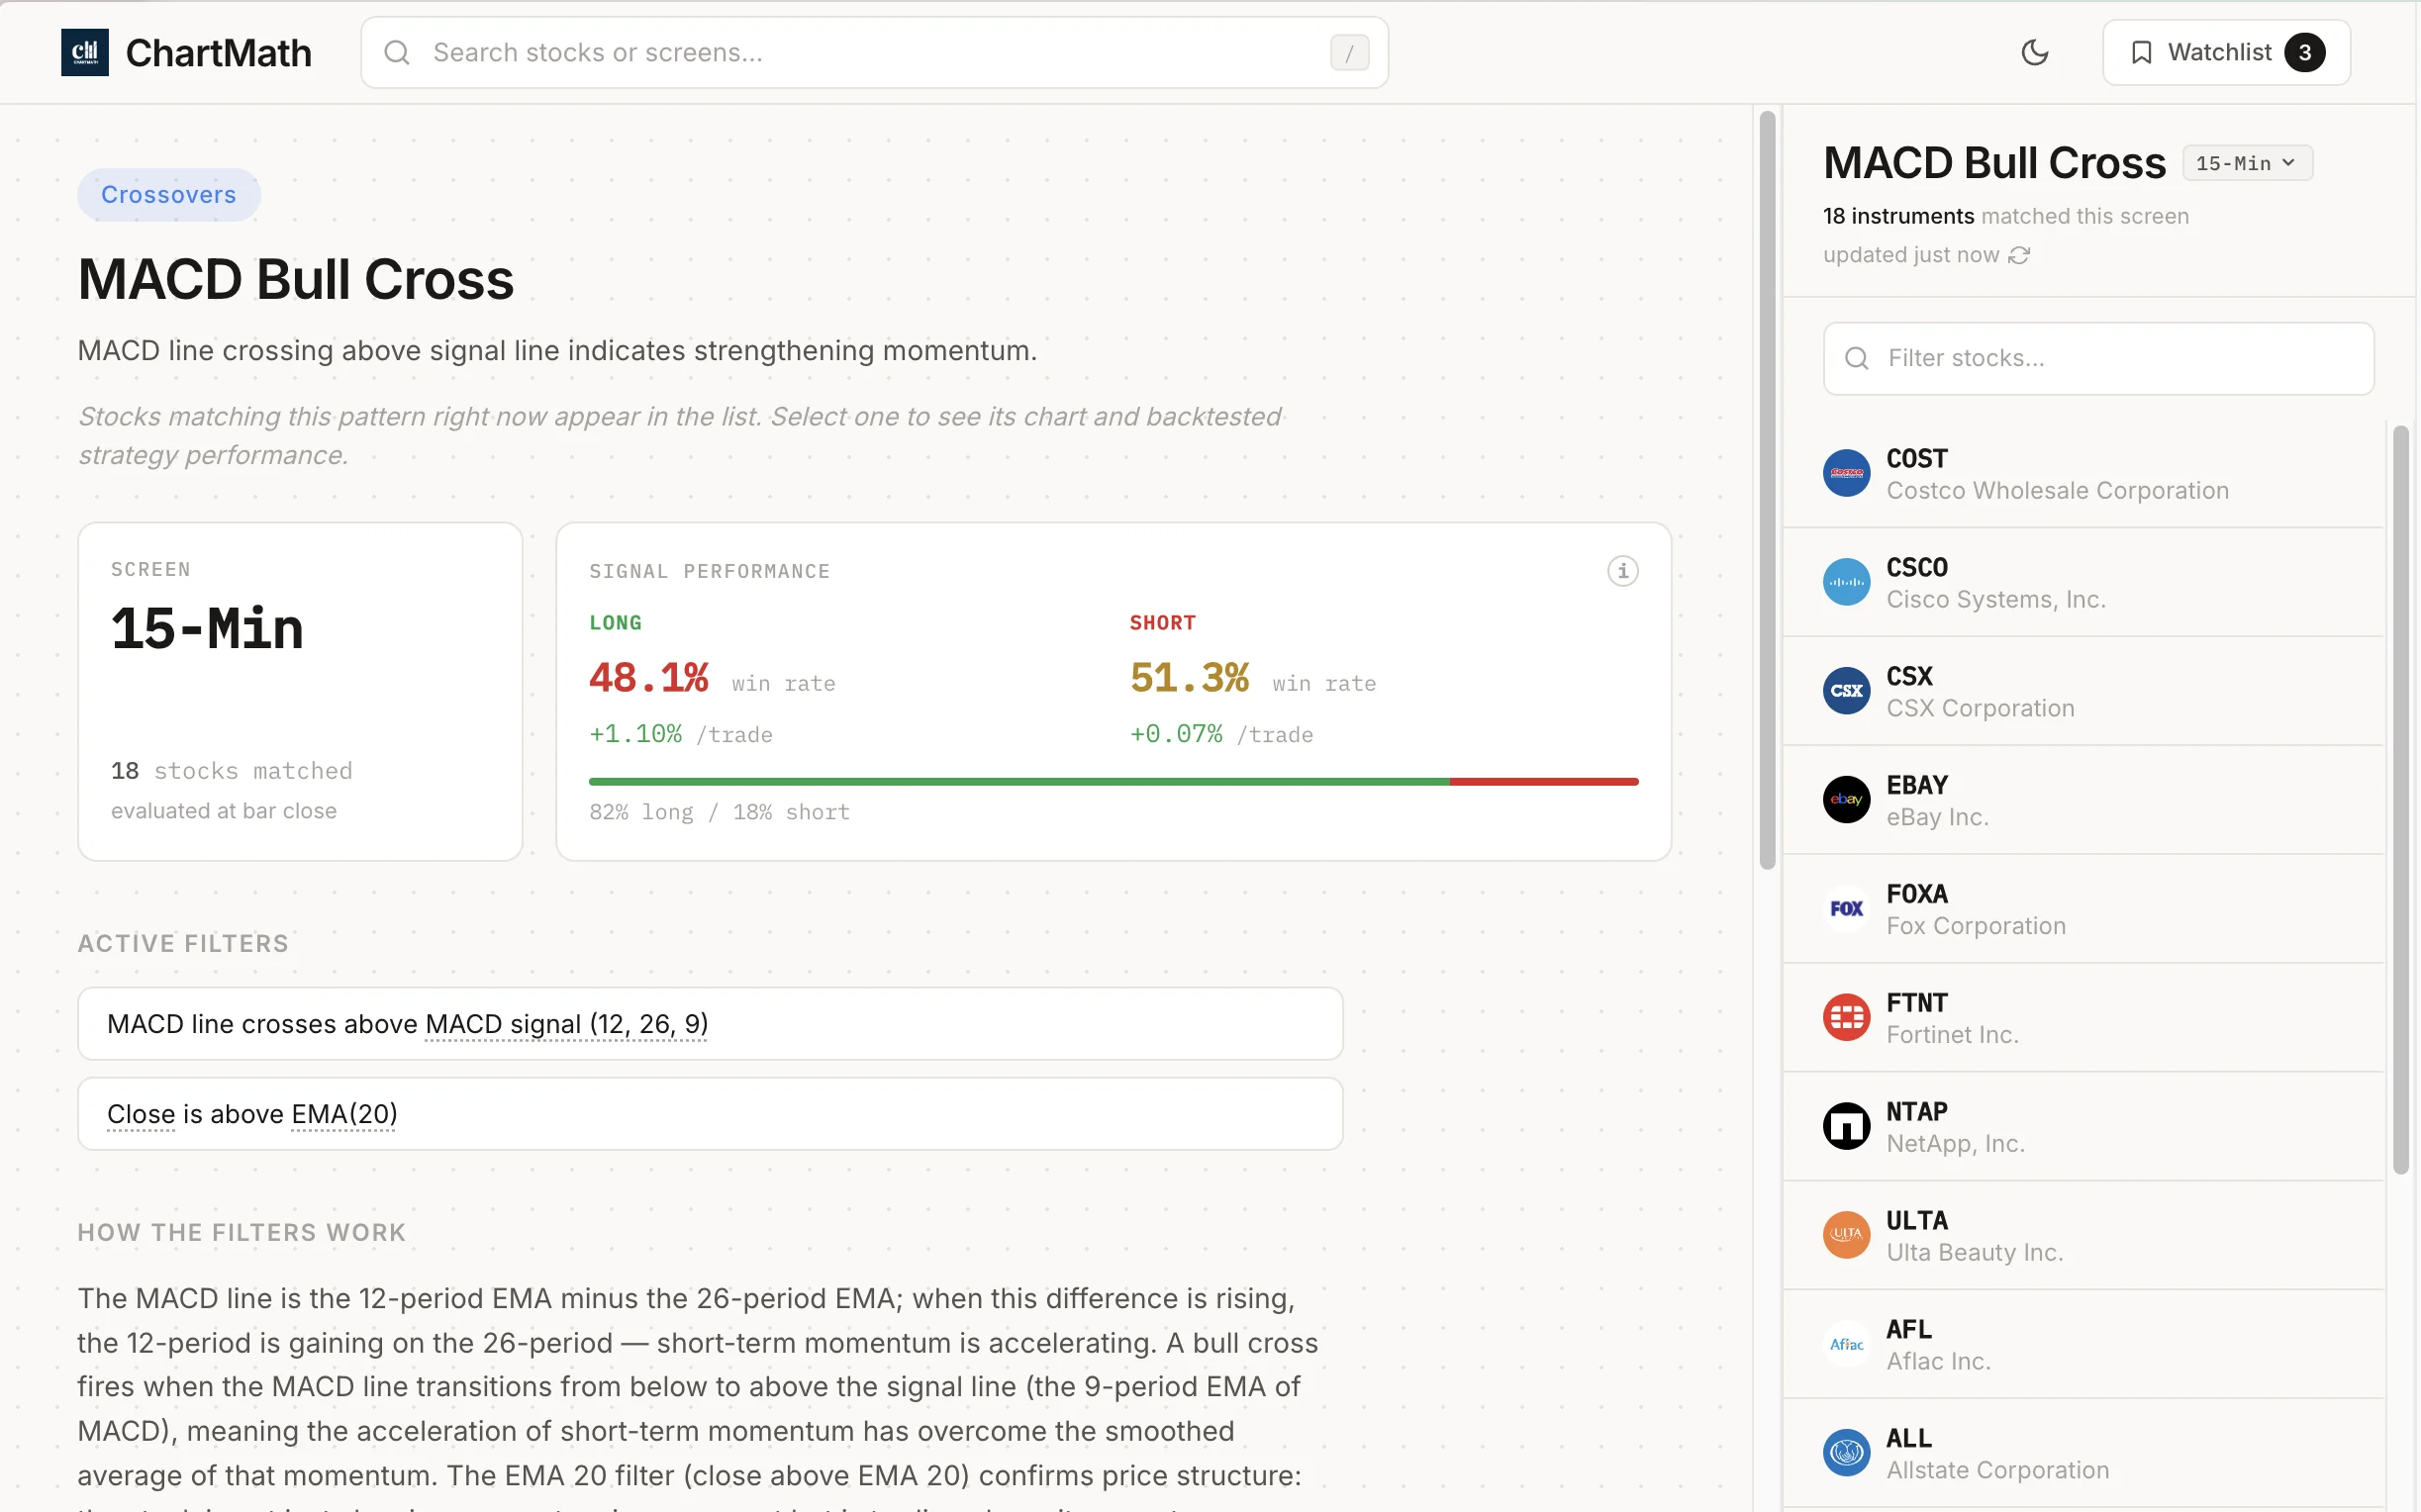
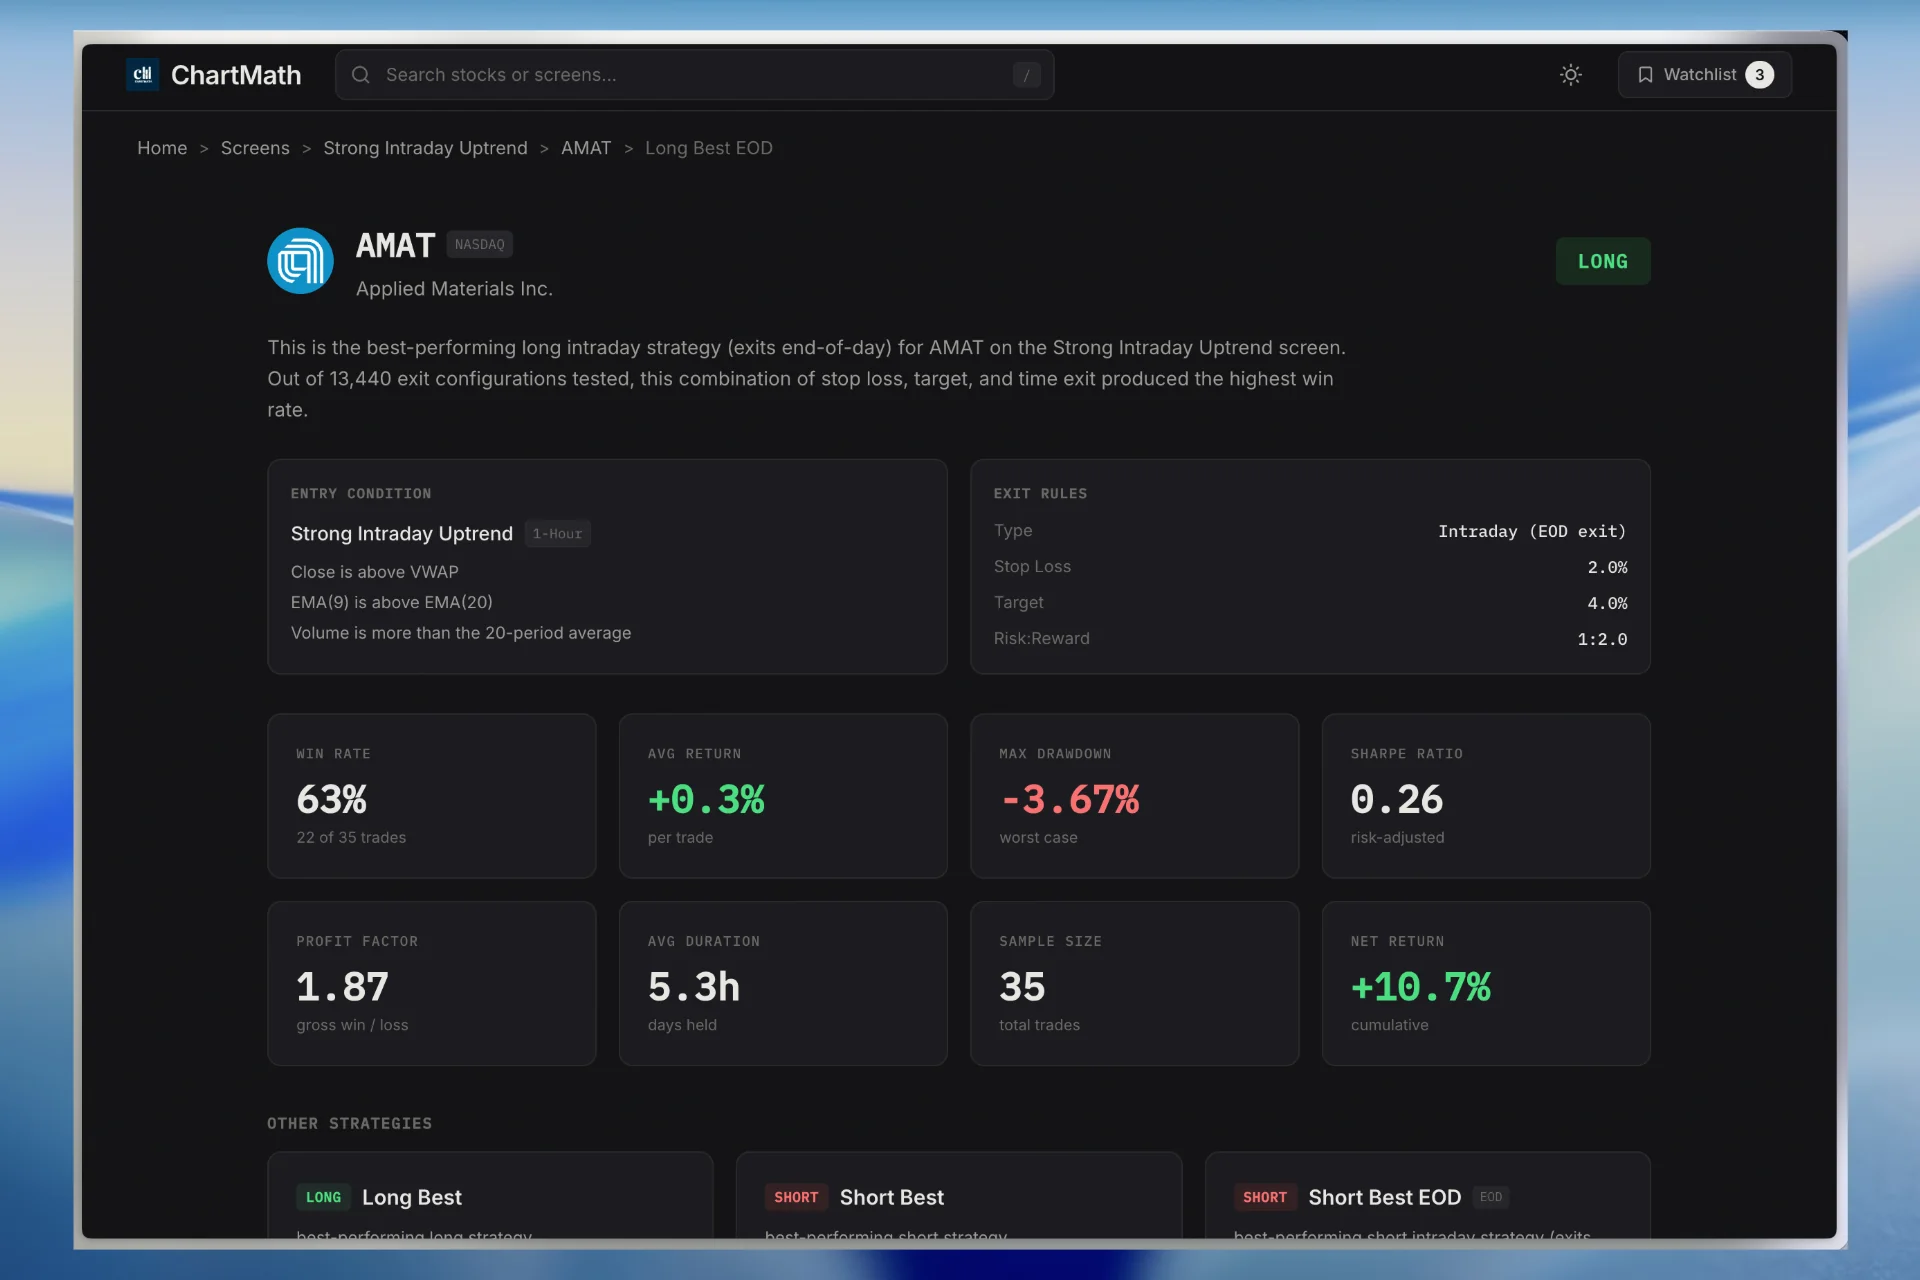
This is exactly the discipline behind a fixed, deterministic screen: a stated rule, run against a bounded universe, with every match counted and no editing after the fact. If you'd rather see this method already applied than reconstruct it by hand from screenshots, ChartMath runs 200+ of these screens across 500+ US equities, and every screen carries its own backtest, visible before you ever act on it. The RSI oversold bounce screen (1H) is a good one to read first, because it is exactly the kind of setup an alert channel would call by eye: the rule is written out, and the record underneath it is the whole sample rather than the memorable half. You can browse the full screens catalog without creating an account.
If you're building this habit for the first time, our guide on how to pick stocks for swing trading with a rules-based method walks through the same reconstruction process in more depth, and how to add screener alerts to your trading workflow covers what to do once you have a rule worth acting on.
Expectancy vs Win Rate: Why a 40% Rule Can Beat a 70% Rule
Once you have a fixed rule and a real sample, the number that matters isn't win rate. It's expectancy. Expectancy is roughly: (win rate × average win) minus (loss rate × average loss). A rule that wins 40% of the time but captures three times the reward for every unit risked can out-earn a rule that wins 70% of the time but only captures a third of a unit for every unit risked.
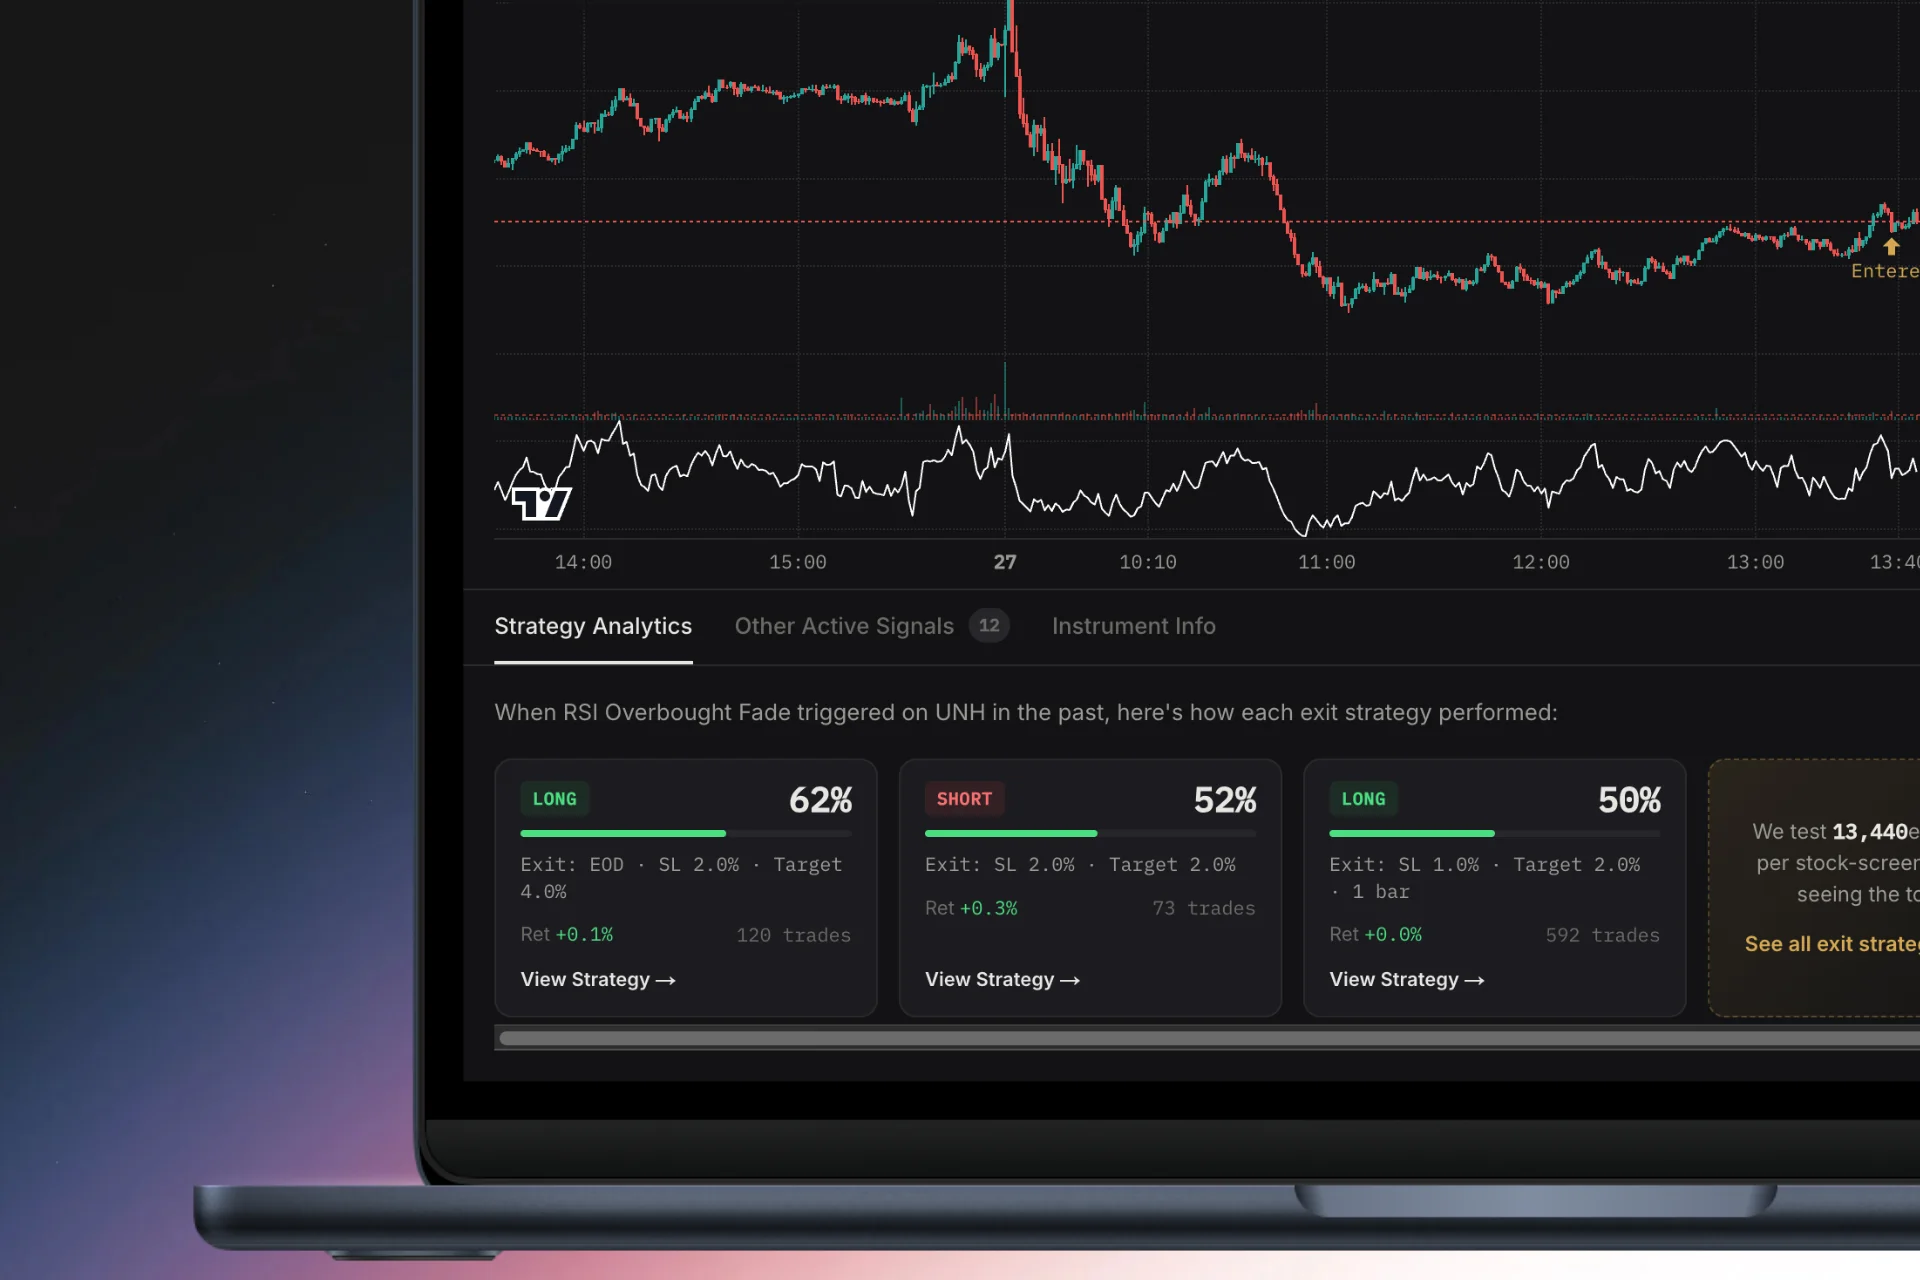
Most Telegram and Discord channels lead with an implied hit rate, "we've been on fire lately," without ever pairing it against the average size of the wins and losses. A high win rate with tiny wins and occasional large losses can be a losing system dressed up in confident language. This is precisely why ChartMath's screens report Win Rate and Avg. Return together, never win rate alone, and never "accuracy." One number in isolation tells you almost nothing about whether a rule is worth trading.
Our guide on how to use backtested win rate to pick trades works through that pairing trade by trade, and what to look for in a stock screener app covers which numbers a tool should be putting in front of you in the first place. To see the pairing on a live rule, the MACD Bull Cross screen (daily) reports its win rate and its average return side by side rather than one without the other.
Resulting: Why a Good Outcome Doesn't Mean a Good Decision
Poker players have a name for the trap of judging a decision by whether it happened to work: resulting. A player who goes all-in on a weak hand and gets lucky isn't rewarded for good judgment, just good fortune. Trading has the identical trap. If a caller says "buy here" with no stated rule and the stock goes up 8%, that outcome doesn't tell you the decision process was sound. It tells you this particular instance worked out.
This is also why a caller's hit rate is unfalsifiable when the entry was discretionary. If there's no fixed condition, there's no way to check, after the fact, whether the caller is quietly excluding trades that didn't work, adjusting the story after the fact ("I meant on a pullback"), or simply remembering the wins more vividly than the losses. None of that requires bad faith. It's how memory and storytelling naturally work when there's no fixed record to check against.
The way out isn't to find a better caller. It's to stop relying on any single discretionary source and instead build (or borrow) a rule that's fixed before the outcome is known, and test it against enough repetitions that a lucky run or an unlucky run can't distort your read of it. That's the entire difference between gut-feel trading and systematic trading, covered at length in how to stop trading on gut and start using data.
Numbered Recap: Rules for Turning an Alert Into a Real Test
- Don't test the alert. Test the rule behind it, once you've extracted one.
- Write the entry as an if-then statement specific enough that a stranger could apply it without asking a follow-up question.
- Fix the universe the rule would have scanned, not just the one ticker mentioned in the message.
- Set stop, target, and position size before you check what actually happened.
- Require a sample of dozens of matches, not five recent calls, before drawing a conclusion.
- Judge the rule by expectancy, win rate paired with average win and loss, not by win rate alone.
Auditability Is the Whole Point
None of this is about which source has the higher win rate. It's about which source you can actually check. A deterministic rule, applied to a fixed universe, produces a track record that anyone, including you, can recompute from scratch. An alert stream, no matter how good the caller's instincts are, cannot offer that, because the record depends on what got posted and remembered rather than what was defined in advance.
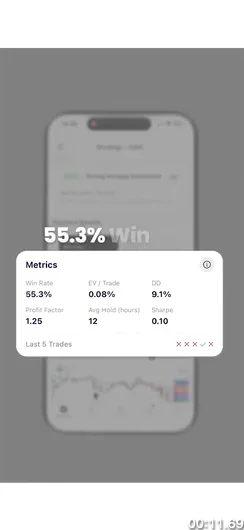
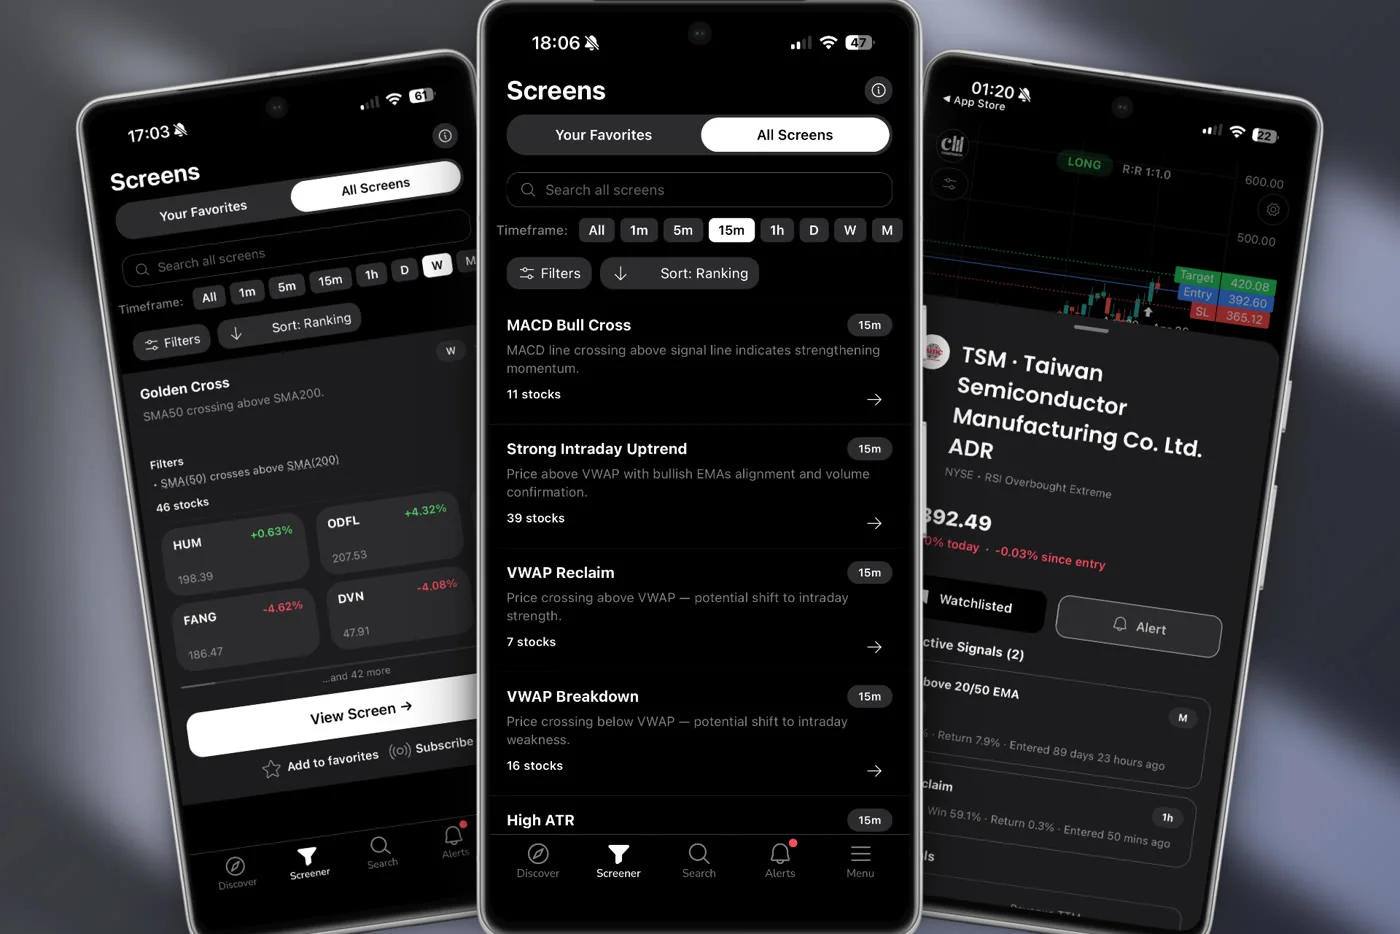
This is the entire premise behind ChartMath: 200+ deterministic technical screens, each carrying its own backtest across a fixed universe of 500+ US equities, across timeframes from 1-minute to monthly. Every screen states its rule in plain English before it ever sends you a push alert, and every backtest can be recomputed by anyone who wants to check it. That's what recomputability actually buys you: not a promise that a setup will work next time, but a historical record that isn't a highlight reel.
ChartMath is a copilot, not an autopilot. It narrows the field to setups with a documented rule and a stated Win Rate and Avg. Return; you still tap to place every order yourself. Paper trading is built in, so you can rehearse a setup as a simulated order, stop, target, and size pre-filled, before risking real capital, tracked right in the app's Portfolio tab. If you want to read the rules before installing anything, start with the screens catalog, or open a single screen such as new 20-day high (daily) and read its rule and its record end to end.
For a related deep-dive, see our comparison of the best stock scanner apps with real-time alerts, or real-time vs end-of-day scanner software. And if you want the head-to-head on the exact problem this post covers, read Telegram trading signals vs a backtested screener.
The next time an alert lands mid-meeting and you feel the pull to act on it, ask yourself the question this whole post has been circling: could you write this signal as a rule, apply it to every stock that would have qualified, and check the record? If the answer is no, you're not trading systematically yet, you're trading on trust. Get ChartMath free, no credit card required, and start replacing that trust with a record you can check yourself.
Recommended Resources
- Watch Demo
- Web Based Screener

See these setups live in ChartMath
200+ curated screens with backtest data. Free. No credit card required.