How to Screen AI Stocks Systematically in 2026
You trade AI stocks with a screener by ignoring the headline and testing the chart: run a curated list of AI and semiconductor names through backtested technical screens, check each screen's win rate and average return, then size the trade before you tap buy. That turns a hype-driven sector into a rules-based one.
Key Takeaways
- Screen technicals, not narratives: AI news moves fast and often wrong; a backtested rule like a moving average crossover or RSI reset gives you a repeatable entry signal instead.
- Pair win rate with average return: a screen that wins 65% of the time but loses big on the other 35% can still be a net loser. Read both numbers together.
- Keep the watchlist small: a dozen AI-exposed names across chipmakers, hyperscalers, and infrastructure plays is easier to monitor than fifty.
- Size before you enter: decide share count and stop distance before the trade, not after you're already in it.
- Sample size beats a hot streak: five winning AI trades in a row tells you almost nothing about whether the underlying screen actually has edge.
AI Stock Screening At a Glance
| Element | What it does | Why it matters for AI stocks |
|---|---|---|
| Technical screen | Fixed rule (e.g. RSI oversold, MACD cross) | Filters entries by price action, not by whoever posted the loudest AI take |
| Backtested win rate | Historical hit rate for that exact rule | Tells you how often the setup has actually worked, not how it feels |
| Avg. return | Average result per trade on that screen | Catches setups with a low win rate but a large edge, and vice versa |
| Timeframe | 1m to Monthly | AI names swing hard intraday; a 1-hour or Daily screen filters out noise |
| Watchlist | A short, curated list of tickers | Keeps screening focused on names you actually understand |
| Position sizing | Capital split across open positions | Prevents one AI trade from eating your whole account |
| Alerts | Push and email when a rule matches | Replaces refreshing a chart every ten minutes for the next AI headline |
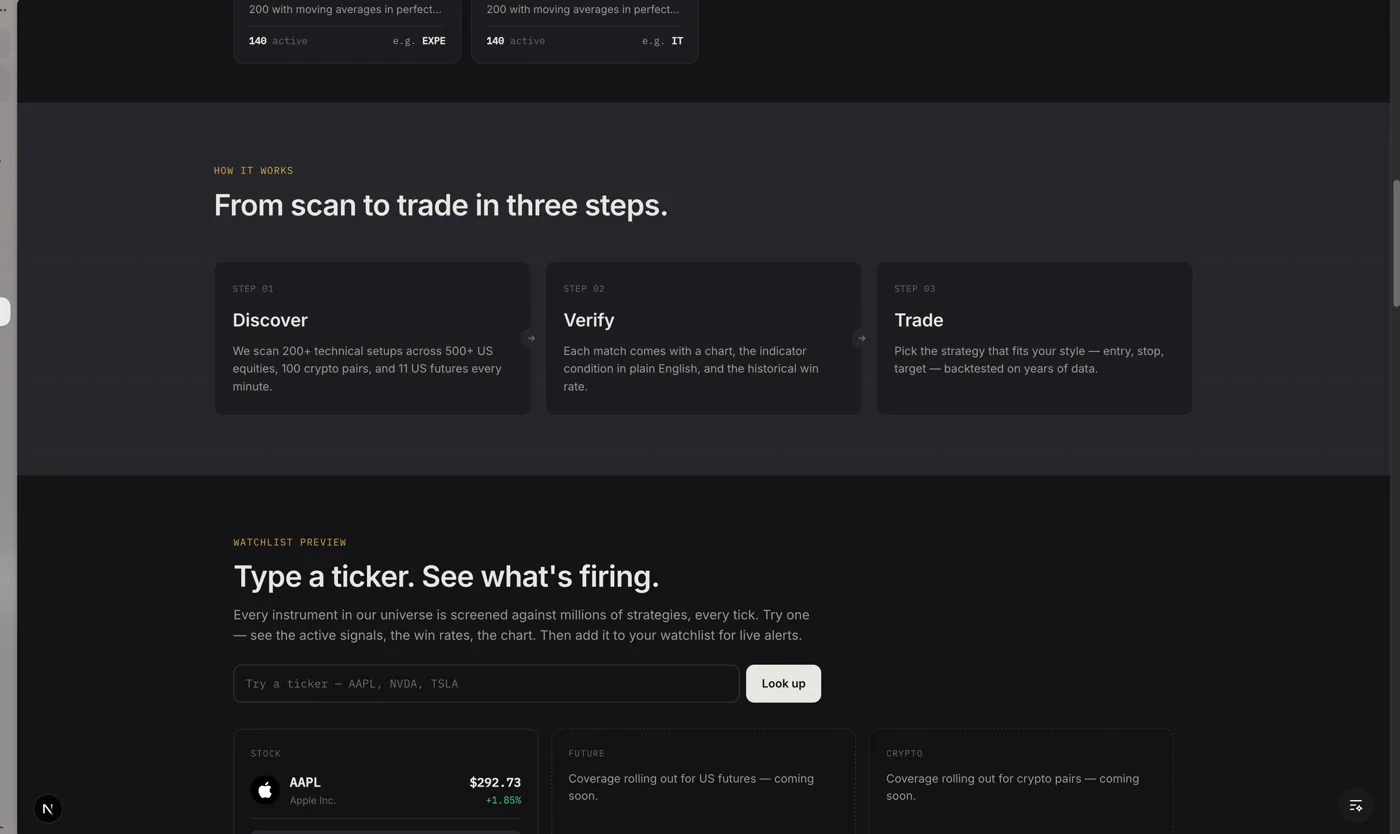
1. Build an AI and Semiconductor Watchlist Worth Screening
Start with a working list, not the entire sector. Chipmakers like TSM and AMAT, hyperscalers building out data centers, and infrastructure names tied to power and cooling all sit inside a curated 500+ US equity universe. You don't need to screen all of them at once.
Pick 10 to 15 names you actually recognize and can hold a position in for a few days. A bloated watchlist of 60 tickers means more noise, not more signal. According to FutureSearch's research on thematic screening, traditional screeners struggle to filter by narrative alone, which is exactly why a technical layer on top of your AI list does more work than a theme filter by itself.
Group your list into rough buckets: chip design, chip manufacturing, cloud infrastructure, and power/cooling suppliers. That way, when a screen fires on one name, you can quickly check whether the same setup is showing up across the sub-sector or if it's isolated to one ticker.
Naming the power/cooling and infrastructure bucket specifically
Beyond TSM (chip manufacturing) and AMAT (semiconductor equipment), the article's own bucket method points you toward two more sub-sectors worth screening separately: hyperscalers building out data centers, and the power/cooling suppliers that keep those data centers running. Rather than guessing at tickers, build this bucket the same way you built the chip bucket — pull the names from the 500+ US equity universe that show up under "cloud infrastructure" and "power/cooling," add them to your watchlist as their own group, and run the same technical screens against them. That keeps the depth of coverage consistent: the same rules-based process you use on TSM and AMAT applies directly to whichever infrastructure names you add.
If you're new to building this kind of watchlist from scratch, a rules-based method for picking swing trade candidates walks through the selection process in more depth.
2. Pick Technical Screens That Catch Momentum, Not Narrative
AI stock headlines change hourly. A stock can jump on a chip announcement, then reverse when a competitor undercuts pricing two days later. Fundamentals lag; price action doesn't wait for you to read the transcript.
This is why swing traders lean on momentum indicators: RSI, MACD crossovers, VWAP reclaims, and moving average crossovers like the golden cross. Each one is a fixed, testable rule. A golden cross on a semiconductor name means the 50-day average crossed above the 200-day, a structural trend signal you can backtest across years of that ticker's price history.
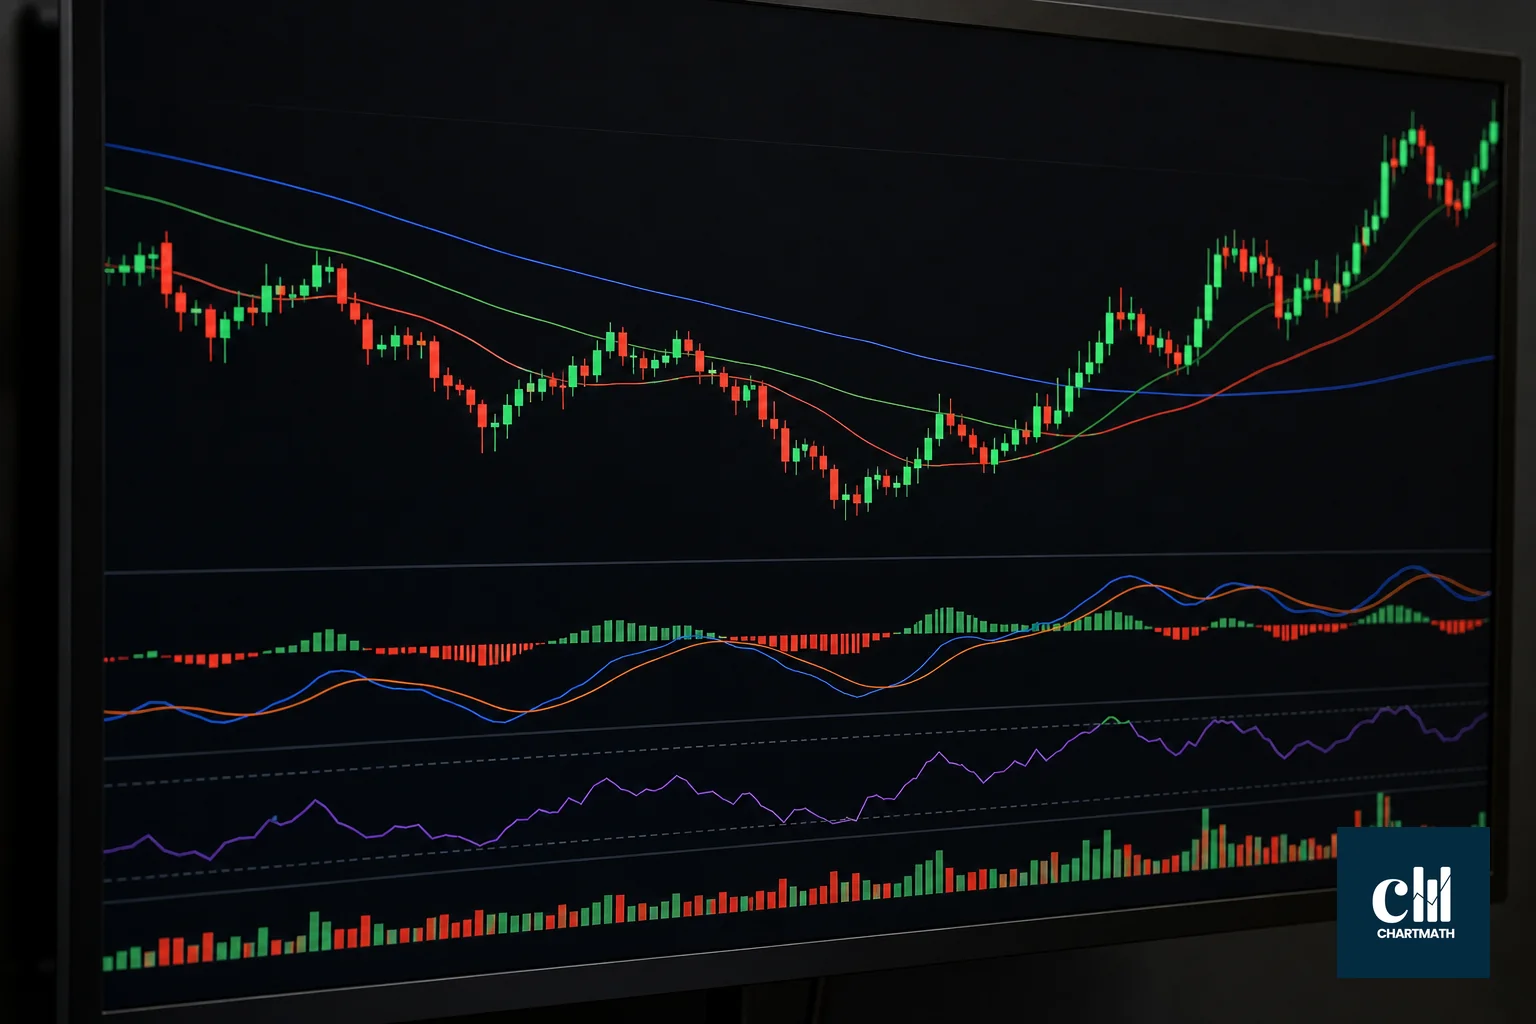
Volatility compression screens are also useful for AI names that have been consolidating after a big run. A tight range following a sharp move often precedes another leg, and a compression screen flags that setup mechanically rather than asking you to eyeball a chart.
For a sector-specific breakdown of which setups tend to fire most often on chip and AI infrastructure tickers, see Screen AI & Semiconductor Stocks Systematically, which goes deeper into the specific screens worth watching in this sector.
Which screens work best for AI names specifically?
Momentum and trend-continuation screens tend to outperform mean-reversion screens on AI stocks, because these names trend hard on capex cycles and product cycles rather than chopping sideways. That doesn't mean reversion setups are useless, just that trend screens usually get more matches.
3. Read the Win Rate and Avg Return Before You Enter
Every backtested screen carries two numbers you need before risking a dollar: Win Rate and Avg. Return. Neither one alone tells the full story. A 63% historical win rate sounds appealing on its own. But if the average loser is twice the size of the average winner, the math can still work against you.
Check the sample size too. A screen that has only fired 12 times in its backtest history doesn't give you much confidence. It doesn't matter how clean the win rate looks. Trading systematically as a beginner starts with understanding that a small number of past trades can lie to you. A hot streak in your own account can lie to you the same way.

This is also where ChartMath fits into an AI stock screening routine. Every one of its 200+ read-only screens carries a recomputable backtest. Instead of trusting a stat pasted into a Discord channel, you can check the win rate and average return attached to that exact rule before you act.
4. Size the Position Before You Tap Buy
Once a screen fires on an AI ticker, the next decision is how much to put on it, not whether it "feels right." A capital-split approach divides your total account by the number of positions you're willing to hold at once, which sets your share count automatically instead of guessing.
Worked example: sizing across your watchlist
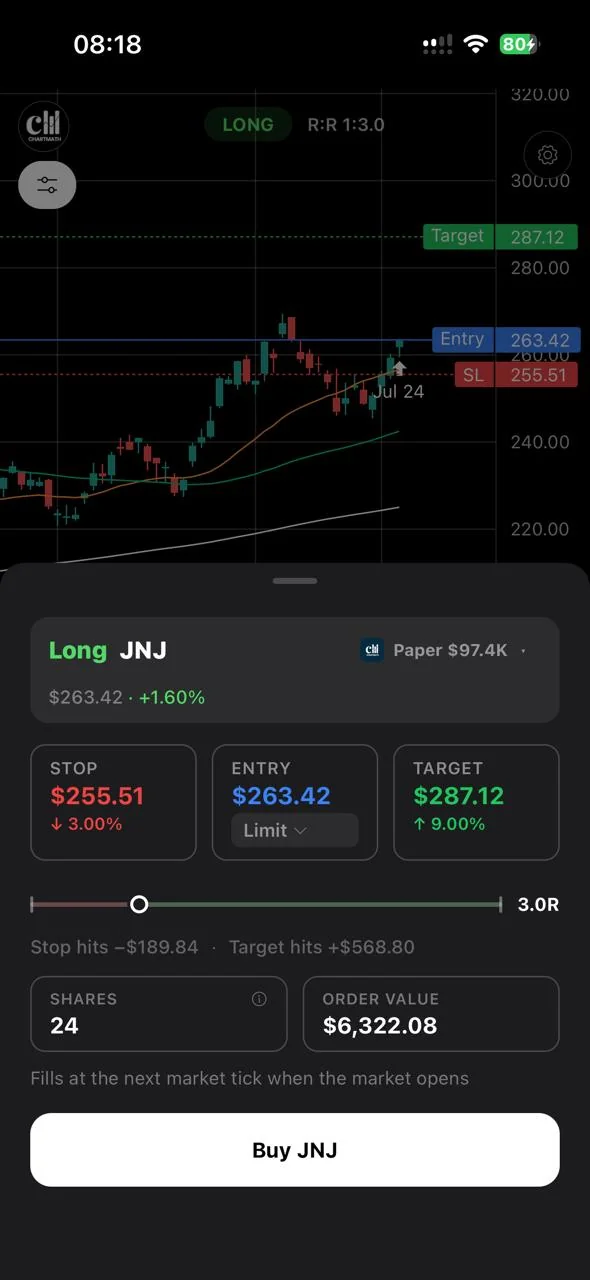
Say you built a 10-name AI watchlist, split across the chip design, chip manufacturing, cloud infrastructure, and power/cooling buckets described above, and you're willing to hold all 10 at once. A capital-split approach means each position gets one-tenth of your account, not a bigger bet on whichever ticker had the loudest headline that morning. From there, the ChartMath order ticket (see the STOP, ENTRY and TARGET fields in the screenshot below) lets you set an R-multiple, such as the 3.0R shown, and it works out the share count and order value for that one-tenth slice automatically. That's the whole point of sizing before you enter: the position size for each of the 10 names is decided by the split and the stop distance, not by how confident you feel about the trade.
Pre-filling your stop and target before entry removes the temptation to move a stop further out because a stock "just needs more room." Trading stocks with a full-time job depends on decisions like this being made ahead of time, not in the middle of a live move.
Paper trading the setup first
Paper trading a setup first lets you rehearse the exact entry, stop, and target with a simulated order before committing real capital. That matters even more with AI stocks, where volatility can be higher than the broader market and a sizing mistake shows up faster.
What's the Difference Between a Real-Time Scanner and an End-of-Day Screener?
A real-time scanner checks prices continuously through the trading session and can alert you within minutes of a setup forming, while an end-of-day screener runs its rules once after the close using that day's final data. For fast-moving AI stocks, a real-time scanner catches intraday breakouts an end-of-day pass would miss until the next morning.
That said, end-of-day screens still matter for swing setups on the Daily or Weekly timeframe, where you're not trying to catch the exact tick of a move. If you're holding an AI position for several days rather than scalping an intraday spike, a Daily screen checked once in the evening is often enough. Running screens across multiple timeframes to confirm a swing setup combines both approaches: a higher timeframe for trend context, a lower one for timing.
5. Set Alerts So You Don't Chase AI Headlines Intraday
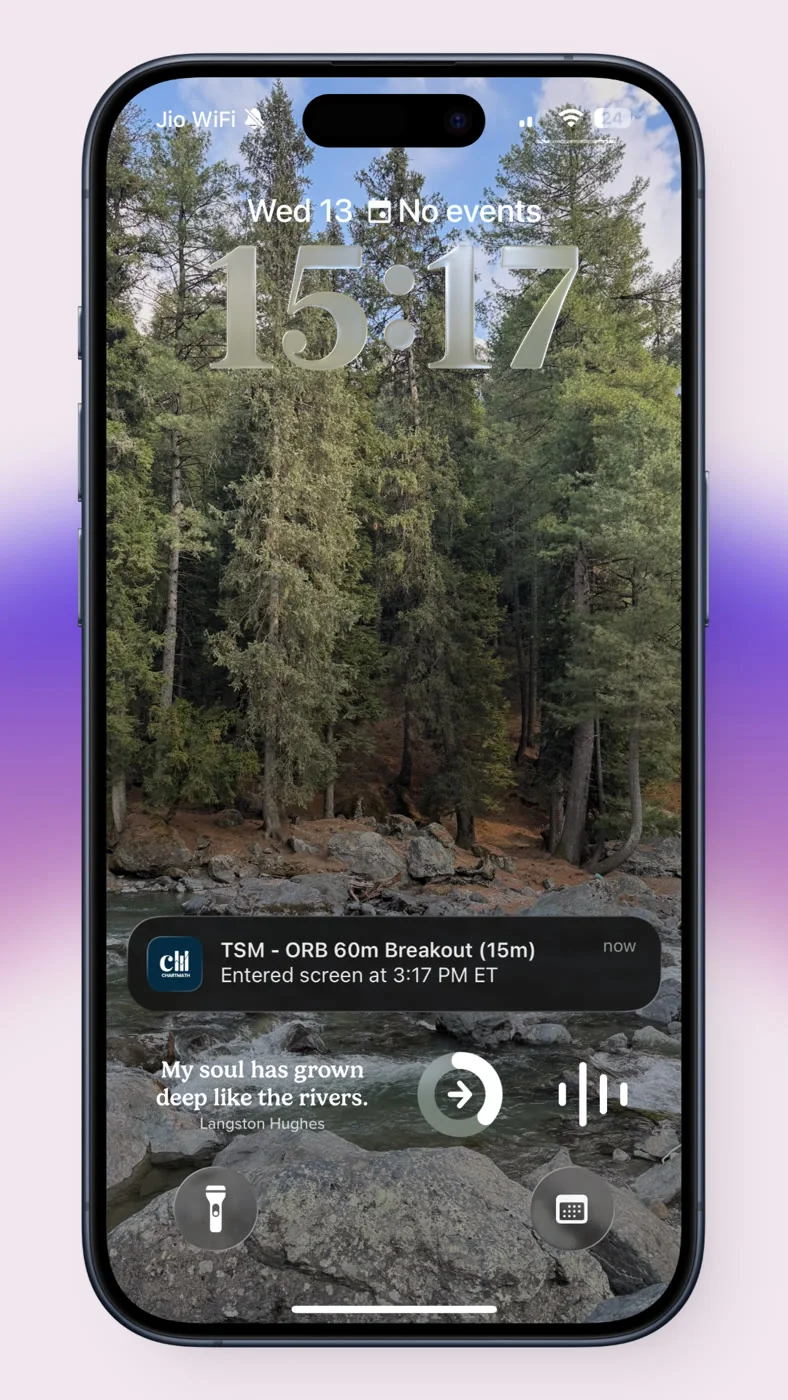
AI stocks generate a disproportionate share of financial news headlines, and every headline tempts you to react. Push and email alerts tied to a specific screen match give you a reason to check a chart, instead of a reason to refresh a news feed.
Favorite the screens you actually trade, then let screen-enter alerts do the watching. This avoids alert fatigue, where a flood of low-quality notifications trains you to ignore all of them, including the ones that matter. Adding screener alerts to your trading workflow covers how to set this up without drowning in noise.
Common Mistakes When Trading AI Stock Momentum
The most common mistake is chasing a gap after an AI headline instead of waiting for a screen to confirm the move technically. By the time the headline hits your feed, the easy entry is often already gone.
- Ignoring sample size: treating a screen's last five matches as proof of an edge, rather than checking the full backtested history.
- Overconcentration: holding five different chip stocks at once is really one large bet on the semiconductor sub-sector, not five diversified trades.
- Skipping the stop: AI names can gap on news overnight; a pre-set stop doesn't help if it's not actually in place before the move.
- Confusing win rate with certainty: a 60% historical win rate still means four losers out of ten. Position sizing has to account for that.
A backtested rule improves your odds of a repeatable process on a sector driven by capex announcements and policy headlines. It doesn't guarantee the next trade works, which is exactly why sizing and stops matter more than any single screen.
FAQ
What is relative volume in day trading?
Relative volume compares a stock's current trading volume to its average volume at the same point in prior sessions, expressed as a ratio. A reading above 2x or 3x on an AI stock often signals unusual interest, which is why many momentum screens require a minimum relative volume before a setup counts as valid.
Golden cross stocks today: how do I find them for AI names?
You find golden cross stocks by running a moving-average-crossover screen (50-day crossing above 200-day) against your AI and semiconductor watchlist and checking which tickers match on that day. Does the Golden Cross Actually Work examines how reliable this signal has been historically, which matters more than just knowing a cross occurred.
Stock scanner vs screener: which do I need for AI stocks?
A scanner typically runs continuously and alerts you in real time as conditions change intraday, while a screener runs a filter across a universe at a point in time, often end-of-day. For AI stocks, which can move fast on news, most active swing traders want a tool that does both: continuous scanning during the session plus a reliable end-of-day pass for planning the next day's watchlist.
How do I find momentum stocks before they break out?
Look for volatility compression screens (tight trading ranges after a prior move) combined with rising relative volume, since these often precede a breakout rather than confirm one after the fact. Waiting for the breakout candle itself means you're entering after the easiest part of the move has already happened.
Why doesn't a high win rate guarantee trading profits?
A high win rate only tells you how often a rule was right historically, not how large the wins or losses were. A screen that wins 70% of the time but loses three times as much on its losers as it gains on winners can still lose money over a large sample. Always read win rate next to average return, never alone.
The screen filters the field. You still decide whether to take the trade, size it, and place it. That's the copilot model: narrower choices, not automated ones.
If you're ready to put this into practice, download the ChartMath app and run a backtested screen against your own AI watchlist before your next trade. Prefer to browse from a desktop first? The web-based screener lets you look through all 200+ screens and their backtested records without installing anything. And if you want to see the workflow end-to-end before committing, watch the demo to see how a screen match turns into a sized, paper-tested order.
Recommended Resources

See these setups live in ChartMath
200+ curated screens with backtest data. Free. No credit card required.