Do Stock Screeners Explain Why a Signal Triggered?
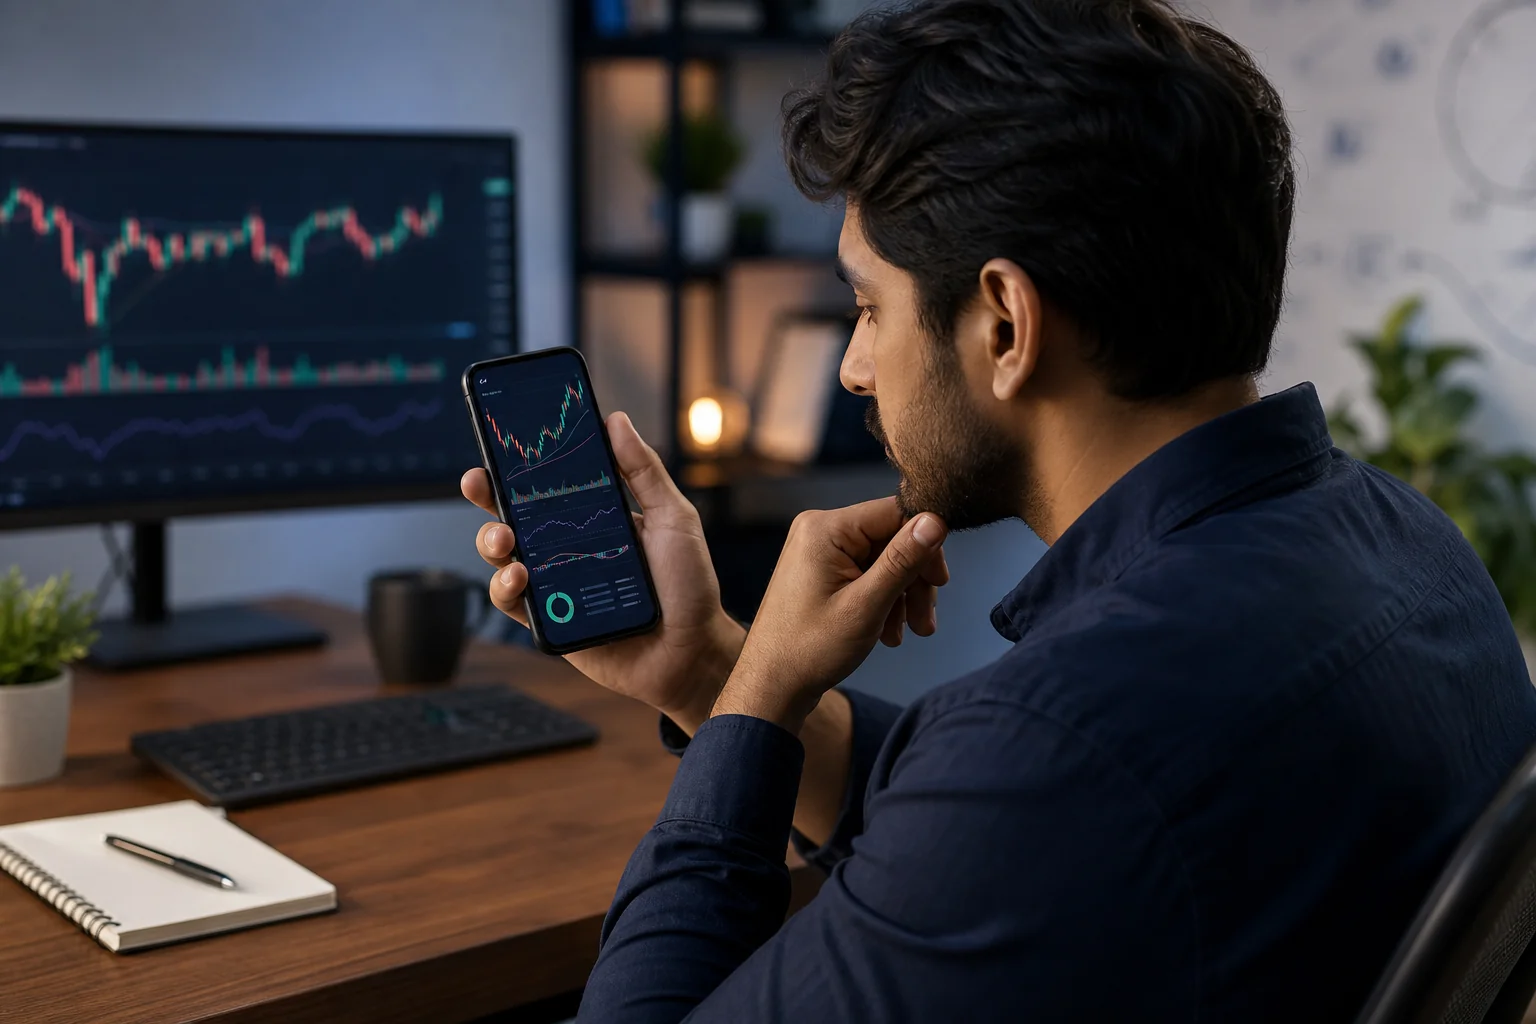
Your phone buzzes at 11:14 AM. You're in a meeting, half-listening, and you glance down to see a push alert: "DASH entered RSI Oversold." You nod along in the meeting, but a part of your brain is stuck on that alert. Why did it fire? What actually happened on the chart? Is this worth acting on, or is it noise? By the time you get five minutes to check, the move might already be over, and you still don't know what triggered it in the first place.
This is the daily experience for most retail traders using a typical stock screener. The tool flags a match. It does not explain the match. You're left to reverse-engineer the setup from a bare ticker symbol and a rule name, guessing at whether the signal means what you think it means. That gap, between "here's a match" and "here's why it matched," is the single biggest reason systematic trading feels harder than it should for beginners and people trading around a day job.
This guide breaks down what a stock screener with plain English signal explanations actually looks like, why the absence of that explanation quietly costs traders time and money, and what to check for before you trust any tool with your watchlist. We'll also walk through how ChartMath structures its alerts around a plain-English reason, a backtested Win Rate, and an Average Return, so you can see a concrete example instead of an abstract idea.
What a "Plain English Signal Explanation" Actually Means
A plain-English signal explanation is a short, human-readable sentence that tells you exactly which rule fired, on which timeframe, and what price action caused the match. It's the difference between a screener that says "KEYS: VWAP Reclaim" and one that says "KEYS reclaimed VWAP on the 1-hour chart, matching this screen's rule for a volume-backed move back above the average price." The first version is a label. The second is a reason.
That distinction matters more than it sounds. A label tells you a pattern name matched somewhere in the code. A reason tells you what actually happened on the chart, in terms you can check against the price action yourself. Once you can see the "why," you stop treating the alert like a black box and start treating it like evidence you can verify.
Most legacy screeners were built around filters, not narratives. You set a rule (price above the 50-day moving average, RSI under 30, relative volume above 2x), and the tool spits out a list of tickers that match. That's useful for narrowing a universe of stocks. It's not the same as telling you, in plain terms, why a specific stock made that list today and not yesterday. When you have to manually reconstruct the logic every time an alert fires, you're doing the tool's job for it, on your own time.
A stock screener that shows a match without a reason is asking you to trust it blindly or do the analysis yourself. Neither option works well for a trader who also has a day job.
Why the Missing "Why" Is a Hidden Cost for Beginner and Part-Time Traders
If you trade full-time and live at your desk, an unexplained alert is a minor inconvenience. You can pull up the chart, study the price action, and figure out the setup in a minute or two. But if you're squeezing trades in around a job, a commute, and a family, that minute or two doesn't exist. It gets skipped, and skipped analysis turns into one of two bad habits.
The first bad habit is reverse-engineering under time pressure. You see the alert, you have four minutes before your next meeting, and you try to piece together why the stock might be moving. That's rushed analysis, and rushed analysis is where mistakes creep in. You might mistake a random spike for a genuine breakout, or miss that the "signal" was really just noise around a low-volume stock.
The second bad habit is worse: blind trust. If reverse-engineering takes too long often enough, traders stop trying. They just act on the alert because it showed up, with no idea whether the rule behind it has ever actually worked. That's not systematic trading. That's gut instinct wearing a systematic trading costume. The whole point of using a stock scanner instead of scrolling charts by feel was to remove exactly this kind of guesswork.
Alert Fatigue Makes the Problem Compound
There's a third cost that builds slowly: alert fatigue. When a trader gets pinged constantly by signals they don't understand, and a chunk of those signals turn out to be duds, the natural response is to start muting notifications or ignoring the app altogether. The tool that was supposed to save time ends up adding noise instead. We've covered this pattern in more detail in our piece on watchlist alerts for swing trades that fire at the right time, but the short version is: an alert without context trains you to stop paying attention to alerts.
There's also a subtler, more dangerous cost tied to sample size. If you don't know a rule's win rate or how many times it's actually fired historically, you're left drawing conclusions from whatever you've personally seen: the last three or four trades. Three winning trades in a row feels like proof. It isn't. Small samples lie constantly, and a screener that hides the "why" also tends to hide the track record behind the rule, leaving you to build false confidence on a handful of anecdotes.
What to Look for in a Screener That Shows Its Work
If you're evaluating a stock screener with plain English signal explanations, run it through this checklist before you rely on it for real decisions.
- Does it name the exact rule, not a vague tag? "Momentum setup" tells you nothing. "Price closed above the 20 and 50 EMA with rising volume" tells you something you can check on the chart.
- Does it state the timeframe? A signal on the 5-minute chart and the same signal on the daily chart mean very different things for a swing trader. The explanation should say which one fired.
- Does it pair the explanation with a backtested Win Rate and Average Return? A reason without a track record is still just a story. A reason with a documented history is evidence.
- Does it show sample size? A 70% win rate over 8 occurrences means almost nothing. The same win rate over 200+ occurrences is a different conversation entirely.
- Does it avoid vague or inflated language like "accuracy"? Trading outcomes involve return distribution, not a single accuracy score. Tools that use precise vocabulary like Win Rate and Average Return are generally being more careful with what they claim.
- Can you verify it yourself? A good explanation lets you pull up the actual chart and confirm the reasoning, instead of asking you to take the tool's word for it.
This checklist applies whether you're looking at a paid platform, a free scanner, or a signal shared in a Discord server. If any of these boxes go unchecked, you're back to reverse-engineering or blind trust, the exact two problems a good screener is supposed to solve.
Comparing How Popular Tools Handle the "Why"
Retail traders typically land on one of a few tools: a charting platform like TradingView, a static filter tool like Finviz, an informal signal group on Discord or Telegram, or a purpose-built trade discovery app. Here's how they stack up on explaining the signal, not just showing it.
| Tool | Plain-English "Why" | Backtested Win Rate Shown | Push Alerts | Sample Size Shown | Cost Model |
|---|---|---|---|---|---|
| TradingView (screeners/alerts) | No, requires reading your own Pine Script or indicator setup | No, backtesting is a separate manual step | Yes, though alert limits vary by plan (check their current tiers) | No | Free tier plus paid tiers |
| Finviz | No, static filter results only | No | No push alerts | No | Free tier plus paid tiers |
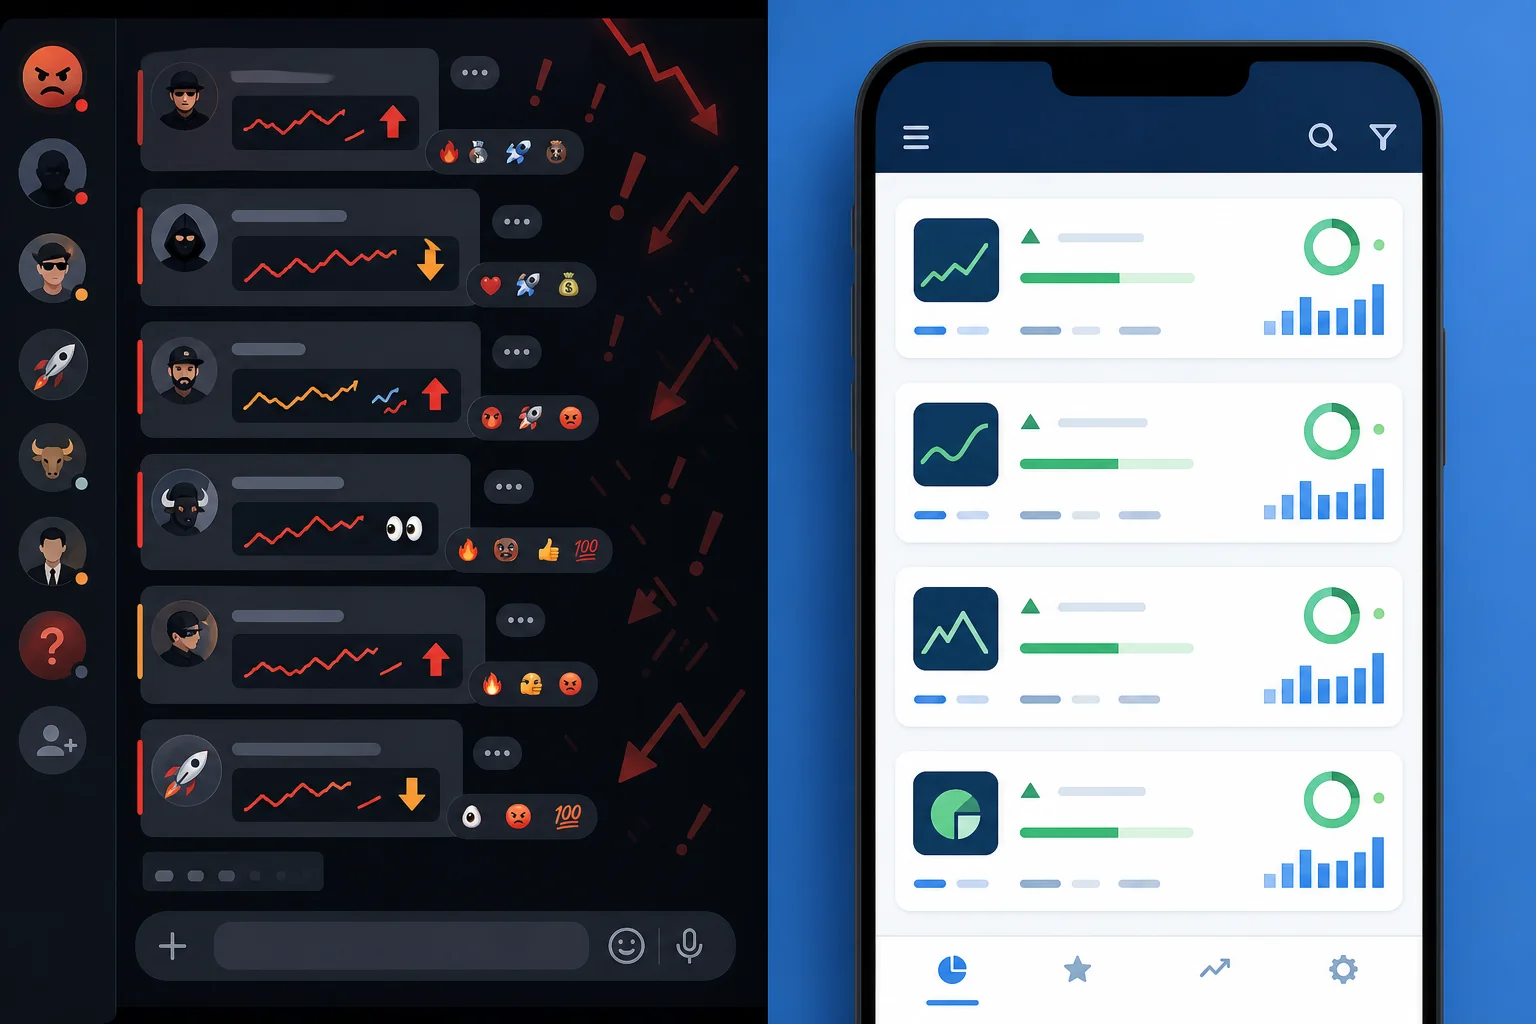
| Discord/Telegram signal groups | Sometimes, but informal and unverifiable | Rarely, and usually self-reported by the poster | Depends on the group's notification setup | Almost never | Often free or subscription-based |
| ChartMath | Yes, every alert includes a plain-English reason it fired | Yes, Win Rate and Avg. Return per screen | Yes, via push and email | Yes, matched count shown per screen | Free, no credit card required |
TradingView is a genuinely powerful charting platform, and plenty of traders use it as their base. But its screening tools are built around indicator values and Pine Script conditions, meaning the "why" lives in code you have to read and understand yourself. Finviz is fast and useful for a first pass on a universe of stocks, but it's a static filter: no alerts, no explanation, no historical context on whether the pattern has ever worked. Signal groups on Discord and Telegram add a human voice to the call, but that voice is unverified. There's no backtest behind most of what gets posted, and the track record is whatever the poster chooses to share, which tends to be their wins.
How ChartMath Pairs Every Signal With Plain English, a Win Rate, and an Average Return
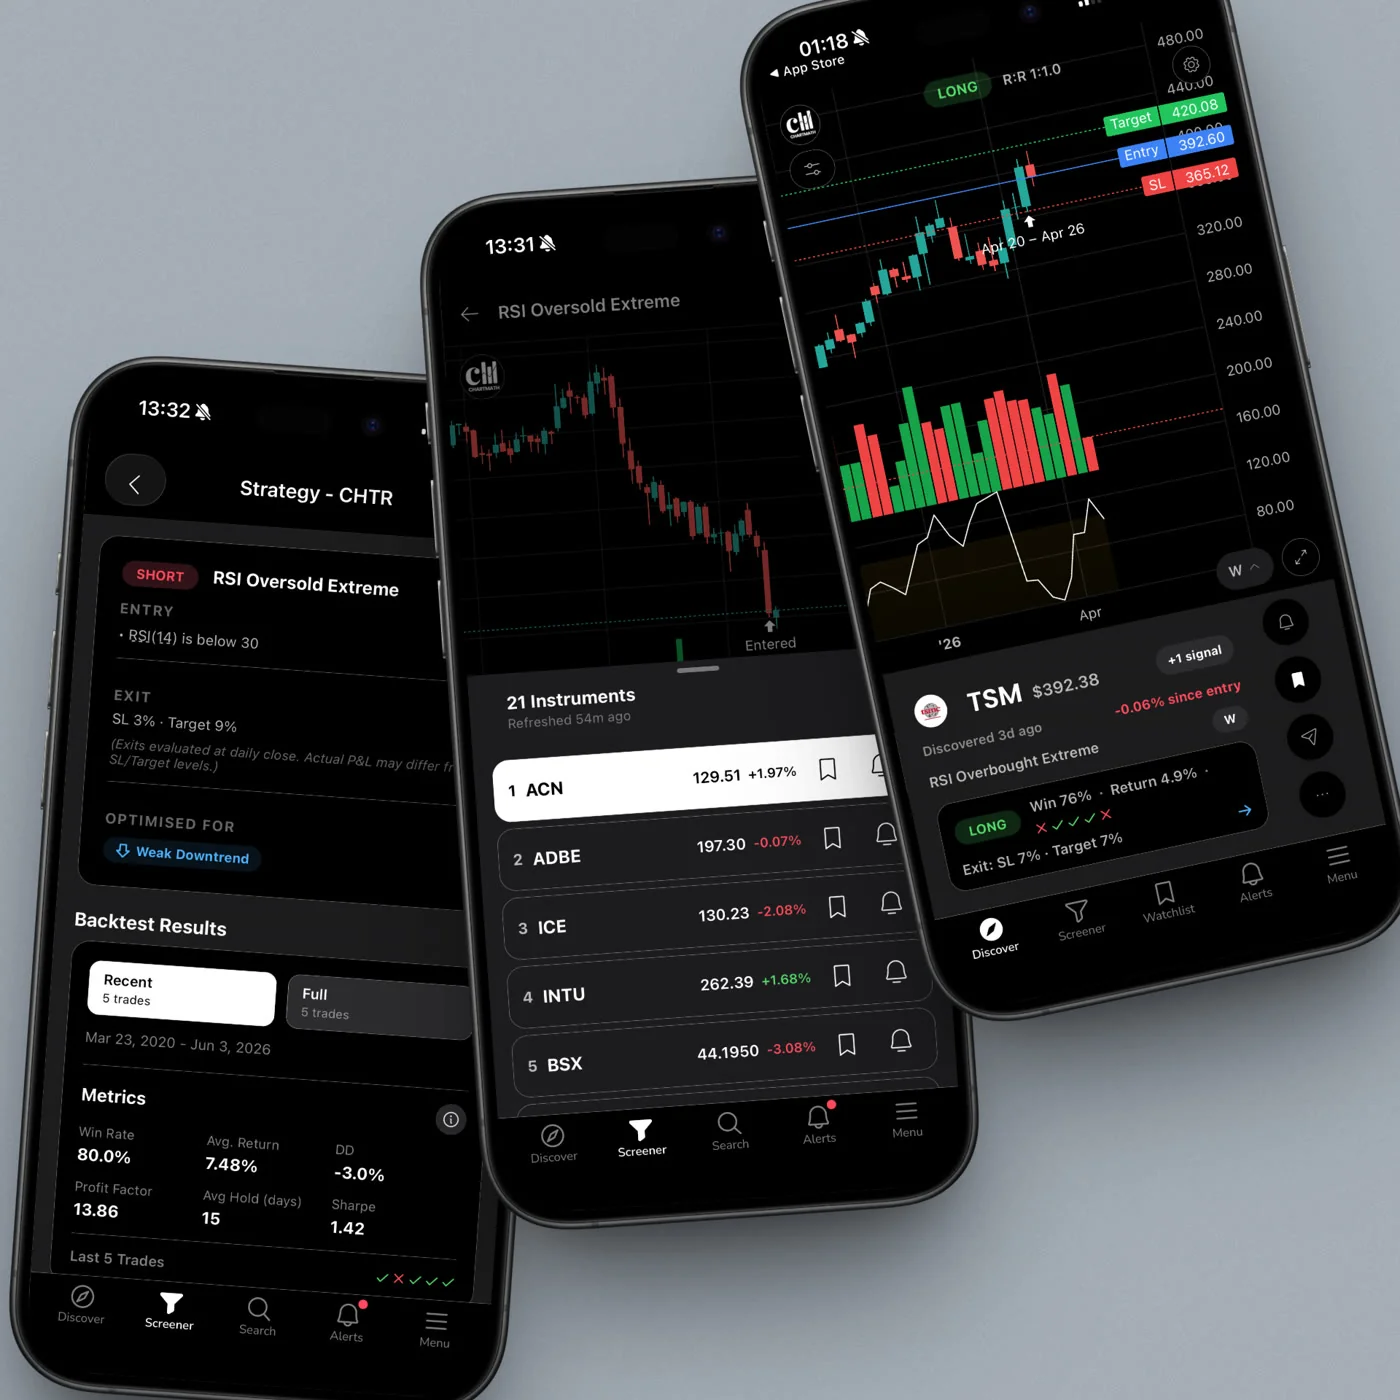
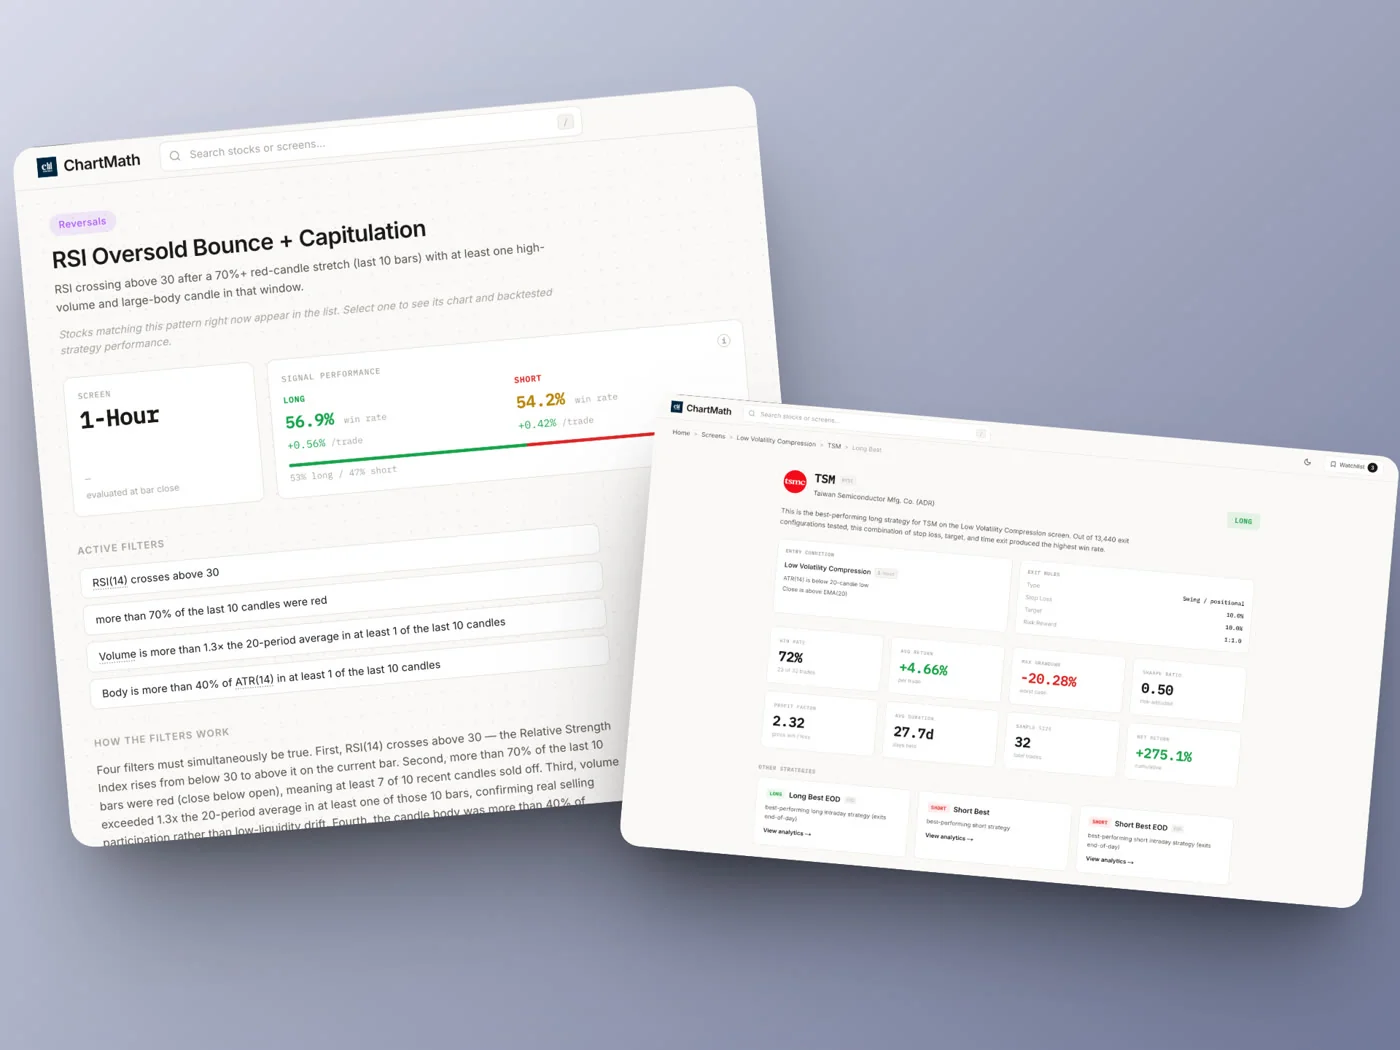
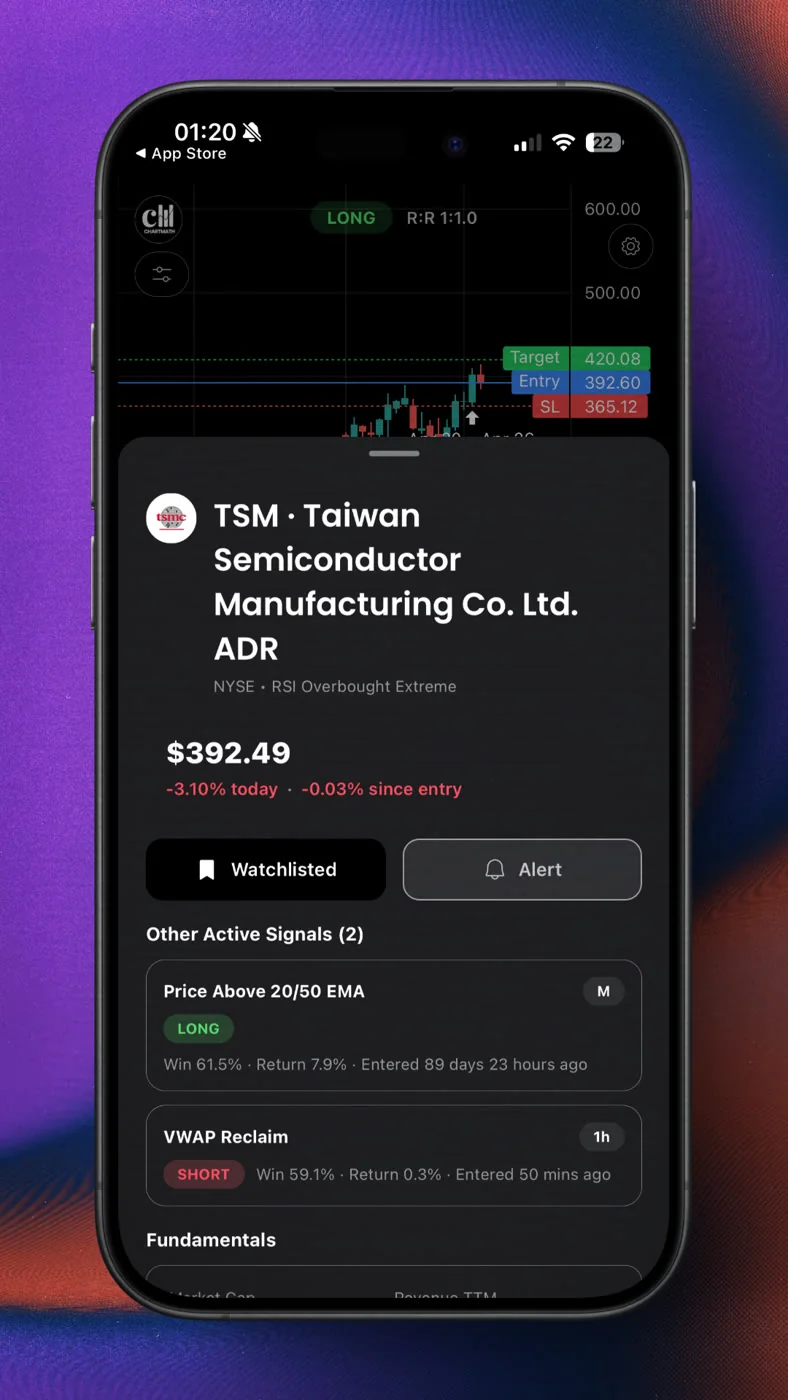
ChartMath was built specifically to close the gap between "a match happened" and "here's why it matters." Every card in the Discover feed follows the same structure: the symbol, the screen name, the timeframe it matched on, and a plain-English line explaining why the setup fired right now. Instead of "AAPL: Golden Cross," you get something closer to "AAPL's 50-day moving average crossed above its 200-day moving average on the Daily chart, matching the Golden Cross screen's rule."
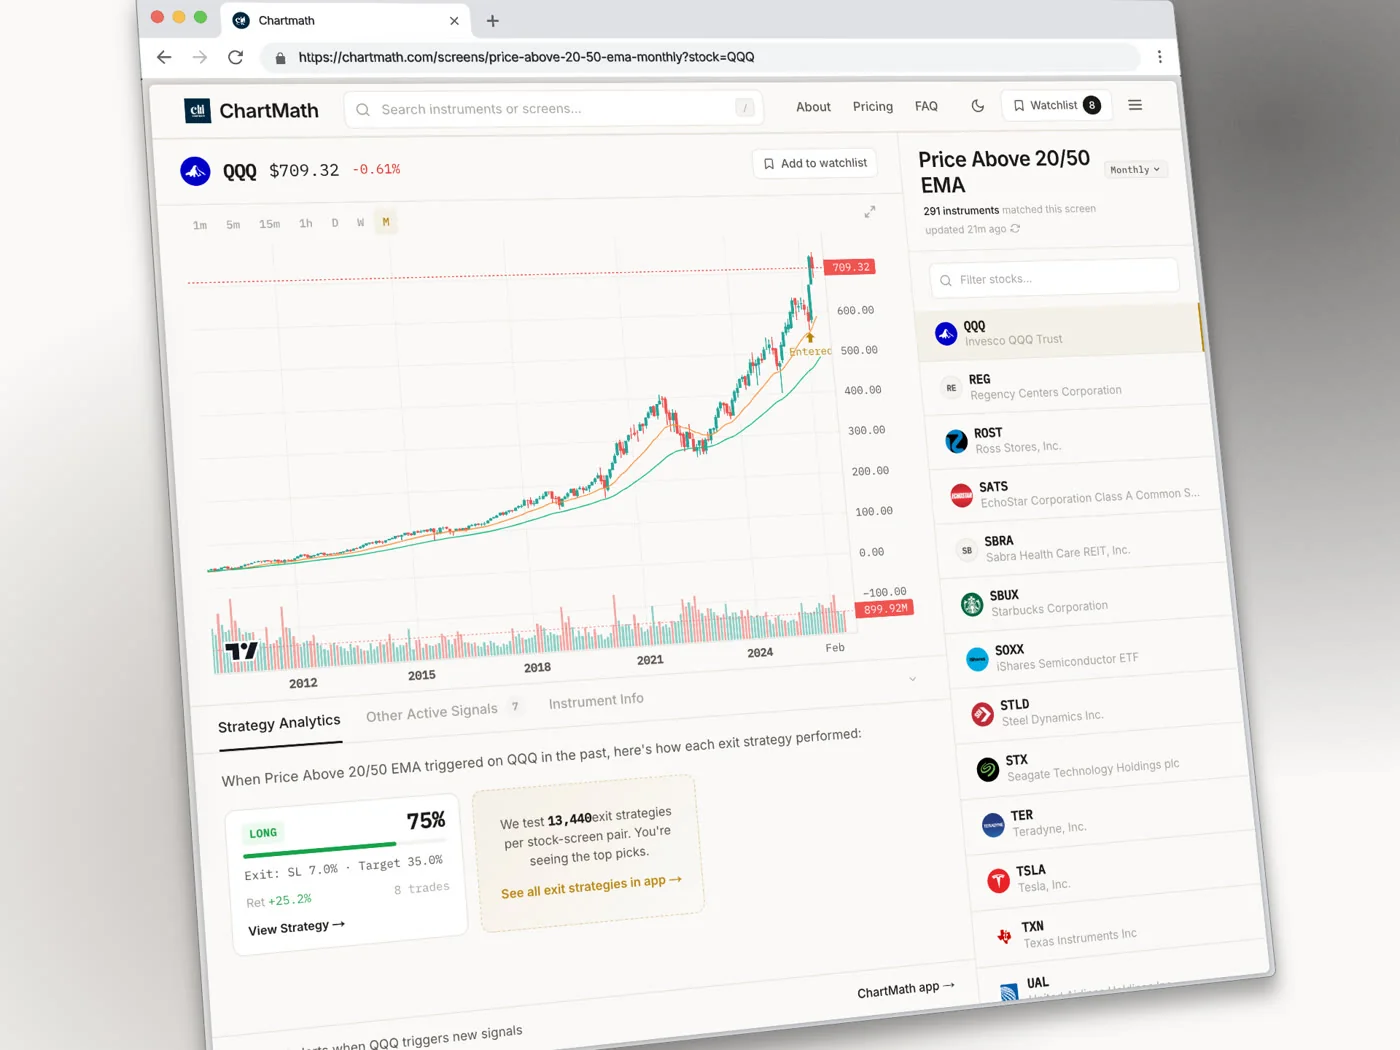
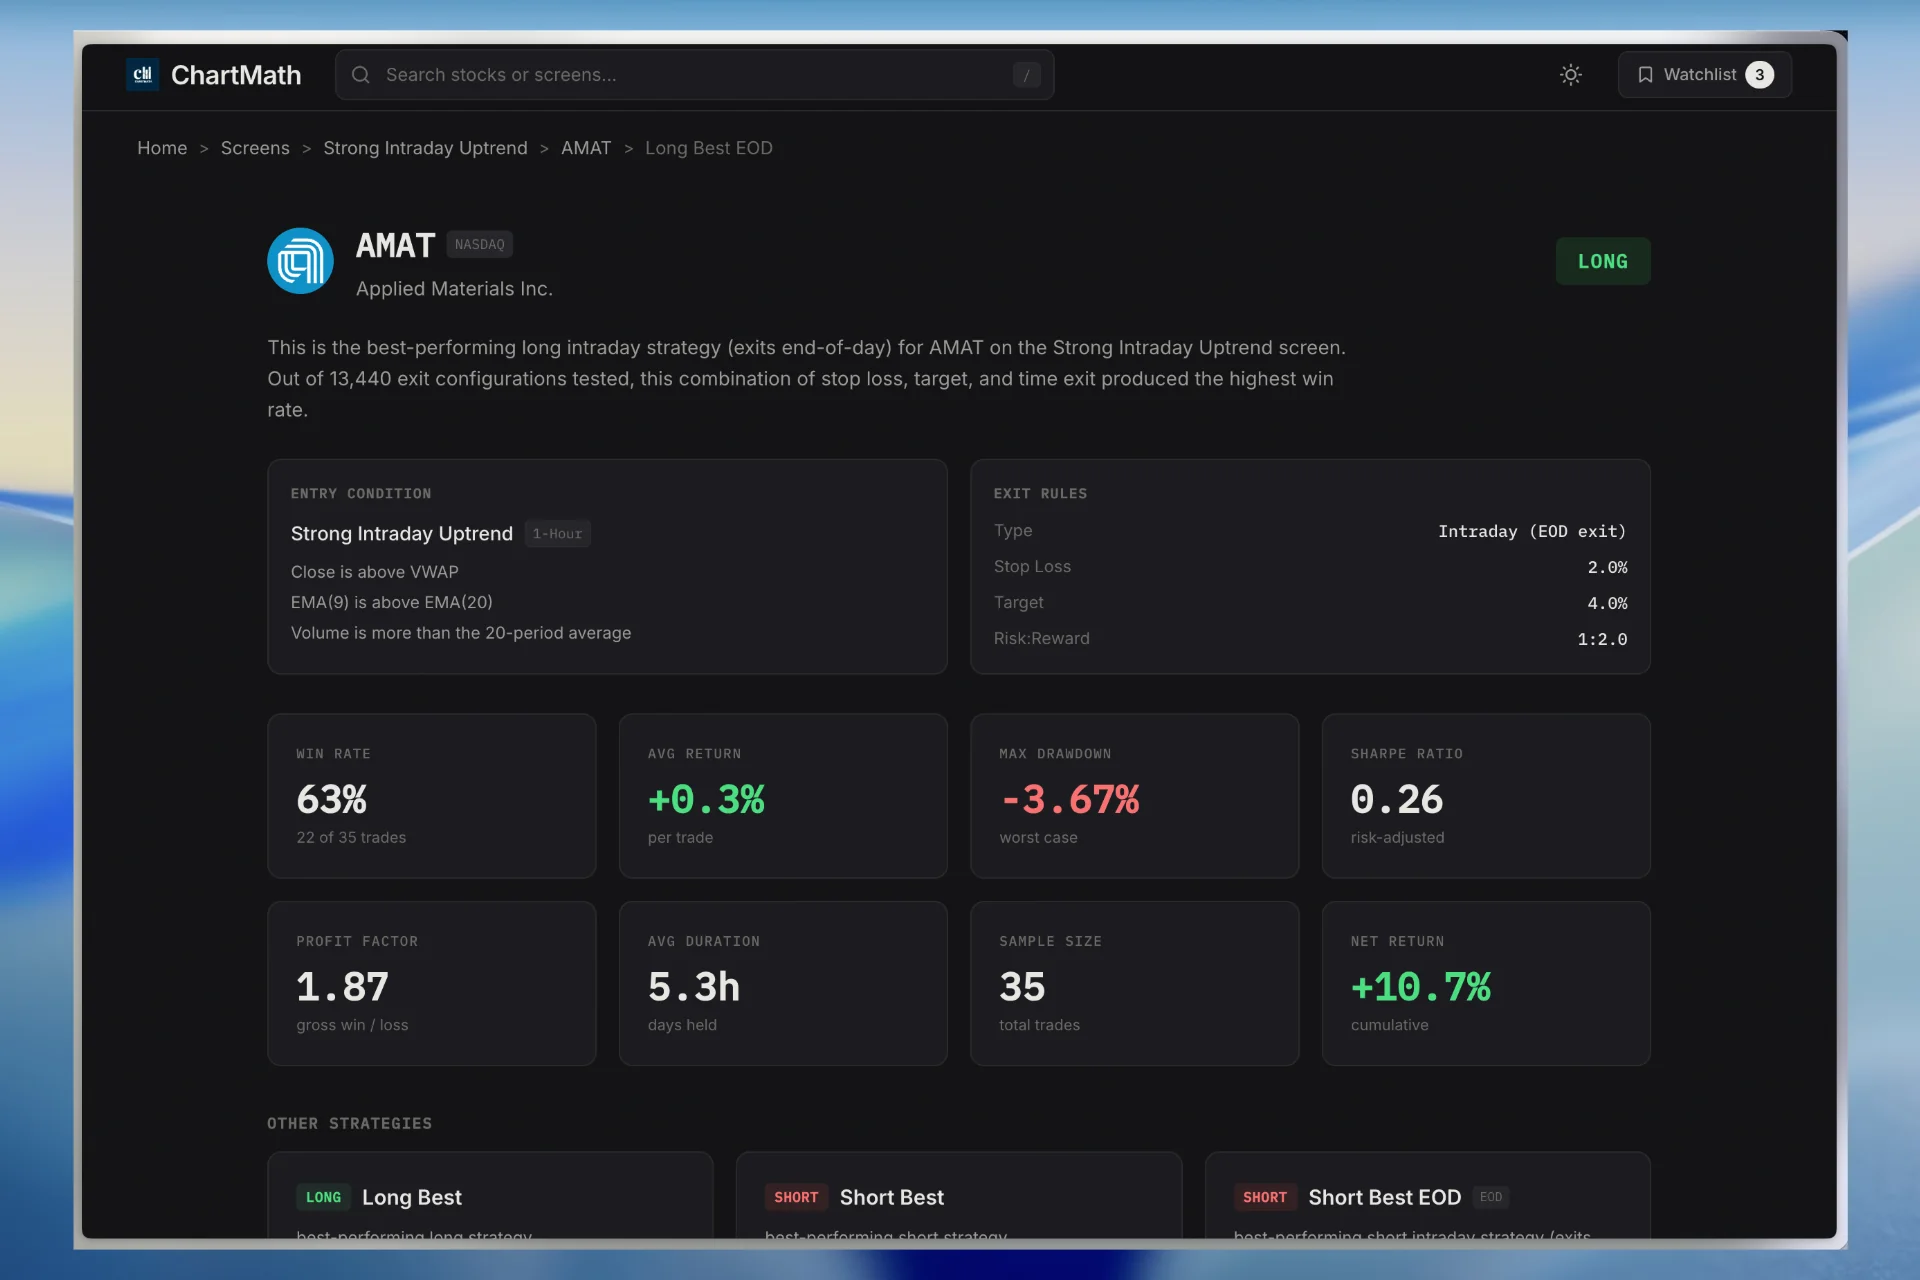
Underneath that explanation sits the data that turns a story into evidence: a backtested Win Rate and Average Return for that exact screen, computed from historical bar-close data, along with the matched sample size so you can judge whether the numbers are meaningful. This is deliberate. ChartMath never uses the word "accuracy," because a single accuracy score hides too much. Win Rate tells you how often the setup has historically worked. Average Return tells you what happened when it did. Together, with sample size attached, they give you something closer to a real track record than a vague confidence score ever could.
The app scans a curated universe of 500+ US equities, across 7 timeframes from 1-minute up through Monthly, against 200+ curated, read-only technical screens. There's no screen builder and no Pine Script to write; the screens are pre-built, AI-proposed, and backtested before they ever ship. That matters if you've felt boxed out of systematic trading because you don't know how to code. You don't need to here.
It's also worth being clear about what ChartMath is not. It's a copilot, not an autopilot. It surfaces the setup, explains the reasoning, and shows you the historical record. Nothing enters a position on its own; you tap to place every order. The machine narrows the field; you keep the call. Alerts arrive by push notification and email, timed to the moment a ticker enters a screen, so you're not stuck refreshing a static list hoping something changed.
Reading a Plain-English Alert: A Walkthrough
Here's what a well-structured alert should contain, field by field, so you know what to look for regardless of which tool sends it to you.
- Ticker and screen name — which stock, and which specific rule matched. Not a generic category, the actual named screen (for example, "VWAP Reclaim" rather than just "bullish signal").
- Timeframe — 1-minute, 5-minute, 15-minute, 1-hour, Daily, Weekly, or Monthly. This tells you whether you're looking at an intraday scalp setup or a multi-week swing idea.
- The plain-English reason, the actual price behavior that caused the match, described in a sentence you can verify against the chart yourself.
- A timestamp, so you know how fresh the setup is. A signal that fired two minutes ago behaves very differently than one that fired three hours ago.
- A deep link to the chart, so you can pull up the live picture instantly instead of hunting for the ticker in a separate app.
Understanding a few common building blocks helps you read these explanations faster. Relative volume (RVOL) compares today's trading volume to the recent average, and a high RVOL reading is often part of the reasoning behind breakout or gap screens, such as the volume surge 2x screen (daily), since it shows real participation behind a move rather than a quiet drift. A VWAP reclaim means price moved back above the volume-weighted average price, a level many intraday and swing traders treat as a shift from selling pressure to buying pressure; we cover this in depth in VWAP Trading: How to Use Volume-Weighted Average Price. Momentum indicators like moving average crossovers or RSI thresholds show up constantly in plain-English explanations because they're easy to state in a single sentence and easy to verify visually.
Once you've read the explanation, don't stop there. Check the Win Rate and Average Return for context, and check the sample size to see whether that win rate is built on 15 occurrences or 300. Then think about position sizing: even a setup with a strong historical edge should only ever risk a small, consistent slice of your account, not a decision made stock by stock in the heat of the moment. If you want a full framework for confirming a setup before committing capital, our guide on how to validate a swing trade setup before you risk capital walks through that process step by step.
Building a Habit Around Explained Signals
Plain-English explanations only pay off if you build a routine around them. Here's a simple structure that works for someone trading around a full-time job.
- Once in the morning: a quick scan of your watchlist and the Discover feed before the market opens, so you're not starting the day blind.
- Once at lunch or during a break: a two-minute check for any alerts that fired while you were working, reading the reason before deciding whether it's worth a closer look after hours.
- Once a week: a short review of which explained setups you acted on, which you skipped, and why, so you can spot patterns in your own decision-making rather than trading each alert in isolation.
This kind of cadence is exactly what we outline in Swing Trading with a Full-Time Job: A Real System, and pairing it with a structured weekly check-in, like the one described in How to Run a Weekly Trading Review in 20 Minutes, turns explained alerts into an actual improvement loop instead of a stream of one-off decisions. If you want the broader workflow view, How to Build an Efficient Trading Workflow in 2026 covers how all these pieces, screening, alerts, and review, fit together.
Frequently Asked Questions
Is a plain-English signal explanation the same as financial advice?
No. A plain-English explanation is educational context that tells you what pattern matched and why, based on historical data. It is not a recommendation to buy or sell. You still decide whether the setup fits your own risk tolerance, account size, and strategy, and you still place the trade yourself.
What is relative volume (RVOL) and why does it show up so often in these explanations?
Relative volume compares a stock's current trading volume to its typical volume over a recent period, often 20 or 50 days. A reading well above 1.0x suggests unusual participation, which is why RVOL frequently appears in explanations for breakout, gap, and momentum screens: it helps confirm a move is backed by real trading activity rather than a thin, easily-reversed spike.
Does a high Win Rate guarantee a winning trade?
No. A Win Rate describes how a setup has historically performed across many occurrences; it does not predict any single trade's outcome. That's exactly why sample size matters alongside the win rate. A 65% win rate across 300 occurrences carries far more weight than the same number across 10, and even a strong historical edge still requires disciplined position sizing, since any individual trade can land on the losing side of the distribution.
Can I use a tool like this alongside TradingView or Finviz?
Yes. Most traders use ChartMath as a discovery and alerting layer, then pull up TradingView or their own charting tool for deeper technical analysis before executing. It's built to work as a companion, not a replacement for the charting platform you already know.
Is ChartMath free to use right now?
Yes, ChartMath is free. No credit card required, and no feature gates.
See the "Why" Behind Every Signal for Yourself
Guessing at why an alert fired is a habit worth breaking, especially when you're trying to trade systematically around a full-time job. A signal without a reason forces you to reverse-engineer the setup on your own time or trust it blindly, and neither option builds the kind of confidence that actually holds up across dozens of trades. A signal paired with a plain-English explanation, a backtested Win Rate, and an Average Return gives you something you can check, learn from, and act on with your eyes open.
If you want to see this in practice before committing to anything, you can read the rule and the backtested record behind a named setup on the RSI oversold bounce screen (1H). To browse the screens without installing anything, the full screen catalog lets you read the rule and the backtested record behind all 200+ setups directly from your browser. And if you're ready to get explained alerts sent straight to your phone the moment a setup matches, you can download the ChartMath app and start building a systematic routine around signals you actually understand.
Recommended Resources
- Watch Demo
- Web Based Screener

See these setups live in ChartMath
200+ curated screens with backtest data. Free. No credit card required.